Mercer Capital's Bank Watch | December 2021 | Bank M&A 2022 | Gaining Altitude
JCI Summary Analysis
1. $1.4B $1.4B
$1.9B $2.0B $1.6B
$1.2B $1.2B
$1.4B
$1.8B
$2.1B$0.7B $0.8B
$1.1B
$1.3B $1.5B
2015 2016 2017 2018 2019
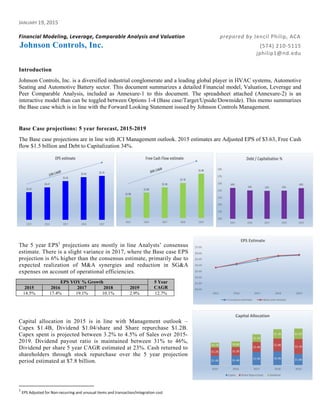
Capital Allocation
Capex Share Repurchase Dividend
JANUARY 19, 2015
Financial Modeling, Leverage, Comparable Analysis and Valuation prepared by Jencil Philip, ACA
Johnson Controls, Inc. (574) 210‐5115
jphilip1@nd.edu
Introduction
Johnson Controls, Inc. is a diversified industrial conglomerate and a leading global player in HVAC systems, Automotive
Seating and Automotive Battery sector. This document summarizes a detailed Financial model, Valuation, Leverage and
Peer Comparable Analysis, included as Annexure-1 to this document. The spreadsheet attached (Annexure-2) is an
interactive model than can be toggled between Options 1-4 (Base case/Target/Upside/Downside). This memo summarizes
the Base case which is in line with the Forward Looking Statement issued by Johnson Controls Management.
Base Case projections: 5 year forecast, 2015-2019
The Base case projections are in line with JCI Management outlook. 2015 estimates are Adjusted EPS of $3.63, Free Cash
flow $1.5 billion and Debt to Capitalization 34%.
The 5 year EPS1
projections are mostly in line Analysts’ consensus
estimate. There is a slight variance in 2017, where the Base case EPS
projection is 6% higher than the consensus estimate, primarily due to
expected realization of M&A synergies and reduction in SG&A
expenses on account of operational efficiencies.
EPS YOY % Growth 5 Year
CAGR2015 2016 2017 2018 2019
14.5% 17.4% 19.1% 10.1% 2.9% 12.7%
Capital allocation in 2015 is in line with Management outlook –
Capex $1.4B, Dividend $1.04/share and Share repurchase $1.2B.
Capex spent is projected between 3.2% to 4.5% of Sales over 2015-
2019. Dividend payout ratio is maintained between 31% to 46%,
Dividend per share 5 year CAGR estimated at 23%. Cash returned to
shareholders through stock repurchase over the 5 year projection
period estimated at $7.8 billion.
1
EPS Adjusted for Non‐recurring and unusual items and transaction/integration cost
2. 12.9x
14.7x
16.8x
18.9x 19.0x
17.4x
2.0x 1.5x 1.4x 1.3x 1.3x 1.3x
0.4x 0.3x 0.3x 0.3x 0.3x 0.3x
0.0x
2.0x
4.0x
6.0x
8.0x
10.0x
12.0x
14.0x
16.0x
18.0x
20.0x
2014 2015 2016 2017 2018 2019
Base case ‐ Forecast Debt Statistics
EBITDA / Interest Debt / EBITDA Debt / Capitalization
$8.2B
$10.5B
$11.9B
$13.7B
$14.9B $15.0B
$6.7B $6.4B $6.7B $7.2B $7.6B $8.1B
0.0B
2.0B
4.0B
6.0B
8.0B
10.0B
12.0B
14.0B
16.0B
2014 2015 2016 2017 2018 2019
Maximum Debt capacity
Total Debt Capacity Forecast Debt
Details 2014 2015 2016 2017 2018 2019
BaseCaseROE 10% 18% 20% 22% 22% 21%
ROE @additional debt 11% 26% 31% 38% 41% 37%
Leverage Benchmarking
The current Debt to Capitalization ratio of JCI stands at 36%. The Base case projections maintain this ratio at a
conservative range of 33-34% over the forecast period. However based on analysis of diversified industrial peers of JCI,
there is scope for raising additional debt in the current low interest environment while remaining Investment grade.
Peers Ingersoll-Rand and Textron have Investment grade credit
ratings with an average Debt / EBITDA of 2.5x as of Fiscal
2014. JCI’s Fiscal 2014 Debt / EBITDA is 2.0x and projected
to reduce to 1.30x by 2019. As of Fiscal 2014 JCI’s interest
coverage ratio is 12.9x which is substantially higher than that
of the aforementioned peers who average 6.2x. Further JCI’s
coverage ratio is expected to improve to 17.4x by 2019. This
presents an opportunity to potentially increase leverage while
still maintaining Investment grade.
Based on aforementioned Debt / EBITDA peer average of 2.5x,
JCI has a higher debt capacity of $8.2 billion against an actual
debt of $6.6 billion in Fiscal 2014. The maximum debt capacity
during the projection period increases from $10.5 billion in 2015
to $15.0 billion in 2019 as against expected debt in base case
projections of $6.4 billion in 2015 to $8.1 billion in 2019. This
however does not take into account changes in macroeconomics
factors and other peer variables over the projection period. The
additional debt can be used to repurchase common stock to boost
JCI’s ROE.
3. Debt Skyline
The repayment schedule of JCI’s debt is represented in the
Debt skyline.
JCI’s Long term debt is mostly fixed rate. The wide gaps
between years 2025-2035 and 2037-2040 may present re-
pricing risk in the event of a falling interest rate
environment. There is scope for a mix of floating rate debt
and smaller tranches of fixed rate debt for shorter maturity
terms or with call features.
Between years 2015-2022 a combined debt repayment of
$3.2 billion is due. This huge volume faces potential
market liquidity risk in the event of refinancing. It would
be ideal to spread out the maturities of future debt.
Performance Benchmarking
JCI’s historical profitability ratios are lagging behind peer comparables among diversified conglomerates, HVAC
and Automotive industry, while faring above average among the Power solutions industry peers.
High, 13%
High, 19%
High, 29%
Mean, 8%
Mean, 11%
Mean, 18%
Low, 4%
Low, 6%
Low, 10%
JCI 4%
JCI, 10%
JCI 10%
0% 5% 10% 15% 20% 25% 30% 35%
ROA
ROIC
ROE
Profitability ratios ‐ Diversified Industrial comparables
3M
Textron / Eaton
3M
Eaton
Eaton
3M
High, 18%
High, 25%
High, 47%
Mean, 9%
Mean, 15%
Mean, 23%
Low, 4%
Low, 7%
Low, 7%
JCI 4%
JCI, 10%
JCI,10%
0% 5% 10% 15% 20% 25% 30% 35% 40% 45% 50%
ROA
ROIC
ROE
Profitability ratios ‐ HVAC comparables
Aaon
Comfort
Aaon
Comfort
Comfort
Aaon
High, 8%
High, 9%
High, 19%
Mean, 4%
Mean, 5%
Mean, 12%
Low, 0%
Low, 1%
Low, 7%
JCI 4%
JCI, 10%
JCI, 10%
0% 2% 4% 6% 8% 10% 12% 14% 16% 18% 20%
ROA
ROIC
ROE
Profitability ratios ‐ Power comparables
Camel
Exide
Camel
GS Yuasa
Exide
Camel
High, 7%
High, 15%
High, 20%
Mean, 7%
Mean, 12%
Mean, 18%
Low, 6%
Low, 9%
Low, 17%
JCI 4%
JCI 10%
JCI, 10%
0% 5% 10% 15% 20% 25%
ROA
ROIC
ROE
Profitability ratios ‐ Automotive comparables
Lear
Huntsman
Huntsman
Lear
Huntsman
Lear
4. High, 52%
High, 27%
High, 22%
High, 20%
Mean, 35%
Mean, 19%
Mean, 15%
Mean, 10%
Low, 17%
Low, 11%
Low, 7%
Low, 4%
JCI, 15%
JCI, 8%
JCI, 5%
JCI, 3%
0% 10% 20% 30% 40% 50% 60%
Gross Profit
EBITDA
EBIT
Net Income
PROFITABILITY MARGINS ‐ DIVERSIFIED INDUSTRIAL
COMPARABLES
3M
Textron
Illinois Tool Works
Danaher
3M
Textron
Textron
Textron
High, 33%
High, 23%
High, 19%
High, 12%
Mean, 27%
Mean, 13%
Mean, 10%
Mean, 5%
Low, 18%
Low, 4%
Low, 3%
Low, 1%
JCI, 15%
JCI, 8%
JCI 5%
JCI, 3%
0% 5% 10% 15% 20% 25% 30% 35%
Gross Profit
EBITDA
EBIT
Net Income
PROFITABILITY MARGINS ‐ HVAC COMPARABLES
Aaon
Comfort
Aaon
Daikin
Aaon
Comfort
Comfort
Comfort
High, 17%
High, 11%
High, 8%
High, 4%
Mean, 13%
Mean, 9%
Mean, 7%
Mean, 3%
Low, 9%
Low, 8%
Low, 6%
Low, 3%
JCI 15%
JCI 8%
JCI, 5%
JCI, 3%
0% 2% 4% 6% 8% 10% 12% 14% 16% 18%
Gross Profit
EBITDA
EBIT
Net Income
PROFITABILITY MARGINS ‐ AUTOMOTIVE COMPARABLES
Huntsman
Lear
Huntsman
Huntsman
Huntsman
Lear
Lear
Lear
Low, ‐6%
Low, ‐4%
Low, ‐10%
Low, ‐2%
Mean, 9%
Mean, 6%
Mean, 9%
Mean, 12%
High, 29%
High, 13%
High, 33%
High, 21%
JCI 18%
JCI, 20%
JCI, 10%
JCI 48%
‐20% ‐10% 0% 10% 20% 30% 40% 50% 60%
Growth ‐ Diversified Industrial comparables Est. 2 year EPS CAGR
Hist. 2 year EPS CAGR
Hist. 2 year EBITDA CAGR
Est. 2 year EBITDA CAGR
Ingersoll‐Rand
Honeywell
Ingersoll‐Rand
Honeywell
Ingersoll‐Rand
Dover
Ingersoll‐Rand
Dover
Low, ‐15%
Low, 0%
Low, ‐9%
Low, 0%
Mean, 16%
Mean, 11%
Mean, 41%
Mean, 11%
High, 38%
High, 18%
High, 122%
High, 20%
JCI, 18%
JCI, 20%
JCI, 10%
JCI 48%
‐40% ‐20% 0% 20% 40% 60% 80% 100% 120% 140%
Growth ‐ HVAC comparables
Est. 2 year EPS CAGR
Hist. 2 year EPS CAGR
Hist. 2 year EBITDA CAGR
Est. 2 year EBITDA CAGR
Aaon
Daikin
Aaon
Daikin
Trane
Trane
Trane
Trane
A similar trend is observed for historical profitability margins between and JCI and its peers.
On the other hand JCI’s estimated forward 2 year EPS and EBITDA CAGR outperforms its peers. The Base case
estimates are largely in line with consensus estimates. This can be largely attributed to the success of JCI’s
acquisition and divestiture strategy in managing its business portfolios and to internal operational improvement
initiatives.
High, 23%
High, 18%
High, 15%
High, 13%
Mean, 18%
Mean, 9%
Mean, 6%
Mean, 2%
Low, 13%
Low, 3%
Low, 0%
Low, ‐9%
JCI, 15%
JCI, 8%
JCI, 5%
JCI 3%
‐15% ‐10% ‐5% 0% 5% 10% 15% 20% 25%
Gross Profit
EBITDA
EBIT
Net Income
PROFITABILITY MARGINS ‐ POWER COMPARABLES
Camel
Exide
Camel
Camel
Camel
Exide
Exide
Chaowei
5. Low, ‐4%
Low, 15%
Low, ‐11%
Low, 27%
Mean, 8%
Mean, 16%
Mean, ‐1%
Mean, 27%
High, 19%
High, 17%
High, 8%
High, 28%
JCI, 18%
JCI, 20%
JCI, 10%
JCI, 48%
‐20% ‐10% 0% 10% 20% 30% 40% 50% 60%
Growth ‐ Automotive comparables
Est. 2 year EPS CAGR
Hist. 2 year EPS CAGR
Hist. 2 year EBITDA CAGR
Est. 2 year EBITDA CAGR
Huntsman
Lear
Lear
Lear
Huntsman
Huntsman
Huntsman
Lear
Low, ‐21%
Low, 0%
Low, ‐46%
Low, 0%
Mean, 1%
Mean, 16%
Mean, ‐12%
Mean, 23%
High, 28%
High, 34%
High, 13%
High, 40%
JCI, 18%
JCI, 20%
JCI, 10%
JCI, 48%
‐60% ‐40% ‐20% 0% 20% 40% 60%
Growth ‐ Power comparables Est. 2 year EPS CAGR
Hist. 2 year EPS CAGR
Hist. 2 year EBITDA CAGR
Est. 2 year EBITDA CAGR
GS Yuasa
Camel
Camel
Camel
Exide
Exide
Chaowei
Exide
EV / 2015E EBITDA 10.2x
2015E EBITDA 4,184
Enterprise Value 42,778
Less: Total Debt (6,680)
Less: Preferred Stock -
Less: Noncontrolling Interest -
Plus: Cash and Cash Equivalents 409
Implied Equity Value $36,507
Fully Diluted Shares Outstanding 675.000
Implied Share Price $54.08
Implied Equity Value and Share Price
Valuation
Valuation was performed employing Discounted cash flow and Public company comparable techniques. JCI stock
is currently trading close to its implied share price derived from DCF technique.
Discounted Cash flow
Public Company Comparable
Enterprise Value Implied Perpetuity Growth Rate
Cumulative Present Value of FCF $8,514 Enterprise Value 35,568 Terminal Year Free Cash Flow $3,359
Less: Total Debt (6,680) WACC 10.7%
Terminal Value Less: Preferred Stock - Terminal Value 44,906
Terminal Year EBITDA $5,988 Less: Noncontrolling Interest -
Exit Multiple 7.5x Plus: Cash and Cash Equivalents 409 Implied Perpetuity Growth Rate 3.0%
Terminal Value $44,906
Discount Factor 0.60 Implied Equity Value $29,297 Implied EV/EBITDA
Present Value of Terminal Value $27,054 Enterprise Value $35,568
% of Enterprise Value 76.1% Fully Diluted Shares Outstanding 675.000 Fiscal 2014 EBITDA 3,274
Enterprise Value $35,568 Implied Share Price $43.40 Implied EV/EBITDA 10.9x
Implied Equity Value and Share Price
12. Johnson Controls, Inc.
Balance Sheet Projections
($ in millions, 5 year forecast: 2015-2019) Operating Scenario : Base
Historical Period
2012 2013 2014 2015 2016 2017 2018 2019
Cash and Cash Equivalents 265 1,055 409 968 1,488 2,124 2,311 2,801
Accounts Receivable, net 7,308 7,206 5,871 6,380 6,413 6,710 7,144 7,352
Inventories 2,343 2,325 2,477 2,401 2,251 2,333 2,327 2,322
Assets held for sale - 804 2,157 - - - - -
Other Current Assets 2,827 2,308 2,193 2,117 2,018 2,111 2,210 2,313
Total Current Assets $12,743 $13,698 $13,107 $11,866 $12,170 $13,279 $13,991 $14,788
Property, Plant and Equipment, net 6,440 6,585 6,314 6,787 7,256 8,103 8,931 9,336
Goodwill 6,982 6,589 7,127 7,127 7,127 7,127 7,127 7,127
Definite life Intangibles, net 632 683 1,092 997 907 821 738 661
Indefinite life Intangibles 315 316 547 547 547 547 547 547
Investment in Affiliates 948 1,024 1,018 1,018 1,018 1,018 1,018 1,018
Noncurrent Assets held for sale - - 630 - - - - -
Other Noncurrent Assets 2,894 2,623 2,969 2,969 2,969 2,969 2,969 2,969
Total Assets $30,954 $31,518 $32,804 $31,311 $31,994 $33,864 $35,321 $36,446
Short-term debt 323 119 183 - - - - -
Current portion of Long-term debt 424 819 140 915 773 405 295 500
Accounts Payable 6,114 6,318 5,270 5,264 4,848 5,026 5,305 5,611
Accrued Liabilities 1,090 1,215 1,124 1,180 1,106 1,146 1,189 1,236
Liabilities held for sale - 402 1,801 - - - - -
Other Current Liabilities 2,904 3,244 3,176 3,034 2,844 2,948 3,058 3,178
Total Current Liabilities 10,855 $12,117 $11,694 $10,393 $9,571 $9,525 $9,847 $10,524
Revolver - - - - - - - -
Long-term debt 5,321 4,560 6,357 5,442 5,904 6,813 7,328 7,566
Pension and postretirement benefit 1,248 750 865 865 865 865 865 865
Other long-term liabilities 1,504 1,360 2,132 2,132 2,132 2,132 2,132 2,132
Total liabilities: $18,928 $18,787 $21,048 $18,832 $18,473 $19,336 $20,172 $21,087
Total Stockholders' Equity 12,026 12,731 11,756 12,479 13,522 14,528 15,148 15,360
Total Liabilities and Equity $30,954 $31,518 $32,804 $31,311 $31,994 $33,864 $35,321 $36,446
Parity check (A = L+E) - - - - - - - -
Assumptions
Days Sales Outstanding (DSO) 65.7 63.5 50.0 55.0 58.0 58.0 59.0 58.0
Days Inventory Held (DIH) 25.2 25.0 25.7 26.0 26.0 26.0 25.0 24.0
Other Current Assets (% of sales) 7.0% 5.6% 5.1% 5.0% 5.0% 5.0% 5.0% 5.0%
Days Payable Outstanding (DPO) 65.7 67.8 54.6 57.0 56.0 56.0 57.0 58.0
Accrued Liabilities (% cost of sales) 3.2% 3.6% 3.2% 3.5% 3.5% 3.5% 3.5% 3.5%
Other Current Liabilities (% cost of sales) 8.6% 9.5% 9.0% 9.0% 9.0% 9.0% 9.0% 9.0%
Notes:
1. Effect of future Acquisitions and Divestitures are excluded from the forecast period. Hence Cash balance in years 2017-19 is on the higher side.
Projection Period
Current Assets
Current Liabilities
2. Movement in Other Comprehensive Income such as Foreign currency translation, Gain/Loss on Derivatives and Marketable securities are excluded from
the forecast period.
13. Johnson Controls, Inc.
Cash Flow Statement Projections
($ in millions, 5 year forecast: 2015-2019) Operating Scenario : Base
Projection Period
2015 2016 2017 2018 2019
Operating Activities
Net income attributable to JCI 2,211 2,586 3,048 3,287 3,277
Net income attributable to Non-controlling interests 120 120 120 120 120
Net Income 2,331 2,706 3,168 3,407 3,397
Plus: Depreciation 882 943 1,053 1,161 1,214
Plus: Amortization 95 90 86 83 77
Plus: Stock-based compensation expense 103 137 144 135 163
(Inc.) / Dec. in Working Capital (449) (464) (151) (94) 165
Change in Other Long-Term Assets and Liabilities - - - - -
Cash Flow from Operating Activities 2,963 3,412 4,301 4,692 5,017
Investing Activities
Capital Expenditures (1,355) (1,413) (1,900) (1,989) (1,619)
Additions to Definite Life Intangibles - - - - -
Business Divestitures
1
986 - - - -
Other Investing Activities - - - - -
Cash Flow from Investing Activities (369) ($1,413) ($1,900) ($1,989) ($1,619)
Cash Flow Available for Financing Activities 2,594 $1,999 $2,401 $2,703 $3,397
Financing Activities
Revolving Credit Facility - - - - -
Issuance of Long-Term Debt - 1,235 1,314 810 738
(Repayment) of Long-Term Debt (140) (915) (773) (405) (295)
Issuance of Short-Term Debt - - - - -
(Repayment) of Short-Term Debt (183) - - - -
Option proceeds 169 196 226 257 290
Dividends (681) (796) (1,091) (1,341) (1,501)
(Equity Repurchase) (1,200) (1,199) (1,441) (1,837) (2,138)
Cash Flow from Financing Activities ($2,035) ($1,479) ($1,765) ($2,516) ($2,907)
Excess / (Deficit) Cash for the Period $559 $520 $636 $187 $490
Beginning Cash Balance $409 $968 $1,488 $2,124 $2,311
Ending Cash Balance $968 $1,488 $2,124 $2,311 $2,801
Notes:
1. Assets held for sale are assumed be divested at Net Asset Value, hence no gain or loss recognized on the divestitures.
14. Johnson Controls, Inc.
Working Capital Projections
($ in millions, 5 year forecast: 2015-2019) Operating Scenario : Base
Historical Period
2012 2013 2014 2015 2016 2017 2018 2019
Sales 40,604 41,410 42,828 42,339 40,359 42,227 44,195 46,269
Cost of goods sold 33,943 33,993 35,246 33,709 31,601 32,757 33,973 35,308
Working capital balances
Accounts Receivable, net 7,308 7,206 5,871 6,380 6,413 6,710 7,144 7,352
Inventories 2,343 2,325 2,477 2,401 2,251 2,333 2,327 2,322
Other Current Assets 2,827 2,308 2,193 2,117 2,018 2,111 2,210 2,313
Total Non-Cash Current Assets: 12,478 $11,839 $10,541 $10,898 $10,682 $11,155 $11,681 $11,987
Accounts Payable 6,114 6,318 5,270 5,264 4,848 5,026 5,305 5,611
Accrued Liabilities 1,090 1,215 1,124 1,180 1,106 1,146 1,189 1,236
Other Current Liabilities 2,904 3,244 3,176 3,034 2,844 2,948 3,058 3,178
Total Non-Debt Current Liabilities 10,108 $10,777 9,570 9,478 $8,798 $9,120 $9,552 $10,024
Net working capital / (deficit) $2,370 $1,062 $971 $1,420 $1,884 $2,034 $2,129 $1,963
(Increase) / Decrease in Working Capital ($781) $1,308 $91 ($449) ($464) ($151) ($94) $165
Assumptions
Days Sales Outstanding (DSO) 65.7 63.5 50.0 55.0 58.0 58.0 59.0 58.0
Days Inventory Held (DIH) 25.2 25.0 25.7 26.0 26.0 26.0 25.0 24.0
Other Current Assets (% of sales) 7.0% 5.6% 5.1% 5.0% 5.0% 5.0% 5.0% 5.0%
Days Payable Outstanding (DPO) 65.7 67.8 54.6 57.0 56.0 56.0 57.0 58.0
Accrued Liabilities (% cost of sales) 3.2% 3.6% 3.2% 3.5% 3.5% 3.5% 3.5% 3.5%
Other Current Liabilities (% cost of sales) 8.6% 9.5% 9.0% 9.0% 9.0% 9.0% 9.0% 9.0%
Cash Conversion Cycle 25.1 20.6 21.1 24.0 28.0 28.0 27.0 24.0
Days change NA (4.5) 0.5 2.9 4.0 - (1.0) (3.0)
Numbers of days in the period 365
Projection Period
Current Liabilities
Current Assets
15. Johnson Controls, Inc.
Other Long-Term Items Projections
($ in millions, 5 year forecast: 2015-2019) Operating Scenario : Base
Historical Period
2012 2013 2014 2015 2016 2017 2018 2019
Assets
Indefinite life intangibles 315 316 547 547 547 547 547 547
Goodwill 6,982 6,589 7,127 7,127 7,127 7,127 7,127 7,127
Investment in Affiliates 948 1,024 1,018 1,018 1,018 1,018 1,018 1,018
Other Noncurrent Assets - 2,623 2,969 2,969 2,969 2,969 2,969 2,969
Deferred Tax Asset - 1,349 1,834 1,834 1,834 1,834 1,834 1,834
Others - 1,274 1,135 1,135 1,135 1,135 1,135 1,135
Total Other Long-Term Assets: $8,245 $10,552 $11,661 11,661 $11,661 $11,661 $11,661 $11,661
(Increase) / Decrease in Other Assets: ($2,307) ($1,109) $0 $0 $0 $0 $0
Liabilities
Pension/postretirement benefit obligations 1,248 750 865 865 865 865 865 865
Other long-term liabilities 1,504 1,360 2,132 2,132 2,132 2,132 2,132 2,132
Total Non-Debt Current Liabilities $2,752 $2,110 $2,997 $2,997 $2,997 $2,997 $2,997 $2,997
Increase / (decrease) in other long-term liabilities: ($642) $887 $0 $0 $0 $0 $0
Change in Other Long-Term Assets and Liabilities ($2,949) ($222) $0 $0 $0 $0 $0
Held for sale
Noncurrent Assets held for sale - - 630 - - - - -
Cash received on Divestiture $0 $0 $630 $0 $0 $0 $0 $0
Projection Period
16. Johnson Controls, Inc.
Divestitures
($ in millions, 5 year forecast: 2015-2019) Operating Scenario : Base
Historical Period
2012 2013 2014 2015 2016 2017 2018 2019
Held for sale
Assets held for sale - 804 2,157 ‐ ‐ ‐ ‐ ‐
Noncurrent Assets held for sale - - 630 - - - - -
Liabilities held for sale - (402) (1,801) ‐ ‐ ‐ ‐ ‐
Cash received on Divestiture - 402 986 - - - - -
Notes:
1. Assets held for sale are assumed be divested at Net Asset Value, hence no gain or loss recognized on the divestitures.
Projection Period
17. Johnson Controls, Inc.
Capex Projections
($ in millions, 5 year forecast: 2015-2019) Operating Scenario : Base
Historical Period
2012 2013 2014 2015 2016 2017 2018 2019 Step function
Sales 40,604 41,410 42,828 42,339 40,359 42,227 44,195 46,269
Capital Expenditures 1,831 1,377 1,199 1,355 1,413 1,900 1,989 1,619
Capital Expenditures as % of Sales 4.5% 3.3% 2.8% 3.2% 3.5% 4.5% 4.5% 3.5%
Depreciation expense 768 877 869 882 943 1,053 1,161 1,214
Depreciation as % of Capex 41.9% 63.7% 72.5% 65.1% 66.8% 55.4% 58.4% 74.9%
Depreciation as % of PP&E, net 11.9% 13.3% 13.8% 13.0% 13.0% 13.0% 13.0% 13.0% 0.0%
Beginning Net PP&E 6,314 6,787 7,256 8,103 8,931
Capital expenditures 1,355 1,413 1,900 1,989 1,619
(Depreciation expense) (882) (943) (1,053) (1,161) (1,214)
(Asset sales and write-offs) - - - - -
Ending Net PP&E $6,440 $6,585 $6,314 $6,787 $7,256 $8,103 $8,931 $9,336
Projection Period
18. Johnson Controls, Inc.
Definite Life Intangibles Projections
($ in millions, 5 year forecast: 2015-2019) Operating Scenario : Base
Historical Period
2012 2013 2014 2015 2016 2017 2018 2019 Step function
Sales 40,604 41,410 42,828 42,339 40,359 42,227 44,195 46,269
Additions to Definite Life Intangibles1
(60) 56 450 - - - - -
Additions as % of Sales (0.1%) 0.1% 1.1% 0.0% 0.0% 0.0% 0.0% 0.0% 0.0%
Amortization expense 56.00 75.00 86.00 95.0 90.0 86.0 83.0 77.0
Amortization as % of Intangibles, net 8.9% 11.0% 7.9% 9.5% 9.9% 10.5% 11.2% 11.6%
Beginning Definite Life Intangibles 1,092.0 997.0 907.0 821.0 738.0
Additions to Definite Life Intangibles - - - - -
(Amortization expense) (95.0) (90.0) (86.0) (83.0) (77.0)
(Write-offs) - - - - -
Ending Net Intangibles $632 $683 $1,092 $997 $907 $821 $738 $661
Notes:
1. Since the additions to Intangible Assets is primarily from business acquisitions, no further additions are considered in forecast period.
Projection Period