SlideShare a Scribd company logo
1 of 5
Download to read offline
 
 
Hexaware Technologies 
Margin troughed, Sales uptick likely; Upgrade to ‘Accumulate’
August 06, 2014 
Prabhudas Lilladher Pvt. Ltd. and/or its associates (the 'Firm') does and/or seeks to do business with companies covered in its research reports. As a result investors should be aware that 
the Firm may have a conflict of interest that could affect the objectivity of the report. Investors should consider this report as only a single factor in making their investment decision. 
Please refer to important disclosures and disclaimers at the end of the report 
 
Company Update 
Shashi Bhusan 
shashibhusan@plindia.com 
+91‐22‐66322300 
Hussain Kagzi 
hussainkagzi@plindia.com 
+91‐22‐66322242 
Rating  Accumulate 
Price  Rs141 
Target Price  Rs160 
Implied Upside   13.5% 
Sensex   25,908 
Nifty  7,747 
(Prices as on August 05, 2014) 
Trading data 
Market Cap. (Rs bn)  41.7 
Shares o/s (m)  296.5 
3M Avg. Daily value (Rs m)  474.8 
Major shareholders 
Promoters   63.83% 
Foreign   15.68% 
Domestic Inst.  2.19% 
Public & Other   18.30% 
Stock Performance 
 (%)  1M  6M  12M 
Absolute  (9.4)  5.0  18.3 
Relative   (9.2)  (22.9)  (16.7) 
How we differ from Consensus 
EPS (Rs)  PL  Cons.  % Diff. 
2014  11.5  10.9  4.8 
2015  14.3  13.2  8.6 
 
Price Performance (RIC: HEXT.BO, BB: HEXW IN)
 
Source: Bloomberg 
0
50
100
150
200
Aug‐13
Oct‐13
Dec‐13
Feb‐14
Apr‐14
Jun‐14
Aug‐14
(Rs)
We upgrade Hexaware Technologies (HEXW) to “Accumulate” from “Reduce” as our 
long‐standing  hypothesis  of  margin  reset  with  moderating  growth  played  out  in 
Q2CY14.  We  see  the  benefits  of  investments  to  flow‐in  earlier  than  consensus 
expectation as demand environment remains healthy. We see bottoming‐out of the 
consensus expectations.  
 Margin expectation bottomed out, improvement likely: In conjunction with our 
hypothesis over the last two years about stretched levers and under‐investment 
in business that resulted in margin improvement, margin reset happened over 
the last three quarters as EBITDA margins eroded by 713bps. The management 
started  making  investment  in  the  business  as  they  are  eyeing  for  growth  in 
improved environment. We see headwinds in Q3CY14 due to wage hike and cost 
associated  with  “Consultant  Fees”.  However,  we  expect  EBITDA  margin  to 
bottom‐out in Q3CY14 (@ 16%) with steady improvement in CY15. 
 Growth  momentum  to  improve,  accelerate  in  CY15:  According  to  the 
management, revenue growth in H2CY14 is likely to remain sustained. HEXW is 
chasing three large deals and initiating two new sales engagements (early stage 
of discussion). The deal pipeline has witnessed steady improvement during the 
quarter. Growth is likely to be strong on the back of new deal wins. However, 
we see improving revenue momentum to only yield high single digit revenue 
growth  in  USD  terms  in  CY14,  but  mid‐teens  growth  in  CY15  (PLe:  15.9%, 
implying CQGR: 3.5%). 
 Revising CY14E and CY15E estimates upward: We revise our estimates upward 
for revenue and margin assumptions of CY14E and CY15E. 
 Valuation & Recommendation – Upgrade to “Accumulate” with a revised TP of 
Rs160:  We  see  margin  expectation  of  consensus  to  bottom‐out  in  Q3CY14. 
However,  we  see  steady  improvement  in  margin  thereon,  with  revenue 
momentum seeing acceleration in CY15 to mid‐teens. We revise our multiple to 
11x  from  9x  as  company  sustained  healthy  cash  conversion  and  dividend 
payout. We upgrade to “Accumulate”, with a revised TP of Rs160 (from Rs120). 
 
   
Key financials (Y/e December)    2012 2013  2014E 2015E
Revenues (Rs m)  19,482 22,854  24,874 28,609
     Growth (%)  34.3 17.3  8.8 15.0
EBITDA (Rs m)  4,074 5,124  4,291 5,344
PAT (Rs m)  3,276 3,792  3,435 4,285
EPS (Rs)  11.0 12.6  11.5 14.3
     Growth (%)  21.4 14.5  (9.4) 24.8
Net DPS (Rs)  6.6 9.9  5.7 5.9
 
Profitability & Valuation    2012 2013  2014E 2015E
EBITDA margin (%)  20.9 22.4  17.3 18.7
RoE (%)  29.5 31.6  26.7 28.6
RoCE (%)  29.4 31.4  26.7 28.6
EV / sales (x)  2.0 1.7  1.6 1.3
EV / EBITDA (x)  9.8 7.6  9.1 7.0
PE (x)  12.7 11.1  12.3 9.8
P / BV (x)  3.5 3.5  3.1 2.6
Net dividend yield (%)  4.7 7.1  4.0 4.2
Source: Company Data; PL Research 
   
August 06, 2014  2
  Hexaware Technologies 
Exhibit 1: Revising estimates for CY14E & CY15E downwards 
   New  Old  Revision  Consensus  Variance 
   CY14E  CY15E  CY14E CY15E CY14E CY15E CY14E  CY15E  CY14E CY15E
Revenue ($ m)  416.3  485.2  416.3 467.1 0.0% 3.9%  417.72   475.80  ‐0.3% 2.0%
Revenue (Rs m)   24,874   28,627   24,874   27,559  0.0% 3.9% 24959  28072  ‐0.3% 2.0%
EBITDA Margin  17.3%  18.4%  17.0% 17.0% 23 bps 139 bps 18.0%  18.6%  ‐78 bps ‐22 bps
EPS   11.42   14.05   11.27   12.54  1.3% 12.0%  10.93   13.15  4.5% 6.8%
Target Price  160  120  33.3%  143  11.8% 
Source: Bloomberg, PL Research 
Exhibit 2: EBITDA reset is in‐line with our expectation – Factoring‐in improvement 
14%
16%
18%
20%
22%
24%
‐5%
‐2%
1%
4%
7% Q1CY11
Q2CY11
Q3CY11
Q4CY11
Q1CY12
Q2CY12
Q3CY12
Q4CY12
Q1CY13
Q2CY13
Q3CY13
Q4CY13
Q1CY14
Q2CY14
Q3CY14E
Q4CY14E
CY15E*
Revs (QoQ gr.) SG&A (% of revs) (RHS) EBITDA Margin (RHS)
 
Source: Company Data, PL Research, * Revenue growth is taken at CQGR (PLe) 
Exhibit 3: Onsite ramp‐up: To accelerate offshore growth 
‐6%
‐2%
2%
6%
10%
14%
Q1CY11
Q2CY11
Q3CY11
Q4CY11
Q1CY12
Q2CY12
Q3CY12
Q4CY12
Q1CY13
Q2CY13
Q3CY13
Q4CY13
Q1CY14
Q2CY14
Onsite Revs gr. Offshore Revs gr.
 
Source: Company Data, PL Research 
   
August 06, 2014  3
  Hexaware Technologies 
Exhibit 4: Sustaining cash flow at healthy level despite volatile earnings 
‐48.0%
‐23.0%
2.0%
27.0%
52.0%
77.0%
102.0%
127.0%
‐56%
‐16%
24%
64%
104%
144%
184%
Q1FY11
Q2FY11
Q3FY11
Q4FY11
Q1FY12
Q2FY12
Q3FY12
Q4FY12
Q1FY13
Q2FY13
Q3FY13
Q4FY13
Q1FY14
Q2FY14
CFO/PAT FCF/EBITDA (RHS)
 
Source: Company Data, PL Research 
Exhibit 5: Dividend payout ahead of industry average 
0.0%
10.0%
20.0%
30.0%
40.0%
50.0%
60.0%
CY08 CY09 CY10 CY11 CY12 CY13
Dividend Payout Ratio
 
Source: Company Data, PL Research 
Exhibit 6: PER Chart 
6.5x
0.0
2.0
4.0
6.0
8.0
10.0
12.0
14.0
Aug‐08
Dec‐08
May‐09
Sep‐09
Jan‐10
Jun‐10
Nov‐10
Mar‐11
Aug‐11
Dec‐11
May‐12
Sep‐12
Jan‐13
Jun‐13
Nov‐13
Mar‐14
Aug‐14
1‐Yr Forward PER Average PER
 
Source: Company Data, Bloomberg, PL Research 
   
   
August 06, 2014  4
  Hexaware Technologies 
Income Statement (Rs m)           
Y/e December   2012  2013  2014E 2015E
Net Revenue  19,482  22,854  24,874 28,609
Software Dev. Exp.  11,846  13,826  15,818 17,964
Gross Profit  7,636  9,028  9,056 10,646
Employee Cost  —  —  — —
Other Expenses  3,562  3,904  4,764 5,302
EBITDA  4,074  5,124  4,291 5,344
Depr. & Amortization  324  386  443 497
Net Interest  —  —  — —
Other Income  290  58  555 647
Profit before Tax  4,040  4,796  4,403 5,493
Total Tax  764  1,004  969 1,209
Profit after Tax  3,276  3,792  3,435 4,285
Ex‐Od items / Min. Int.  —  —  — —
Adj. PAT  3,276  3,792  3,435 4,285
Avg. Shares O/S (m)  296.5  299.9  299.9 299.9
EPS (Rs.)  11.0  12.6  11.5 14.3
 
Cash Flow Abstract (Rs m)    
Y/e December     2012  2013  2014E 2015E
C/F from Operations  2,199  3,358  2,653 4,343
C/F from Investing  (2,484)  (1,162)  (871) (1,001)
C/F from Financing  (1,897)  (1,255)  (1,577) (1,770)
Inc. / Dec. in Cash  (2,182)  941  205 1,572
Opening Cash  4,132  1,951  2,892 3,097
Closing Cash  1,951  2,892  3,097 4,669
FCFF  1,915  5,780  1,783 3,342
FCFE  1,993  5,711  1,783 3,342


Key Financial Metrics 
Y/e December             2012  2013  2014E 2015E
Growth     
Revenue (%)  34.3  17.3  8.8 15.0
EBITDA (%)  53.9  25.8  (16.2) 24.5
PAT (%)  22.7  15.7  (9.4) 24.8
EPS (%)  21.4  14.5  (9.4) 24.8
Profitability     
EBITDA Margin (%)  20.9  22.4  17.3 18.7
PAT Margin (%)  16.8  16.6  13.8 15.0
RoCE (%)  29.4  31.4  26.7 28.6
RoE (%)  29.5  31.6  26.7 28.6
Balance Sheet     
Net Debt : Equity  (0.2)  (0.3)  (0.2) (0.3)
Net Wrkng Cap. (days)  —  —  — —
Valuation     
PER (x)  12.7  11.1  12.3 9.8
P / B (x)  3.5  3.5  3.1 2.6
EV / EBITDA (x)  9.8  7.6  9.1 7.0
EV / Sales (x)  2.0  1.7  1.6 1.3
Earnings Quality     
Eff. Tax Rate  18.9  20.9  22.0 22.0
Other Inc / PBT  7.2  1.2  12.6 11.8
Eff. Depr. Rate (%)  5.0  5.3  5.4 5.4
FCFE / PAT  60.8  150.6  51.9 78.0
Source: Company Data, PL Research. 
 
   
Balance Sheet Abstract (Rs m)   
Y/e December      2012  2013  2014E 2015E
Shareholder's Funds  12,038  11,992  13,731 16,246
Total Debt  78  9  9 9
Other Liabilities  396  480  480 480
Total Liabilities  12,512  12,482  14,220 16,735
Net Fixed Assets  5,199  5,371  5,798 6,302
Goodwill  —  —  — —
Investments  2,354  3,383  3,383 3,383
Net Current Assets  3,496  2,034  3,345 5,356
     Cash & Equivalents  1,969  3,011  3,097 4,669
     Other Current Assets  4,799  4,853  5,969 7,267
     Current Liabilities  3,272  5,830  5,721 6,580
Other Assets  1,462  1,695  1,695 1,695
Total Assets  12,512  12,482  14,220 16,735


Quarterly Financials (Rs m)     
Y/e December      Q3CY13  Q4CY13  Q1CY14 Q2CY14
Net Revenue  6,211  6,200  5,889 6,104
EBITDA  1,478  1,394  1,133 1,017
% of revenue  23.8  22.5  19.2 16.7
Depr. & Amortization  98  101  108 108
Net Interest  —  —  — —
Other Income  (120)  (2)  (50) 173
Profit before Tax  1,260  1,291  975 1,082
Total Tax  272  259  272 227
Profit after Tax  988  1,032  703 855
Adj. PAT  988  1,032  703 855
 
Key Operating Metrics 
Y/e December       2012  2013 2014E 2015E
Total Technical Billed (Headcount) 8,371  — — —
Onsite Realization ($/hr)  73.8  72.9 72.1 75.0
Offshore Realization ($/hr)  23.0  23.0 22.7 23.6
Software Dev. Exp. (% of Sales)  60.8  60.5 63.6 62.8
Sales & Mktg. (% of Sales)  18.3  17.1 19.2 18.5
Currency (Re/$)  53  59 60 59
Revenue (US$ m)  364  389 416 485
Source: Company Data, PL Research. 
 
   
August 06, 2014  5
  Hexaware Technologies 


Prabhudas Lilladher Pvt. Ltd. 
3rd Floor, Sadhana House, 570, P. B. Marg, Worli, Mumbai‐400 018, India 
Tel: (91 22) 6632 2222 Fax: (91 22) 6632 2209 
Rating Distribution of Research Coverage   
31.8%
49.1%
19.1%
0.0%
0%
10%
20%
30%
40%
50%
60%
BUY Accumulate Reduce Sell
% of Total Coverage
 
PL’s Recommendation Nomenclature     
BUY   :  Over 15% Outperformance to Sensex over 12‐months  Accumulate  :  Outperformance to Sensex over 12‐months 
Reduce  :  Underperformance to Sensex over 12‐months  Sell  :  Over 15% underperformance to Sensex over 12‐months 
Trading Buy  :  Over 10% absolute upside in 1‐month  Trading Sell  :  Over 10% absolute decline in 1‐month 
Not Rated (NR)  :  No specific call on the stock  Under Review (UR)  :  Rating likely to change shortly 
This  document  has  been  prepared  by  the  Research  Division  of  Prabhudas  Lilladher  Pvt.  Ltd.  Mumbai,  India  (PL)  and  is  meant  for  use  by  the  recipient  only  as 
information and is not for circulation.  This document is not to be reported or copied or made available to others without prior permission of PL. It should not be 
considered or taken as an offer to sell or a solicitation to buy or sell any security. 
The information contained in this report has been obtained from sources that are considered to be reliable. However, PL has not independently verified the accuracy 
or completeness of the same. Neither PL nor any of its affiliates, its directors or its employees accept any responsibility of whatsoever nature for the information, 
statements and opinion given, made available or expressed herein or for any omission therein. 
Recipients of this report should be aware that past performance is not necessarily a guide to future performance and value of investments can go down as well. The 
suitability  or  otherwise  of  any  investments  will  depend  upon  the  recipient's  particular  circumstances  and,  in  case  of  doubt,  advice  should  be  sought  from  an 
independent expert/advisor. 
Either PL or its affiliates or its directors or its employees or its representatives or its clients or their relatives may have position(s), make market, act as principal or 
engage in transactions of securities of companies referred to in this report and they may have used the research material prior to publication. 
We may from time to time solicit or perform investment banking or other services for any company mentioned in this document. 

More Related Content

What's hot

Citadel Group (CGL) - initiation report - latent value in a trusted it servic...
Citadel Group (CGL) - initiation report - latent value in a trusted it servic...Citadel Group (CGL) - initiation report - latent value in a trusted it servic...
Citadel Group (CGL) - initiation report - latent value in a trusted it servic...George Gabriel
 
Financial Analysis HCC
Financial Analysis HCCFinancial Analysis HCC
Financial Analysis HCCJaspal Bhatia
 
Financial Forecast PowerPoint Presentation Slides
Financial Forecast PowerPoint Presentation Slides Financial Forecast PowerPoint Presentation Slides
Financial Forecast PowerPoint Presentation Slides SlideTeam
 
Bajaj Finance Q1FY15: AUM growth remained strong at Rs269.4 bn, buy
Bajaj Finance Q1FY15: AUM growth remained strong at Rs269.4 bn, buyBajaj Finance Q1FY15: AUM growth remained strong at Rs269.4 bn, buy
Bajaj Finance Q1FY15: AUM growth remained strong at Rs269.4 bn, buyIndiaNotes.com
 
Voltas Visit Update: Muted near-term outlook - Prabhudas Lilladher
Voltas Visit Update: Muted near-term outlook - Prabhudas LilladherVoltas Visit Update: Muted near-term outlook - Prabhudas Lilladher
Voltas Visit Update: Muted near-term outlook - Prabhudas LilladherIndiaNotes.com
 
Acquisition of Mercury Athletic
Acquisition of Mercury AthleticAcquisition of Mercury Athletic
Acquisition of Mercury AthleticJB Gough
 
Mercury athletic footwear
Mercury athletic footwearMercury athletic footwear
Mercury athletic footwearantonesc
 
Zensar Technologies Q1FY15: Results in line with our expectations, buy
 Zensar Technologies Q1FY15: Results in line with our expectations, buy Zensar Technologies Q1FY15: Results in line with our expectations, buy
Zensar Technologies Q1FY15: Results in line with our expectations, buyIndiaNotes.com
 
4 q12 conference call presentation
4 q12 conference call presentation4 q12 conference call presentation
4 q12 conference call presentationBancoABCRI
 
Majesco 1QFY18
Majesco 1QFY18Majesco 1QFY18
Majesco 1QFY18Mohit Jn
 
Intellect 1QFY18
Intellect 1QFY18Intellect 1QFY18
Intellect 1QFY18Mohit Jn
 
Financial Statement Analysis PowerPoint Presentation Slides
Financial Statement Analysis PowerPoint Presentation SlidesFinancial Statement Analysis PowerPoint Presentation Slides
Financial Statement Analysis PowerPoint Presentation SlidesSlideTeam
 
Zydus Wellness reports a subdued quarter, hold - Nirmal Bang
Zydus Wellness reports a subdued quarter, hold - Nirmal BangZydus Wellness reports a subdued quarter, hold - Nirmal Bang
Zydus Wellness reports a subdued quarter, hold - Nirmal BangIndiaNotes.com
 
Hero honda ru2 qfy2011-291010
Hero honda ru2 qfy2011-291010Hero honda ru2 qfy2011-291010
Hero honda ru2 qfy2011-291010Angel Broking
 
Mercury athletic footwear
Mercury athletic footwearMercury athletic footwear
Mercury athletic footwearantonesc
 
GuessBox Financial Model 2017
GuessBox Financial Model 2017GuessBox Financial Model 2017
GuessBox Financial Model 2017GuessBox
 
LIC Housing Finance Q1FY15 performance in line with estimates; buy
 LIC Housing Finance Q1FY15 performance in line with estimates; buy LIC Housing Finance Q1FY15 performance in line with estimates; buy
LIC Housing Finance Q1FY15 performance in line with estimates; buyIndiaNotes.com
 
12 December Daily Market Report
12 December Daily Market Report12 December Daily Market Report
12 December Daily Market ReportQNB Group
 
Financial Statement Analysis Powerpoint Presentation Slides
Financial Statement Analysis Powerpoint Presentation SlidesFinancial Statement Analysis Powerpoint Presentation Slides
Financial Statement Analysis Powerpoint Presentation SlidesSlideTeam
 

What's hot (20)

Citadel Group (CGL) - initiation report - latent value in a trusted it servic...
Citadel Group (CGL) - initiation report - latent value in a trusted it servic...Citadel Group (CGL) - initiation report - latent value in a trusted it servic...
Citadel Group (CGL) - initiation report - latent value in a trusted it servic...
 
Financial Analysis HCC
Financial Analysis HCCFinancial Analysis HCC
Financial Analysis HCC
 
Financial Forecast PowerPoint Presentation Slides
Financial Forecast PowerPoint Presentation Slides Financial Forecast PowerPoint Presentation Slides
Financial Forecast PowerPoint Presentation Slides
 
Bajaj Finance Q1FY15: AUM growth remained strong at Rs269.4 bn, buy
Bajaj Finance Q1FY15: AUM growth remained strong at Rs269.4 bn, buyBajaj Finance Q1FY15: AUM growth remained strong at Rs269.4 bn, buy
Bajaj Finance Q1FY15: AUM growth remained strong at Rs269.4 bn, buy
 
Voltas Visit Update: Muted near-term outlook - Prabhudas Lilladher
Voltas Visit Update: Muted near-term outlook - Prabhudas LilladherVoltas Visit Update: Muted near-term outlook - Prabhudas Lilladher
Voltas Visit Update: Muted near-term outlook - Prabhudas Lilladher
 
Acquisition of Mercury Athletic
Acquisition of Mercury AthleticAcquisition of Mercury Athletic
Acquisition of Mercury Athletic
 
Mercury athletic footwear
Mercury athletic footwearMercury athletic footwear
Mercury athletic footwear
 
Optr 04052011
Optr 04052011Optr 04052011
Optr 04052011
 
Zensar Technologies Q1FY15: Results in line with our expectations, buy
 Zensar Technologies Q1FY15: Results in line with our expectations, buy Zensar Technologies Q1FY15: Results in line with our expectations, buy
Zensar Technologies Q1FY15: Results in line with our expectations, buy
 
4 q12 conference call presentation
4 q12 conference call presentation4 q12 conference call presentation
4 q12 conference call presentation
 
Majesco 1QFY18
Majesco 1QFY18Majesco 1QFY18
Majesco 1QFY18
 
Intellect 1QFY18
Intellect 1QFY18Intellect 1QFY18
Intellect 1QFY18
 
Financial Statement Analysis PowerPoint Presentation Slides
Financial Statement Analysis PowerPoint Presentation SlidesFinancial Statement Analysis PowerPoint Presentation Slides
Financial Statement Analysis PowerPoint Presentation Slides
 
Zydus Wellness reports a subdued quarter, hold - Nirmal Bang
Zydus Wellness reports a subdued quarter, hold - Nirmal BangZydus Wellness reports a subdued quarter, hold - Nirmal Bang
Zydus Wellness reports a subdued quarter, hold - Nirmal Bang
 
Hero honda ru2 qfy2011-291010
Hero honda ru2 qfy2011-291010Hero honda ru2 qfy2011-291010
Hero honda ru2 qfy2011-291010
 
Mercury athletic footwear
Mercury athletic footwearMercury athletic footwear
Mercury athletic footwear
 
GuessBox Financial Model 2017
GuessBox Financial Model 2017GuessBox Financial Model 2017
GuessBox Financial Model 2017
 
LIC Housing Finance Q1FY15 performance in line with estimates; buy
 LIC Housing Finance Q1FY15 performance in line with estimates; buy LIC Housing Finance Q1FY15 performance in line with estimates; buy
LIC Housing Finance Q1FY15 performance in line with estimates; buy
 
12 December Daily Market Report
12 December Daily Market Report12 December Daily Market Report
12 December Daily Market Report
 
Financial Statement Analysis Powerpoint Presentation Slides
Financial Statement Analysis Powerpoint Presentation SlidesFinancial Statement Analysis Powerpoint Presentation Slides
Financial Statement Analysis Powerpoint Presentation Slides
 

Similar to Hexaware Technologies Q1FY15: Margin troughed, sales uptick likely; accumulate - Prabhudas Lilladher

ACC Q1FY15: Earnings mildly below expectation; outlook remains strong
 ACC Q1FY15: Earnings mildly below expectation; outlook remains strong ACC Q1FY15: Earnings mildly below expectation; outlook remains strong
ACC Q1FY15: Earnings mildly below expectation; outlook remains strongIndiaNotes.com
 
Prabhudas lilladher techmahindra_29june_2015
Prabhudas lilladher techmahindra_29june_2015Prabhudas lilladher techmahindra_29june_2015
Prabhudas lilladher techmahindra_29june_2015IndiaNotes.com
 
Persistent Systems Q1FY15: Soft performance, margin headwinds limit near ter...
 Persistent Systems Q1FY15: Soft performance, margin headwinds limit near ter... Persistent Systems Q1FY15: Soft performance, margin headwinds limit near ter...
Persistent Systems Q1FY15: Soft performance, margin headwinds limit near ter...IndiaNotes.com
 
KSB Pumps Q1FY15: Strong PAT growth of 45% YoY; buy
 KSB Pumps Q1FY15: Strong PAT growth of 45% YoY; buy KSB Pumps Q1FY15: Strong PAT growth of 45% YoY; buy
KSB Pumps Q1FY15: Strong PAT growth of 45% YoY; buyIndiaNotes.com
 
Intrasoft 1QFY18
Intrasoft 1QFY18Intrasoft 1QFY18
Intrasoft 1QFY18Mohit Jn
 
Sun Pharma: Compelling valuation post stake sale of Daiichi; Buy
Sun Pharma: Compelling valuation post stake sale of Daiichi; BuySun Pharma: Compelling valuation post stake sale of Daiichi; Buy
Sun Pharma: Compelling valuation post stake sale of Daiichi; BuyIndiaNotes.com
 
HGSL 1QFY18
HGSL 1QFY18HGSL 1QFY18
HGSL 1QFY18Mohit Jn
 
Vaibhav Global Q1FY15: Outlook continues to remain positive; Hold
 Vaibhav Global Q1FY15: Outlook continues to remain positive; Hold Vaibhav Global Q1FY15: Outlook continues to remain positive; Hold
Vaibhav Global Q1FY15: Outlook continues to remain positive; HoldIndiaNotes.com
 
Stock Tip: Buy this stock for a target of Rs270
Stock Tip: Buy this stock for a target of Rs270Stock Tip: Buy this stock for a target of Rs270
Stock Tip: Buy this stock for a target of Rs270IndiaNotes.com
 
Q2FY15: Hold Mahindra & Mahindra Financial Services - Nirmal Bang
Q2FY15: Hold Mahindra & Mahindra Financial Services - Nirmal BangQ2FY15: Hold Mahindra & Mahindra Financial Services - Nirmal Bang
Q2FY15: Hold Mahindra & Mahindra Financial Services - Nirmal BangIndiaNotes.com
 
RMP initiation report (6 Apr 15)
RMP initiation report (6 Apr 15)RMP initiation report (6 Apr 15)
RMP initiation report (6 Apr 15)Nathan Judge
 
Punjab National Bank Q1FY15: Sane performance sanity in the quarter
 Punjab National Bank Q1FY15: Sane performance sanity in the quarter Punjab National Bank Q1FY15: Sane performance sanity in the quarter
Punjab National Bank Q1FY15: Sane performance sanity in the quarterIndiaNotes.com
 
Zee 1QFY18
Zee 1QFY18Zee 1QFY18
Zee 1QFY18Mohit Jn
 
Dish TV: TRAI licence recos EBITDA positive but cash negative; Buy
Dish TV: TRAI licence recos EBITDA positive but cash negative; BuyDish TV: TRAI licence recos EBITDA positive but cash negative; Buy
Dish TV: TRAI licence recos EBITDA positive but cash negative; BuyIndiaNotes.com
 
Dr. Reddy's 1FY15: Strong sales in key markets drive growth, margins
 Dr. Reddy's 1FY15: Strong sales in key markets drive growth, margins Dr. Reddy's 1FY15: Strong sales in key markets drive growth, margins
Dr. Reddy's 1FY15: Strong sales in key markets drive growth, marginsIndiaNotes.com
 
Cyient 1QFY18
Cyient 1QFY18Cyient 1QFY18
Cyient 1QFY18Mohit Jn
 
Persistent Systems: Acquired RGen Solutions, Strengthening OPD presence
Persistent Systems: Acquired RGen Solutions, Strengthening OPD presencePersistent Systems: Acquired RGen Solutions, Strengthening OPD presence
Persistent Systems: Acquired RGen Solutions, Strengthening OPD presenceIndiaNotes.com
 
Mastek 1QFY18
Mastek 1QFY18Mastek 1QFY18
Mastek 1QFY18Mohit Jn
 
Mahindra Financial result update: 4QFY15 PAT up 7% YoY and 144% QoQ
Mahindra Financial result update: 4QFY15 PAT up 7% YoY and 144% QoQMahindra Financial result update: 4QFY15 PAT up 7% YoY and 144% QoQ
Mahindra Financial result update: 4QFY15 PAT up 7% YoY and 144% QoQIndiaNotes.com
 
2 q13 investor presentation
2 q13 investor presentation2 q13 investor presentation
2 q13 investor presentationBancoABCRI
 

Similar to Hexaware Technologies Q1FY15: Margin troughed, sales uptick likely; accumulate - Prabhudas Lilladher (20)

ACC Q1FY15: Earnings mildly below expectation; outlook remains strong
 ACC Q1FY15: Earnings mildly below expectation; outlook remains strong ACC Q1FY15: Earnings mildly below expectation; outlook remains strong
ACC Q1FY15: Earnings mildly below expectation; outlook remains strong
 
Prabhudas lilladher techmahindra_29june_2015
Prabhudas lilladher techmahindra_29june_2015Prabhudas lilladher techmahindra_29june_2015
Prabhudas lilladher techmahindra_29june_2015
 
Persistent Systems Q1FY15: Soft performance, margin headwinds limit near ter...
 Persistent Systems Q1FY15: Soft performance, margin headwinds limit near ter... Persistent Systems Q1FY15: Soft performance, margin headwinds limit near ter...
Persistent Systems Q1FY15: Soft performance, margin headwinds limit near ter...
 
KSB Pumps Q1FY15: Strong PAT growth of 45% YoY; buy
 KSB Pumps Q1FY15: Strong PAT growth of 45% YoY; buy KSB Pumps Q1FY15: Strong PAT growth of 45% YoY; buy
KSB Pumps Q1FY15: Strong PAT growth of 45% YoY; buy
 
Intrasoft 1QFY18
Intrasoft 1QFY18Intrasoft 1QFY18
Intrasoft 1QFY18
 
Sun Pharma: Compelling valuation post stake sale of Daiichi; Buy
Sun Pharma: Compelling valuation post stake sale of Daiichi; BuySun Pharma: Compelling valuation post stake sale of Daiichi; Buy
Sun Pharma: Compelling valuation post stake sale of Daiichi; Buy
 
HGSL 1QFY18
HGSL 1QFY18HGSL 1QFY18
HGSL 1QFY18
 
Vaibhav Global Q1FY15: Outlook continues to remain positive; Hold
 Vaibhav Global Q1FY15: Outlook continues to remain positive; Hold Vaibhav Global Q1FY15: Outlook continues to remain positive; Hold
Vaibhav Global Q1FY15: Outlook continues to remain positive; Hold
 
Stock Tip: Buy this stock for a target of Rs270
Stock Tip: Buy this stock for a target of Rs270Stock Tip: Buy this stock for a target of Rs270
Stock Tip: Buy this stock for a target of Rs270
 
Q2FY15: Hold Mahindra & Mahindra Financial Services - Nirmal Bang
Q2FY15: Hold Mahindra & Mahindra Financial Services - Nirmal BangQ2FY15: Hold Mahindra & Mahindra Financial Services - Nirmal Bang
Q2FY15: Hold Mahindra & Mahindra Financial Services - Nirmal Bang
 
RMP initiation report (6 Apr 15)
RMP initiation report (6 Apr 15)RMP initiation report (6 Apr 15)
RMP initiation report (6 Apr 15)
 
Punjab National Bank Q1FY15: Sane performance sanity in the quarter
 Punjab National Bank Q1FY15: Sane performance sanity in the quarter Punjab National Bank Q1FY15: Sane performance sanity in the quarter
Punjab National Bank Q1FY15: Sane performance sanity in the quarter
 
Zee 1QFY18
Zee 1QFY18Zee 1QFY18
Zee 1QFY18
 
Dish TV: TRAI licence recos EBITDA positive but cash negative; Buy
Dish TV: TRAI licence recos EBITDA positive but cash negative; BuyDish TV: TRAI licence recos EBITDA positive but cash negative; Buy
Dish TV: TRAI licence recos EBITDA positive but cash negative; Buy
 
Dr. Reddy's 1FY15: Strong sales in key markets drive growth, margins
 Dr. Reddy's 1FY15: Strong sales in key markets drive growth, margins Dr. Reddy's 1FY15: Strong sales in key markets drive growth, margins
Dr. Reddy's 1FY15: Strong sales in key markets drive growth, margins
 
Cyient 1QFY18
Cyient 1QFY18Cyient 1QFY18
Cyient 1QFY18
 
Persistent Systems: Acquired RGen Solutions, Strengthening OPD presence
Persistent Systems: Acquired RGen Solutions, Strengthening OPD presencePersistent Systems: Acquired RGen Solutions, Strengthening OPD presence
Persistent Systems: Acquired RGen Solutions, Strengthening OPD presence
 
Mastek 1QFY18
Mastek 1QFY18Mastek 1QFY18
Mastek 1QFY18
 
Mahindra Financial result update: 4QFY15 PAT up 7% YoY and 144% QoQ
Mahindra Financial result update: 4QFY15 PAT up 7% YoY and 144% QoQMahindra Financial result update: 4QFY15 PAT up 7% YoY and 144% QoQ
Mahindra Financial result update: 4QFY15 PAT up 7% YoY and 144% QoQ
 
2 q13 investor presentation
2 q13 investor presentation2 q13 investor presentation
2 q13 investor presentation
 

More from IndiaNotes.com

Fce glaxo smithkline_12aug15
Fce glaxo smithkline_12aug15Fce glaxo smithkline_12aug15
Fce glaxo smithkline_12aug15IndiaNotes.com
 
GSK Consumer: Horlicks strengthens its position as No.1 brand across India
GSK Consumer: Horlicks strengthens its position as No.1 brand across IndiaGSK Consumer: Horlicks strengthens its position as No.1 brand across India
GSK Consumer: Horlicks strengthens its position as No.1 brand across IndiaIndiaNotes.com
 
Hester Biosciences gets manufacturing licence for 2 additional poultry vaccines
Hester Biosciences gets manufacturing licence for 2 additional poultry vaccinesHester Biosciences gets manufacturing licence for 2 additional poultry vaccines
Hester Biosciences gets manufacturing licence for 2 additional poultry vaccinesIndiaNotes.com
 
Vidhi Dyestuffs: To keep its growth story in the coming quarters also
Vidhi Dyestuffs: To keep its growth story in the coming quarters alsoVidhi Dyestuffs: To keep its growth story in the coming quarters also
Vidhi Dyestuffs: To keep its growth story in the coming quarters alsoIndiaNotes.com
 
Apollo Tyres approves further expansion of the Truck & Bus radial tyre capacity
Apollo Tyres approves further expansion of the Truck & Bus radial tyre capacityApollo Tyres approves further expansion of the Truck & Bus radial tyre capacity
Apollo Tyres approves further expansion of the Truck & Bus radial tyre capacityIndiaNotes.com
 
Grasim Industries reports improved performance in Q1FY16
Grasim Industries reports improved performance in Q1FY16Grasim Industries reports improved performance in Q1FY16
Grasim Industries reports improved performance in Q1FY16IndiaNotes.com
 
Cummins India: No interest burden being free from long-term or short-term debt
Cummins India: No interest burden being free from long-term or short-term debtCummins India: No interest burden being free from long-term or short-term debt
Cummins India: No interest burden being free from long-term or short-term debtIndiaNotes.com
 
Buy Makers Laboratories, company growing rapidly with strong thrust on brande...
Buy Makers Laboratories, company growing rapidly with strong thrust on brande...Buy Makers Laboratories, company growing rapidly with strong thrust on brande...
Buy Makers Laboratories, company growing rapidly with strong thrust on brande...IndiaNotes.com
 
Buy Multibase India, globalisation of the auto component sector to benefit th...
Buy Multibase India, globalisation of the auto component sector to benefit th...Buy Multibase India, globalisation of the auto component sector to benefit th...
Buy Multibase India, globalisation of the auto component sector to benefit th...IndiaNotes.com
 
Capital First: Long-term credit rating is rated highly at AA+ by CARE
Capital First: Long-term credit rating is rated highly at AA+ by CARECapital First: Long-term credit rating is rated highly at AA+ by CARE
Capital First: Long-term credit rating is rated highly at AA+ by CAREIndiaNotes.com
 
Orient Cement: Best placed to benefit from demand revival in AP & Telengana r...
Orient Cement: Best placed to benefit from demand revival in AP & Telengana r...Orient Cement: Best placed to benefit from demand revival in AP & Telengana r...
Orient Cement: Best placed to benefit from demand revival in AP & Telengana r...IndiaNotes.com
 
Canara Bank's operating performance to improve in remaining 9MFY16E
Canara Bank's operating performance to improve in remaining 9MFY16ECanara Bank's operating performance to improve in remaining 9MFY16E
Canara Bank's operating performance to improve in remaining 9MFY16EIndiaNotes.com
 
Buy Jenburkt Pharmaceuticals; government's amended FDI policy to cover medica...
Buy Jenburkt Pharmaceuticals; government's amended FDI policy to cover medica...Buy Jenburkt Pharmaceuticals; government's amended FDI policy to cover medica...
Buy Jenburkt Pharmaceuticals; government's amended FDI policy to cover medica...IndiaNotes.com
 
Hexaware Technologies adds 9 clients in Q2CY15, Buy
Hexaware Technologies adds 9 clients in Q2CY15, BuyHexaware Technologies adds 9 clients in Q2CY15, Buy
Hexaware Technologies adds 9 clients in Q2CY15, BuyIndiaNotes.com
 
Nirmal pi industries_03_aug15
Nirmal pi industries_03_aug15Nirmal pi industries_03_aug15
Nirmal pi industries_03_aug15IndiaNotes.com
 
Indoco Remedies: Weak domestic growth offsets export revenues in Q1FY16; Hold
Indoco Remedies: Weak domestic growth offsets export revenues in Q1FY16; HoldIndoco Remedies: Weak domestic growth offsets export revenues in Q1FY16; Hold
Indoco Remedies: Weak domestic growth offsets export revenues in Q1FY16; HoldIndiaNotes.com
 
PI Industries: Custom synthesis exports deliver growth of ~26% in Q1FY16; Buy
PI Industries: Custom synthesis exports deliver growth of ~26% in Q1FY16; BuyPI Industries: Custom synthesis exports deliver growth of ~26% in Q1FY16; Buy
PI Industries: Custom synthesis exports deliver growth of ~26% in Q1FY16; BuyIndiaNotes.com
 

More from IndiaNotes.com (20)

Fce glaxo smithkline_12aug15
Fce glaxo smithkline_12aug15Fce glaxo smithkline_12aug15
Fce glaxo smithkline_12aug15
 
GSK Consumer: Horlicks strengthens its position as No.1 brand across India
GSK Consumer: Horlicks strengthens its position as No.1 brand across IndiaGSK Consumer: Horlicks strengthens its position as No.1 brand across India
GSK Consumer: Horlicks strengthens its position as No.1 brand across India
 
GSK Consumer: Horlicks strengthens its position as No.1 brand across India
GSK Consumer: Horlicks strengthens its position as No.1 brand across IndiaGSK Consumer: Horlicks strengthens its position as No.1 brand across India
GSK Consumer: Horlicks strengthens its position as No.1 brand across India
 
Hester Biosciences gets manufacturing licence for 2 additional poultry vaccines
Hester Biosciences gets manufacturing licence for 2 additional poultry vaccinesHester Biosciences gets manufacturing licence for 2 additional poultry vaccines
Hester Biosciences gets manufacturing licence for 2 additional poultry vaccines
 
Vidhi Dyestuffs: To keep its growth story in the coming quarters also
Vidhi Dyestuffs: To keep its growth story in the coming quarters alsoVidhi Dyestuffs: To keep its growth story in the coming quarters also
Vidhi Dyestuffs: To keep its growth story in the coming quarters also
 
Apollo Tyres approves further expansion of the Truck & Bus radial tyre capacity
Apollo Tyres approves further expansion of the Truck & Bus radial tyre capacityApollo Tyres approves further expansion of the Truck & Bus radial tyre capacity
Apollo Tyres approves further expansion of the Truck & Bus radial tyre capacity
 
Grasim Industries reports improved performance in Q1FY16
Grasim Industries reports improved performance in Q1FY16Grasim Industries reports improved performance in Q1FY16
Grasim Industries reports improved performance in Q1FY16
 
Cummins India: No interest burden being free from long-term or short-term debt
Cummins India: No interest burden being free from long-term or short-term debtCummins India: No interest burden being free from long-term or short-term debt
Cummins India: No interest burden being free from long-term or short-term debt
 
Buy Makers Laboratories, company growing rapidly with strong thrust on brande...
Buy Makers Laboratories, company growing rapidly with strong thrust on brande...Buy Makers Laboratories, company growing rapidly with strong thrust on brande...
Buy Makers Laboratories, company growing rapidly with strong thrust on brande...
 
Buy Multibase India, globalisation of the auto component sector to benefit th...
Buy Multibase India, globalisation of the auto component sector to benefit th...Buy Multibase India, globalisation of the auto component sector to benefit th...
Buy Multibase India, globalisation of the auto component sector to benefit th...
 
Capital First: Long-term credit rating is rated highly at AA+ by CARE
Capital First: Long-term credit rating is rated highly at AA+ by CARECapital First: Long-term credit rating is rated highly at AA+ by CARE
Capital First: Long-term credit rating is rated highly at AA+ by CARE
 
Orient Cement: Best placed to benefit from demand revival in AP & Telengana r...
Orient Cement: Best placed to benefit from demand revival in AP & Telengana r...Orient Cement: Best placed to benefit from demand revival in AP & Telengana r...
Orient Cement: Best placed to benefit from demand revival in AP & Telengana r...
 
Canara Bank's operating performance to improve in remaining 9MFY16E
Canara Bank's operating performance to improve in remaining 9MFY16ECanara Bank's operating performance to improve in remaining 9MFY16E
Canara Bank's operating performance to improve in remaining 9MFY16E
 
Nirmal lupin 06_aug15
Nirmal lupin 06_aug15Nirmal lupin 06_aug15
Nirmal lupin 06_aug15
 
Buy Jenburkt Pharmaceuticals; government's amended FDI policy to cover medica...
Buy Jenburkt Pharmaceuticals; government's amended FDI policy to cover medica...Buy Jenburkt Pharmaceuticals; government's amended FDI policy to cover medica...
Buy Jenburkt Pharmaceuticals; government's amended FDI policy to cover medica...
 
Hexaware Technologies adds 9 clients in Q2CY15, Buy
Hexaware Technologies adds 9 clients in Q2CY15, BuyHexaware Technologies adds 9 clients in Q2CY15, Buy
Hexaware Technologies adds 9 clients in Q2CY15, Buy
 
Nirmal pi industries_03_aug15
Nirmal pi industries_03_aug15Nirmal pi industries_03_aug15
Nirmal pi industries_03_aug15
 
Indoco Remedies: Weak domestic growth offsets export revenues in Q1FY16; Hold
Indoco Remedies: Weak domestic growth offsets export revenues in Q1FY16; HoldIndoco Remedies: Weak domestic growth offsets export revenues in Q1FY16; Hold
Indoco Remedies: Weak domestic growth offsets export revenues in Q1FY16; Hold
 
Fce thermax 31_jul15
Fce thermax 31_jul15Fce thermax 31_jul15
Fce thermax 31_jul15
 
PI Industries: Custom synthesis exports deliver growth of ~26% in Q1FY16; Buy
PI Industries: Custom synthesis exports deliver growth of ~26% in Q1FY16; BuyPI Industries: Custom synthesis exports deliver growth of ~26% in Q1FY16; Buy
PI Industries: Custom synthesis exports deliver growth of ~26% in Q1FY16; Buy
 

Hexaware Technologies Q1FY15: Margin troughed, sales uptick likely; accumulate - Prabhudas Lilladher

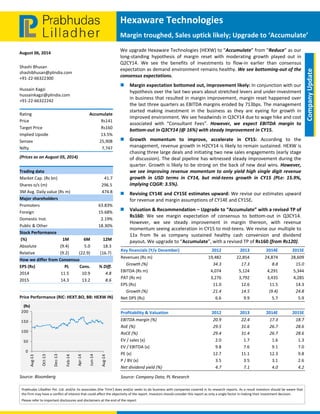
  • 1.     Hexaware Technologies  Margin troughed, Sales uptick likely; Upgrade to ‘Accumulate’ August 06, 2014  Prabhudas Lilladher Pvt. Ltd. and/or its associates (the 'Firm') does and/or seeks to do business with companies covered in its research reports. As a result investors should be aware that  the Firm may have a conflict of interest that could affect the objectivity of the report. Investors should consider this report as only a single factor in making their investment decision.  Please refer to important disclosures and disclaimers at the end of the report    Company Update  Shashi Bhusan  shashibhusan@plindia.com  +91‐22‐66322300  Hussain Kagzi  hussainkagzi@plindia.com  +91‐22‐66322242  Rating  Accumulate  Price  Rs141  Target Price  Rs160  Implied Upside   13.5%  Sensex   25,908  Nifty  7,747  (Prices as on August 05, 2014)  Trading data  Market Cap. (Rs bn)  41.7  Shares o/s (m)  296.5  3M Avg. Daily value (Rs m)  474.8  Major shareholders  Promoters   63.83%  Foreign   15.68%  Domestic Inst.  2.19%  Public & Other   18.30%  Stock Performance   (%)  1M  6M  12M  Absolute  (9.4)  5.0  18.3  Relative   (9.2)  (22.9)  (16.7)  How we differ from Consensus  EPS (Rs)  PL  Cons.  % Diff.  2014  11.5  10.9  4.8  2015  14.3  13.2  8.6    Price Performance (RIC: HEXT.BO, BB: HEXW IN)   Source: Bloomberg  0 50 100 150 200 Aug‐13 Oct‐13 Dec‐13 Feb‐14 Apr‐14 Jun‐14 Aug‐14 (Rs) We upgrade Hexaware Technologies (HEXW) to “Accumulate” from “Reduce” as our  long‐standing  hypothesis  of  margin  reset  with  moderating  growth  played  out  in  Q2CY14.  We  see  the  benefits  of  investments  to  flow‐in  earlier  than  consensus  expectation as demand environment remains healthy. We see bottoming‐out of the  consensus expectations.    Margin expectation bottomed out, improvement likely: In conjunction with our  hypothesis over the last two years about stretched levers and under‐investment  in business that resulted in margin improvement, margin reset happened over  the last three quarters as EBITDA margins eroded by 713bps. The management  started  making  investment  in  the  business  as  they  are  eyeing  for  growth  in  improved environment. We see headwinds in Q3CY14 due to wage hike and cost  associated  with  “Consultant  Fees”.  However,  we  expect  EBITDA  margin  to  bottom‐out in Q3CY14 (@ 16%) with steady improvement in CY15.   Growth  momentum  to  improve,  accelerate  in  CY15:  According  to  the  management, revenue growth in H2CY14 is likely to remain sustained. HEXW is  chasing three large deals and initiating two new sales engagements (early stage  of discussion). The deal pipeline has witnessed steady improvement during the  quarter. Growth is likely to be strong on the back of new deal wins. However,  we see improving revenue momentum to only yield high single digit revenue  growth  in  USD  terms  in  CY14,  but  mid‐teens  growth  in  CY15  (PLe:  15.9%,  implying CQGR: 3.5%).   Revising CY14E and CY15E estimates upward: We revise our estimates upward  for revenue and margin assumptions of CY14E and CY15E.   Valuation & Recommendation – Upgrade to “Accumulate” with a revised TP of  Rs160:  We  see  margin  expectation  of  consensus  to  bottom‐out  in  Q3CY14.  However,  we  see  steady  improvement  in  margin  thereon,  with  revenue  momentum seeing acceleration in CY15 to mid‐teens. We revise our multiple to  11x  from  9x  as  company  sustained  healthy  cash  conversion  and  dividend  payout. We upgrade to “Accumulate”, with a revised TP of Rs160 (from Rs120).        Key financials (Y/e December)    2012 2013  2014E 2015E Revenues (Rs m)  19,482 22,854  24,874 28,609      Growth (%)  34.3 17.3  8.8 15.0 EBITDA (Rs m)  4,074 5,124  4,291 5,344 PAT (Rs m)  3,276 3,792  3,435 4,285 EPS (Rs)  11.0 12.6  11.5 14.3      Growth (%)  21.4 14.5  (9.4) 24.8 Net DPS (Rs)  6.6 9.9  5.7 5.9   Profitability & Valuation    2012 2013  2014E 2015E EBITDA margin (%)  20.9 22.4  17.3 18.7 RoE (%)  29.5 31.6  26.7 28.6 RoCE (%)  29.4 31.4  26.7 28.6 EV / sales (x)  2.0 1.7  1.6 1.3 EV / EBITDA (x)  9.8 7.6  9.1 7.0 PE (x)  12.7 11.1  12.3 9.8 P / BV (x)  3.5 3.5  3.1 2.6 Net dividend yield (%)  4.7 7.1  4.0 4.2 Source: Company Data; PL Research 
  • 2.     August 06, 2014  2   Hexaware Technologies  Exhibit 1: Revising estimates for CY14E & CY15E downwards     New  Old  Revision  Consensus  Variance     CY14E  CY15E  CY14E CY15E CY14E CY15E CY14E  CY15E  CY14E CY15E Revenue ($ m)  416.3  485.2  416.3 467.1 0.0% 3.9%  417.72   475.80  ‐0.3% 2.0% Revenue (Rs m)   24,874   28,627   24,874   27,559  0.0% 3.9% 24959  28072  ‐0.3% 2.0% EBITDA Margin  17.3%  18.4%  17.0% 17.0% 23 bps 139 bps 18.0%  18.6%  ‐78 bps ‐22 bps EPS   11.42   14.05   11.27   12.54  1.3% 12.0%  10.93   13.15  4.5% 6.8% Target Price  160  120  33.3%  143  11.8%  Source: Bloomberg, PL Research  Exhibit 2: EBITDA reset is in‐line with our expectation – Factoring‐in improvement  14% 16% 18% 20% 22% 24% ‐5% ‐2% 1% 4% 7% Q1CY11 Q2CY11 Q3CY11 Q4CY11 Q1CY12 Q2CY12 Q3CY12 Q4CY12 Q1CY13 Q2CY13 Q3CY13 Q4CY13 Q1CY14 Q2CY14 Q3CY14E Q4CY14E CY15E* Revs (QoQ gr.) SG&A (% of revs) (RHS) EBITDA Margin (RHS)   Source: Company Data, PL Research, * Revenue growth is taken at CQGR (PLe)  Exhibit 3: Onsite ramp‐up: To accelerate offshore growth  ‐6% ‐2% 2% 6% 10% 14% Q1CY11 Q2CY11 Q3CY11 Q4CY11 Q1CY12 Q2CY12 Q3CY12 Q4CY12 Q1CY13 Q2CY13 Q3CY13 Q4CY13 Q1CY14 Q2CY14 Onsite Revs gr. Offshore Revs gr.   Source: Company Data, PL Research 
  • 3.     August 06, 2014  3   Hexaware Technologies  Exhibit 4: Sustaining cash flow at healthy level despite volatile earnings  ‐48.0% ‐23.0% 2.0% 27.0% 52.0% 77.0% 102.0% 127.0% ‐56% ‐16% 24% 64% 104% 144% 184% Q1FY11 Q2FY11 Q3FY11 Q4FY11 Q1FY12 Q2FY12 Q3FY12 Q4FY12 Q1FY13 Q2FY13 Q3FY13 Q4FY13 Q1FY14 Q2FY14 CFO/PAT FCF/EBITDA (RHS)   Source: Company Data, PL Research  Exhibit 5: Dividend payout ahead of industry average  0.0% 10.0% 20.0% 30.0% 40.0% 50.0% 60.0% CY08 CY09 CY10 CY11 CY12 CY13 Dividend Payout Ratio   Source: Company Data, PL Research  Exhibit 6: PER Chart  6.5x 0.0 2.0 4.0 6.0 8.0 10.0 12.0 14.0 Aug‐08 Dec‐08 May‐09 Sep‐09 Jan‐10 Jun‐10 Nov‐10 Mar‐11 Aug‐11 Dec‐11 May‐12 Sep‐12 Jan‐13 Jun‐13 Nov‐13 Mar‐14 Aug‐14 1‐Yr Forward PER Average PER   Source: Company Data, Bloomberg, PL Research     
  • 4.     August 06, 2014  4   Hexaware Technologies  Income Statement (Rs m)            Y/e December   2012  2013  2014E 2015E Net Revenue  19,482  22,854  24,874 28,609 Software Dev. Exp.  11,846  13,826  15,818 17,964 Gross Profit  7,636  9,028  9,056 10,646 Employee Cost  —  —  — — Other Expenses  3,562  3,904  4,764 5,302 EBITDA  4,074  5,124  4,291 5,344 Depr. & Amortization  324  386  443 497 Net Interest  —  —  — — Other Income  290  58  555 647 Profit before Tax  4,040  4,796  4,403 5,493 Total Tax  764  1,004  969 1,209 Profit after Tax  3,276  3,792  3,435 4,285 Ex‐Od items / Min. Int.  —  —  — — Adj. PAT  3,276  3,792  3,435 4,285 Avg. Shares O/S (m)  296.5  299.9  299.9 299.9 EPS (Rs.)  11.0  12.6  11.5 14.3   Cash Flow Abstract (Rs m)     Y/e December     2012  2013  2014E 2015E C/F from Operations  2,199  3,358  2,653 4,343 C/F from Investing  (2,484)  (1,162)  (871) (1,001) C/F from Financing  (1,897)  (1,255)  (1,577) (1,770) Inc. / Dec. in Cash  (2,182)  941  205 1,572 Opening Cash  4,132  1,951  2,892 3,097 Closing Cash  1,951  2,892  3,097 4,669 FCFF  1,915  5,780  1,783 3,342 FCFE  1,993  5,711  1,783 3,342       Key Financial Metrics  Y/e December             2012  2013  2014E 2015E Growth      Revenue (%)  34.3  17.3  8.8 15.0 EBITDA (%)  53.9  25.8  (16.2) 24.5 PAT (%)  22.7  15.7  (9.4) 24.8 EPS (%)  21.4  14.5  (9.4) 24.8 Profitability      EBITDA Margin (%)  20.9  22.4  17.3 18.7 PAT Margin (%)  16.8  16.6  13.8 15.0 RoCE (%)  29.4  31.4  26.7 28.6 RoE (%)  29.5  31.6  26.7 28.6 Balance Sheet      Net Debt : Equity  (0.2)  (0.3)  (0.2) (0.3) Net Wrkng Cap. (days)  —  —  — — Valuation      PER (x)  12.7  11.1  12.3 9.8 P / B (x)  3.5  3.5  3.1 2.6 EV / EBITDA (x)  9.8  7.6  9.1 7.0 EV / Sales (x)  2.0  1.7  1.6 1.3 Earnings Quality      Eff. Tax Rate  18.9  20.9  22.0 22.0 Other Inc / PBT  7.2  1.2  12.6 11.8 Eff. Depr. Rate (%)  5.0  5.3  5.4 5.4 FCFE / PAT  60.8  150.6  51.9 78.0 Source: Company Data, PL Research.        Balance Sheet Abstract (Rs m)    Y/e December      2012  2013  2014E 2015E Shareholder's Funds  12,038  11,992  13,731 16,246 Total Debt  78  9  9 9 Other Liabilities  396  480  480 480 Total Liabilities  12,512  12,482  14,220 16,735 Net Fixed Assets  5,199  5,371  5,798 6,302 Goodwill  —  —  — — Investments  2,354  3,383  3,383 3,383 Net Current Assets  3,496  2,034  3,345 5,356      Cash & Equivalents  1,969  3,011  3,097 4,669      Other Current Assets  4,799  4,853  5,969 7,267      Current Liabilities  3,272  5,830  5,721 6,580 Other Assets  1,462  1,695  1,695 1,695 Total Assets  12,512  12,482  14,220 16,735         Quarterly Financials (Rs m)      Y/e December      Q3CY13  Q4CY13  Q1CY14 Q2CY14 Net Revenue  6,211  6,200  5,889 6,104 EBITDA  1,478  1,394  1,133 1,017 % of revenue  23.8  22.5  19.2 16.7 Depr. & Amortization  98  101  108 108 Net Interest  —  —  — — Other Income  (120)  (2)  (50) 173 Profit before Tax  1,260  1,291  975 1,082 Total Tax  272  259  272 227 Profit after Tax  988  1,032  703 855 Adj. PAT  988  1,032  703 855   Key Operating Metrics  Y/e December       2012  2013 2014E 2015E Total Technical Billed (Headcount) 8,371  — — — Onsite Realization ($/hr)  73.8  72.9 72.1 75.0 Offshore Realization ($/hr)  23.0  23.0 22.7 23.6 Software Dev. Exp. (% of Sales)  60.8  60.5 63.6 62.8 Sales & Mktg. (% of Sales)  18.3  17.1 19.2 18.5 Currency (Re/$)  53  59 60 59 Revenue (US$ m)  364  389 416 485 Source: Company Data, PL Research.   
  • 5.     August 06, 2014  5   Hexaware Technologies            Prabhudas Lilladher Pvt. Ltd.  3rd Floor, Sadhana House, 570, P. B. Marg, Worli, Mumbai‐400 018, India  Tel: (91 22) 6632 2222 Fax: (91 22) 6632 2209  Rating Distribution of Research Coverage    31.8% 49.1% 19.1% 0.0% 0% 10% 20% 30% 40% 50% 60% BUY Accumulate Reduce Sell % of Total Coverage   PL’s Recommendation Nomenclature      BUY   :  Over 15% Outperformance to Sensex over 12‐months  Accumulate  :  Outperformance to Sensex over 12‐months  Reduce  :  Underperformance to Sensex over 12‐months  Sell  :  Over 15% underperformance to Sensex over 12‐months  Trading Buy  :  Over 10% absolute upside in 1‐month  Trading Sell  :  Over 10% absolute decline in 1‐month  Not Rated (NR)  :  No specific call on the stock  Under Review (UR)  :  Rating likely to change shortly  This  document  has  been  prepared  by  the  Research  Division  of  Prabhudas  Lilladher  Pvt.  Ltd.  Mumbai,  India  (PL)  and  is  meant  for  use  by  the  recipient  only  as  information and is not for circulation.  This document is not to be reported or copied or made available to others without prior permission of PL. It should not be  considered or taken as an offer to sell or a solicitation to buy or sell any security.  The information contained in this report has been obtained from sources that are considered to be reliable. However, PL has not independently verified the accuracy  or completeness of the same. Neither PL nor any of its affiliates, its directors or its employees accept any responsibility of whatsoever nature for the information,  statements and opinion given, made available or expressed herein or for any omission therein.  Recipients of this report should be aware that past performance is not necessarily a guide to future performance and value of investments can go down as well. The  suitability  or  otherwise  of  any  investments  will  depend  upon  the  recipient's  particular  circumstances  and,  in  case  of  doubt,  advice  should  be  sought  from  an  independent expert/advisor.  Either PL or its affiliates or its directors or its employees or its representatives or its clients or their relatives may have position(s), make market, act as principal or  engage in transactions of securities of companies referred to in this report and they may have used the research material prior to publication.  We may from time to time solicit or perform investment banking or other services for any company mentioned in this document.