VIP Call Girls Service Dilsukhnagar Hyderabad Call +91-8250192130
Indian Bank
1. 1QFY2011 Result Update | Banking
July 27, 2010
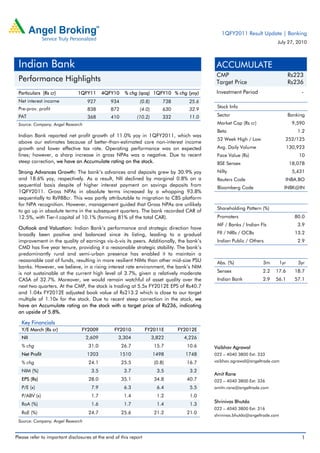
Indian Bank ACCUMULATE
CMP Rs223
Performance Highlights Target Price Rs236
Particulars (Rs cr) 1QFY11 4QFY10 % chg (qoq) 1QFY10 % chg (yoy) Investment Period -
Net interest income 927 934 (0.8) 738 25.6
Pre-prov. profit Stock Info
838 872 (4.0) 630 32.9
PAT 368 410 (10.2) 332 11.0 Sector Banking
Source: Company, Angel Research Market Cap (Rs cr) 9,590
Beta 1.2
Indian Bank reported net profit growth of 11.0% yoy in 1QFY2011, which was
52 Week High / Low 252/125
above our estimates because of better-than-estimated core non-interest income
growth and lower effective tax rate. Operating performance was on expected Avg. Daily Volume 130,923
lines; however, a sharp increase in gross NPAs was a negative. Due to recent Face Value (Rs) 10
steep correction, we have an Accumulate rating on the stock. BSE Sensex 18,078
Strong Advances Growth: The bank’s advances and deposits grew by 30.9% yoy Nifty 5,431
and 18.6% yoy, respectively. As a result, NII declined by marginal 0.8% on a Reuters Code INBA.BO
sequential basis despite of higher interest payment on savings deposits from Bloomberg Code INBK@IN
1QFY2011. Gross NPAs in absolute terms increased by a whopping 93.8%
sequentially to Rs988cr. This was partly attributable to migration to CBS platform
for NPA recognition. However, management guided that Gross NPAs are unlikely
Shareholding Pattern (%)
to go up in absolute terms in the subsequent quarters. The bank recorded CAR of
12.5%, with Tier-I capital of 10.1% (forming 81% of the total CAR). Promoters 80.0
MF / Banks / Indian Fls 3.9
Outlook and Valuation: Indian Bank’s performance and strategic direction have
broadly been positive and balanced since its listing, leading to a gradual FII / NRIs / OCBs 13.2
improvement in the quality of earnings vis-à-vis its peers. Additionally, the bank’s Indian Public / Others 2.9
CMD has five year tenure, providing it a reasonable strategic stability. The bank’s
predominantly rural and semi-urban presence has enabled it to maintain a
reasonable cost of funds, resulting in more resilient NIMs than other mid-size PSU Abs. (%) 3m 1yr 3yr
banks. However, we believe, in a rising interest rate environment, the bank’s NIM
is not sustainable at the current high level of 3.7%, given a relatively moderate Sensex 2.2 17.6 18.7
CASA of 32.7%. Moreover, we would remain watchful of asset quality over the Indian Bank 2.9 56.1 57.1
next two quarters. At the CMP, the stock is trading at 5.5x FY2012E EPS of Rs40.7
and 1.04x FY2012E adjusted book value of Rs213.2 which is close to our target
multiple of 1.10x for the stock. Due to recent steep correction in the stock, we
have an Accumulate rating on the stock with a target price of Rs236, indicating
an upside of 5.8%.
Key Financials
Y/E March (Rs cr) FY2009 FY2010 FY2011E FY2012E
NII 2,609 3,304 3,822 4,226
% chg 31.0 26.7 15.7 10.6 Vaibhav Agrawal
Net Profit 1203 1510 1498 1748 022 – 4040 3800 Ext: 333
% chg 24.1 25.5 (0.8) 16.7 vaibhav.agrawal@angeltrade.com
NIM (%) 3.5 3.7 3.5 3.2
Amit Rane
EPS (Rs) 28.0 35.1 34.8 40.7 022 – 4040 3800 Ext: 326
P/E (x) 7.9 6.3 6.4 5.5 amitn.rane@angeltrade.com
P/ABV (x) 1.7 1.4 1.2 1.0
Shrinivas Bhutda
RoA (%) 1.6 1.7 1.4 1.3
022 – 4040 3800 Ext: 316
RoE (%) 24.7 25.6 21.2 21.0
shrinivas.bhutda@angeltrade.com
Source: Company, Angel Research
Please refer to important disclosures at the end of this report 1
2. Indian Bank | 1QFY2011 Result Update
Exhibit 1: 1QFY2011 performance
% chg % chg
Particulars (Rs cr) 1QFY2011 4QFY2010 1QFY2010
(qoq) (yoy)
Interest earned 2,122 2,025 4.8 1,880 12.8
Interest expenses 1,195 1,091 9.6 1,143 4.6
NII 927 934 (0.8) 738 25.6
Non-interest income 355 293 21.4 350 1.5
Total income 1,282 1,227 4.5 1,088 17.9
Operating expenses 444 355 25.3 457 (2.9)
Pre-prov. profit 838 872 (4.0) 630 32.9
Provisions & cont. 344 214 61.0 121 184.5
PBT 494 659 (25.0) 510 (3.1)
Prov. for taxes 126 249 (49.5) 178 (29.3)
PAT 368 410 (10.2) 332 11.0
EPS (Rs) 4.4 4.9 (10.2) 4.0 11.0
Cost-to-income ratio (%) 34.7 28.9 42.0
Effective tax rate (%) 25.5 37.8 34.9
Net NPA (%) 0.8 0.2 0.4
Source: Company, Angel Research
Exhibit 2: 1QFY2011 actual v/s Angel estimates
Particulars (Rs cr) Actual Estimates Var. (%)
NII 927 886 4.6
Non-interest income 355 279 27.3
Total income 1,282 1,165 10.1
Operating expenses 444 438 1.5
Pre-prov. profit 838 727 15.2
Provisions & cont. 344 211 63.2
PBT 494 516 (4.4)
Prov. for taxes 126 175 (28.1)
PAT 368 342 7.8
Source: Company, Angel Research
Strong Advances Growth
The bank’s advances and deposits grew by 30.9% yoy and 18.6% yoy,
respectively. The bank’s CD ratio improved marginally on a sequential basis to
74.8% in 1QFY2011 from 73.5% in 4QFY2010. As a result, NII declined by
marginal 0.8% on a sequential basis despite of higher interest payment on savings
deposits from 1QFY2011. Growth in advances was driven by SME loans (54.1%
yoy) and corporate loans (34.3%), which constituted 12.7% and 51.4% of the total
loan book, respectively, at the end of 1QFY2011.
July 27, 2010 2
3. Indian Bank | 1QFY2011 Result Update
Exhibit 3: Trend in advances and deposits
Advances (LHS) Deposits (LHS) Credit-Deposit ratio (RHS)
(Rs cr) (%)
100,000 90.0
80,000
80.0
60,000
70.0
40,000
60.0
20,000
- 50.0
1QFY08
2QFY08
3QFY08
4QFY08
1QFY09
2QFY09
3QFY09
4QFY09
1QFY10
2QFY10
3QFY10
4QFY10
1QFY11
Source: Company, Angel Research
Exhibit 4: 1QFY2011 - Break-up of advances
Retail and Agriculture
Others 15%
21%
SME
13%
Corporate
51%
Source: Company, Angel Research
Exhibit 5: Trend in CASA deposits
(%) CASA ratio
36.0 35.2 35.3
33.8
34.0 33.1 32.9 32.7
32.7 32.4
32.0 31.1 31.2 31.0 31.1
29.8
30.0
28.0
26.0
1QFY08
2QFY08
3QFY08
4QFY08
1QFY09
2QFY09
3QFY09
4QFY09
1QFY10
2QFY10
3QFY10
4QFY10
1QFY11
Source: Company, Angel Research
July 27, 2010 3
4. Indian Bank | 1QFY2011 Result Update
Exhibit 6: Trend in quarterly reported NIM
(%) Reported NIM
4.2
4.0
4.0 3.9 3.9
3.8
3.8 3.7
3.6
3.6 3.5
3.3
3.4
3.2
3.2
3.0
1QFY09
2QFY09
3QFY09
4QFY09
1QFY10
2QFY10
3QFY10
4QFY10
1QFY11
Source: Company, Angel Research
Strong core non-interest income growth
The core non-interest income grew by 54.4% yoy to Rs258cr in 1QFY2011. Due to
an absence of treasury gains, the overall non-interest income growth on a yoy
basis remained flat (up 1.5% yoy); however, it was up by 21.4% on a sequential
basis. Going forward, we expect growth in core non-interest income to be largely
in line with growth in advances.
Restructured accounts performing well, though high slippages
During the quarter, the bank’s gross and net NPA ratios increased substantially
and stood at 1.5% (0.8% in 4QFY2010) and 0.8% (0.2% in 4QFY2010),
respectively. Gross NPAs in absolute terms also increased substantially by 93.8%
qoq to Rs988cr, while net NPAs increased by a whopping 252.9% sequentially to
Rs511cr in 1QFY2011. As a result, the provision coverage ratio, including
technical write-offs, declined to 83% from 94% in 4QFY2010.
As per the RBI’s guidelines, all banks are expected to migrate to CBS-based
reporting of NPAs by March 31, 2011. The bank has already migrated to
identifying NPA through online CBS system, which enables it to track each non-
performing and special mention account on a day-to-day basis. The spike in Gross
NPAs was partly attributable to migration to CBS platform for NPA recognition.
However, management guided that Gross NPAs are unlikely to go up in absolute
terms in the subsequent quarters.
July 27, 2010 4
5. Indian Bank | 1QFY2011 Result Update
Exhibit 7: Trend in asset quality
(%) Gross NPA (LHS) Net NPA (LHS) NPA Coverage (RHS) (%)
1.60 90
1.40
75
1.20
60
1.00
0.80 45
0.60
30
0.40
15
0.20
- -
3QFY08
4QFY08
1QFY09
2QFY09
3QFY09
4QFY09
1QFY10
2QFY10
3QFY10
4QFY10
1QFY11
Source: Company, Angel Research
Operating costs rise
During the quarter, total operating costs increased by 25.3% qoq but declined by
2.9% yoy to Rs444cr. Due to a strong operating income growth (17.9% yoy)
coupled with the marginal decline in operating costs, the bank’s cost-to-income
ratio improved to 34.7% (42% in 1QFY2010). During the quarter, the bank
provided Rs8.2cr on account of additional gratuity liability pursuant to amendment
in the gratuity act.
The bank opened six branches and five ATMs during 1QFY2011, taking the total
branch network to 1,762 and ATM network to 1,010. Additionally, the bank is
planning to open 190 branches in FY2011E, which should take the bank’s total
branch network to 1,950.
Exhibit 8: Trend in cost-to-income ratio
(%) Cost-to-income ratio
60.0
50.4 51.4
50.0 46.3
44.2 44.4
42.0 40.8
40.4
40.0 36.7 38.1
33.8 34.7
28.9
30.0
20.0
1QFY08
2QFY08
3QFY08
4QFY08
1QFY09
2QFY09
3QFY09
4QFY09
1QFY10
2QFY10
3QFY10
4QFY10
1QFY11
Source: Company, Angel Research
July 27, 2010 5
6. Indian Bank | 1QFY2011 Result Update
Exhibit 9: Branch and ATM network
(Nos) Branches (LHS) ATMs (RHS) (Nos )
1,800 1,100
1,760
950
1,720
1,680 800
1,640
650
1,600
1,560 500
4QFY09
1QFY10
2QFY10
3QFY10
4QFY10
1QFY11
Source: Company, Angel Research
Healthy capital adequacy
The bank recorded a strong CAR of 12.5%, with Tier-I capital of 10.1% (forming a
healthy 81% of the total CAR). Going forward, the bank has adequate headroom
to raise additional Tier-II capital to grow above the industry’s growth rate.
Exhibit 10: Comfortable capital adequacy
(%) Tier-I CAR Tier-II CAR
16.0
14.0
12.0
10.0
8.0
6.0
4.0
2.0
-
1QFY10
2QFY10
3QFY10
4QFY10
1QFY11
Source: Company, Angel Research
July 27, 2010 6
7. Indian Bank | 1QFY2011 Result Update
Investment Arguments
Relatively high yield on advances, with resilient asset quality
A large part of the bank’s credit book comprises SME and mid-size corporates,
contributing to relatively high yield on advances but, at the same time, maintaining
superior asset quality with a net NPA ratio of less than 1%.
Technologically efficient branch franchise, moderate CASA
Indian Bank plans to open 190 branches during FY2011, indicating growth of
10% yoy, to take its total branch network to 1,950 with 100% CBS. The bank has a
moderate CASA of 33%, which grew at a CAGR of 19.4% during FY2007–10.
Outlook and Valuation
Indian Bank’s performance and strategic direction have broadly been positive and
balanced since its listing, leading to a gradual improvement in the quality of
earnings vis-à-vis its peers. Additionally, the bank’s CMD has five year tenure,
providing it a reasonable strategic stability. The bank’s predominantly rural and
semi-urban presence has enabled it to maintain a reasonable cost of funds,
resulting in more resilient NIMs than other mid-size PSU banks. However, we
believe, in a rising interest rate environment, the bank’s NIM is not sustainable at
the current high level of 3.7%, given a relatively moderate CASA of 32.7%.
Moreover, we would remain watchful of asset quality over the next two quarters. At
the CMP, the stock is trading at 5.5x FY2012E EPS of Rs40.7 and 1.04x FY2012E
adjusted book value of Rs213.2 which is close to our target multiple of 1.10x for
the stock. Due to recent steep correction in the stock, we have an Accumulate
rating on the stock with a target price of Rs236, indicating an upside of 5.8%.
July 27, 2010 7
8. Indian Bank | 1QFY2011 Result Update
Exhibit 11: Key assumptions
Earlier estimates Revised estimates
Particulars (%)
FY2011E FY2012E FY2011E FY2012E
Credit growth 20.0 18.0 22.0 18.0
Deposit growth 20.0 17.0 22.0 17.0
CASA ratio 30.9 30.0 30.4 29.5
NIM 3.4 3.3 3.5 3.2
Other income growth 1.3 11.3 3.2 11.4
Growth in staff expenses 10.0 15.0 10.0 15.0
Growth in other expenses 10.0 15.0 10.0 15.0
Slippages 0.9 0.8 1.2 1.2
Coverage ratio 79.5 79.4 77.1 76.9
Treasury gain/(loss) (% of investments) 0.2 0.2 0.2 0.2
Source: Company, Angel Research
Exhibit 12: Change in estimates
FY2011E FY2012E
Particulars
(Rs cr) Earlier Revised Earlier Revised
% chg % chg
estimates estimates estimates estimates
NII 3,718 3,822 2.8 4,213 4,226 0.3
Non-interest income 1,188 1,211 1.9 1,323 1,349 2.0
Total income 4,907 5,033 2.6 5,536 5,575 0.7
Operating expenses 1,903 1,903 - 2,188 2,188 -
Pre-prov. profit 3,004 3,130 4.2 3,347 3,387 1.2
Provisions & cont. 602 810 34.5 624 689 10.3
PBT 2,402 2,320 (3.4) 2,723 2,698 (0.9)
Prov. for taxes 814 786 (3.4) 923 914 (0.9)
PAT 1,588 1,534 (3.4) 1,801 1,784 (0.9)
Source: Company, Angel Research
Exhibit 13: P/ABV band
(Rs) Price 0.5x 0.8x 1.1x 1.4x 1.7x
400
350
300
250
200
150
100
50
0
Dec-07
Dec-08
Dec-09
Dec-10
Mar-07
Mar-08
Mar-09
Mar-10
Mar-11
Sep-07
Sep-08
Sep-09
Sep-10
Jun-07
Jun-08
Jun-09
Jun-10
Source: Company, Angel Research, Bloomberg
July 27, 2010 8
12. Indian Bank | 1QFY2011 Result Update
Research Team Tel: 022 - 4040 3800 E-mail: research@angeltrade.com Website: www.angeltrade.com
DISCLAIMER
This document is solely for the personal information of the recipient, and must not be singularly used as the basis of any investment
decision. Nothing in this document should be construed as investment or financial advice. Each recipient of this document should make
such investigations as they deem necessary to arrive at an independent evaluation of an investment in the securities of the companies
referred to in this document (including the merits and risks involved), and should consult their own advisors to determine the merits and
risks of such an investment.
Angel Broking Limited, its affiliates, directors, its proprietary trading and investment businesses may, from time to time, make
investment decisions that are inconsistent with or contradictory to the recommendations expressed herein. The views contained in this
document are those of the analyst, and the company may or may not subscribe to all the views expressed within.
Reports based on technical and derivative analysis center on studying charts of a stock's price movement, outstanding positions and
trading volume, as opposed to focusing on a company's fundamentals and, as such, may not match with a report on a company's
fundamentals.
The information in this document has been printed on the basis of publicly available information, internal data and other reliable
sources believed to be true, but we do not represent that it is accurate or complete and it should not be relied on as such, as this
document is for general guidance only. Angel Broking Limited or any of its affiliates/ group companies shall not be in any way
responsible for any loss or damage that may arise to any person from any inadvertent error in the information contained in this report.
Angel Broking Limited has not independently verified all the information contained within this document. Accordingly, we cannot testify,
nor make any representation or warranty, express or implied, to the accuracy, contents or data contained within this document. While
Angel Broking Limited endeavours to update on a reasonable basis the information discussed in this material, there may be regulatory,
compliance, or other reasons that prevent us from doing so.
This document is being supplied to you solely for your information, and its contents, information or data may not be reproduced,
redistributed or passed on, directly or indirectly.
Angel Broking Limited and its affiliates may seek to provide or have engaged in providing corporate finance, investment banking or
other advisory services in a merger or specific transaction to the companies referred to in this report, as on the date of this report or in
the past.
Neither Angel Broking Limited, nor its directors, employees or affiliates shall be liable for any loss or damage that may arise from or in
connection with the use of this information.
Note: Please refer to the important `Stock Holding Disclosure' report on the Angel website (Research Section). Also, please
refer to the latest update on respective stocks for the disclosure status in respect of those stocks. Angel Broking Limited and
its affiliates may have investment positions in the stocks recommended in this report.
Disclosure of Interest Statement Indian Bank
1. Analyst ownership of the stock No
2. Angel and its Group companies ownership of the stock No
3. Angel and its Group companies' Directors ownership of the stock No
4. Broking relationship with company covered No
Note: We have not considered any Exposure below Rs 1 lakh for Angel, its Group companies and Directors.
Ratings (Returns): Buy (> 15%) Accumulate (5% to 15%) Neutral (-5 to 5%)
Reduce (-5% to 15%) Sell (< -15%)
July 27, 2010 12