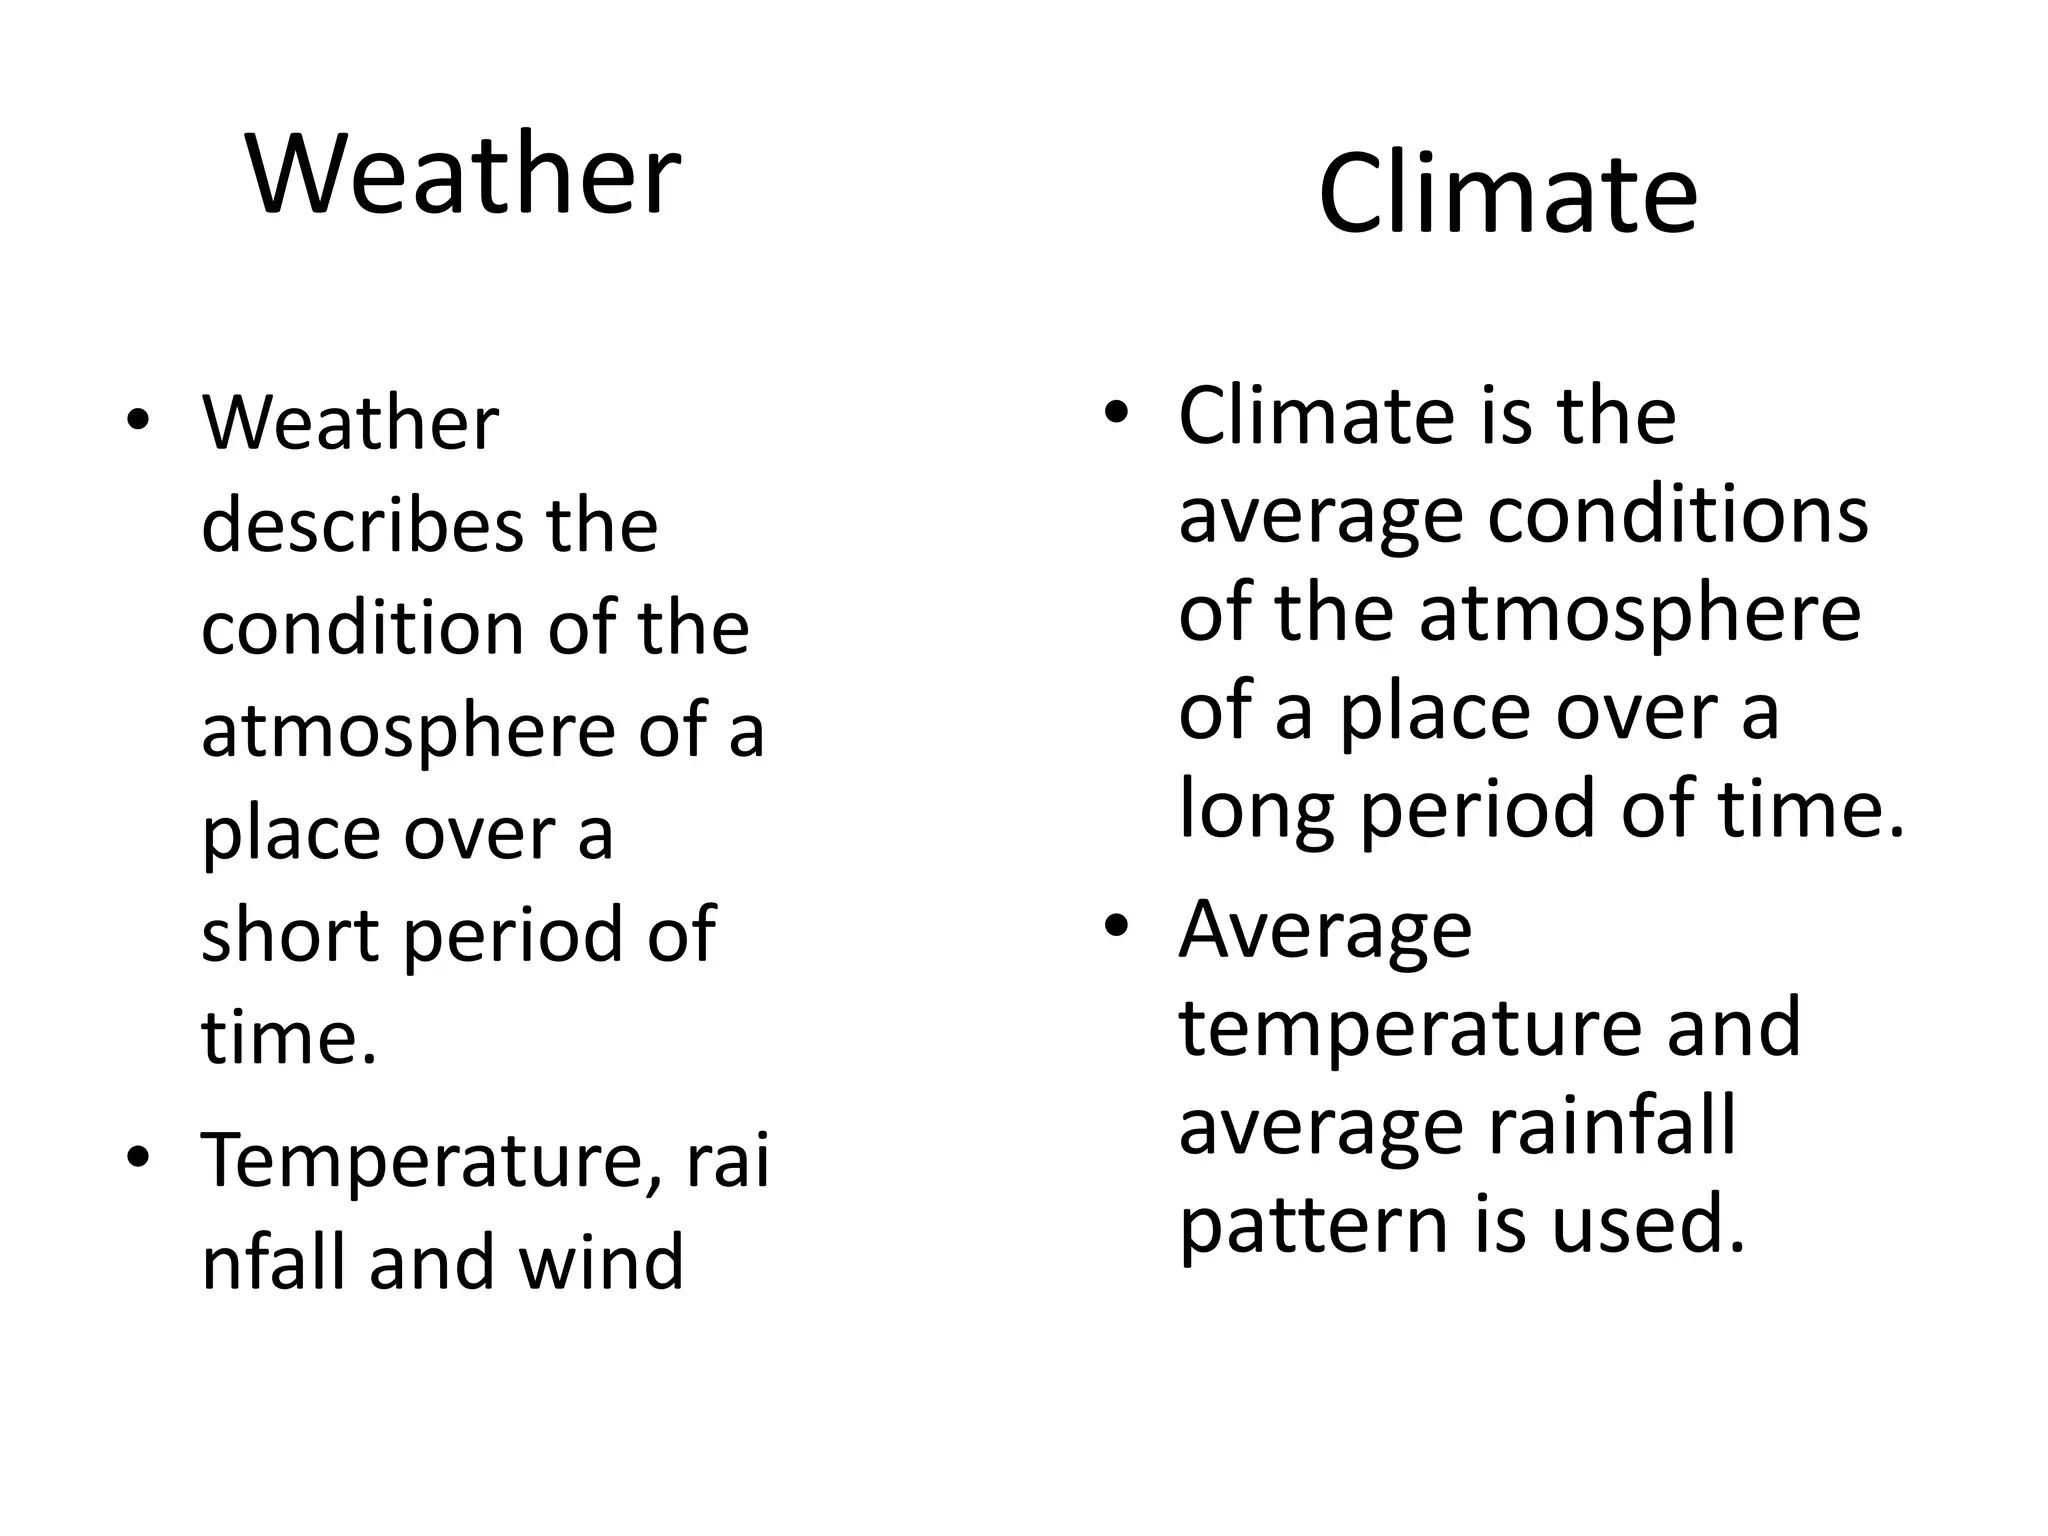
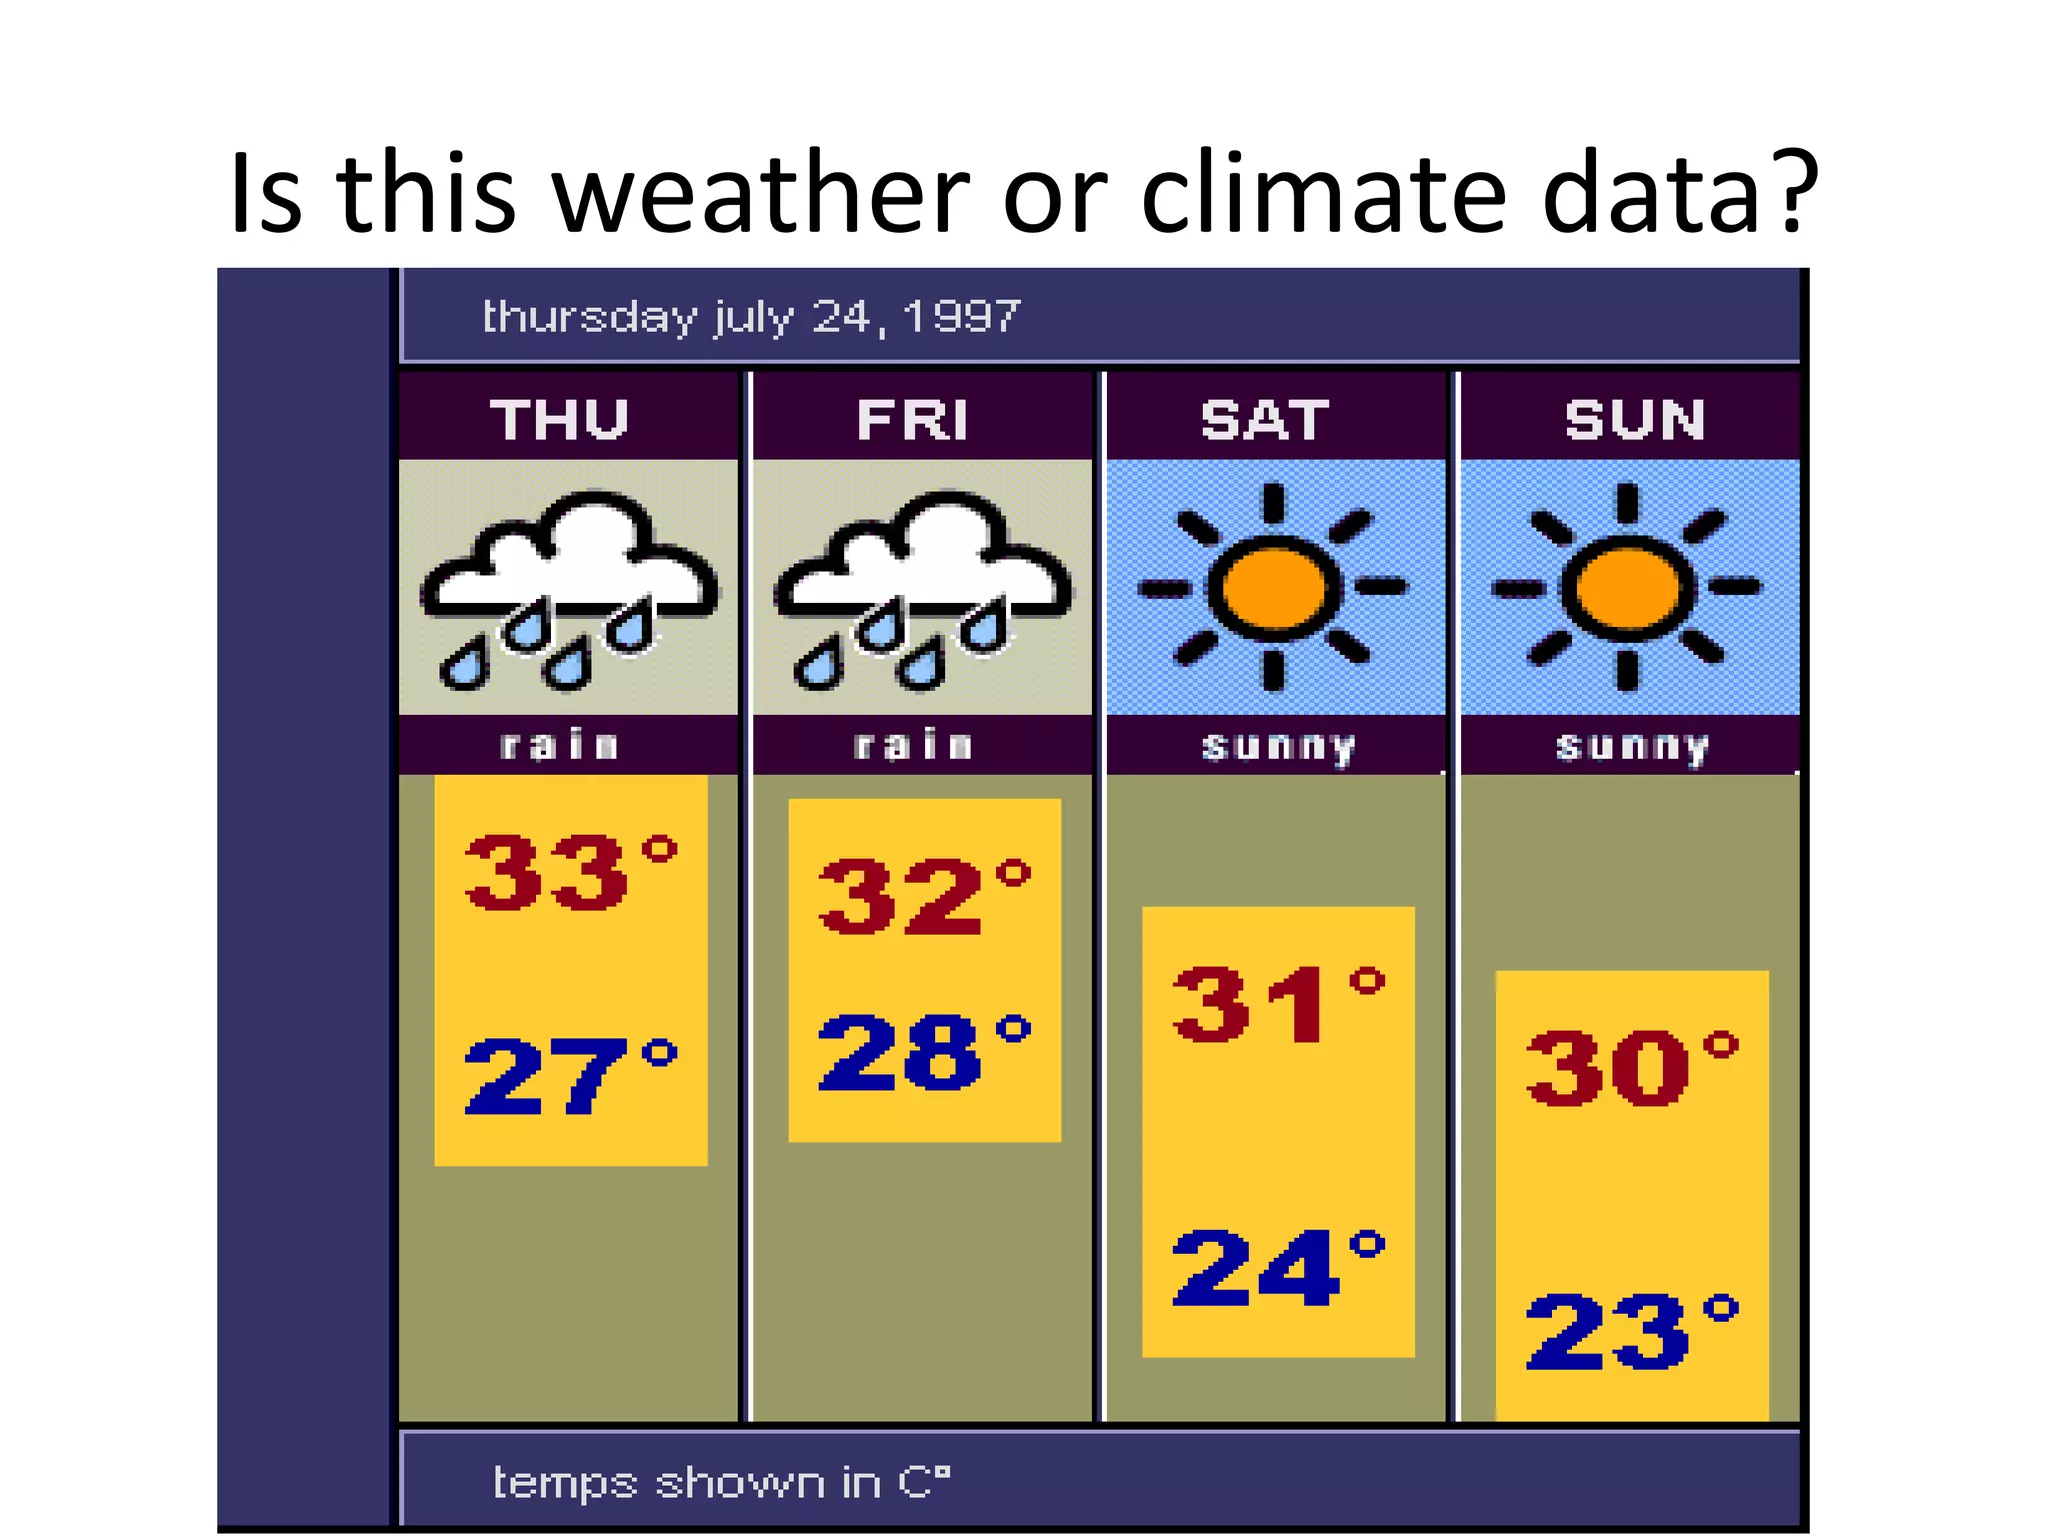
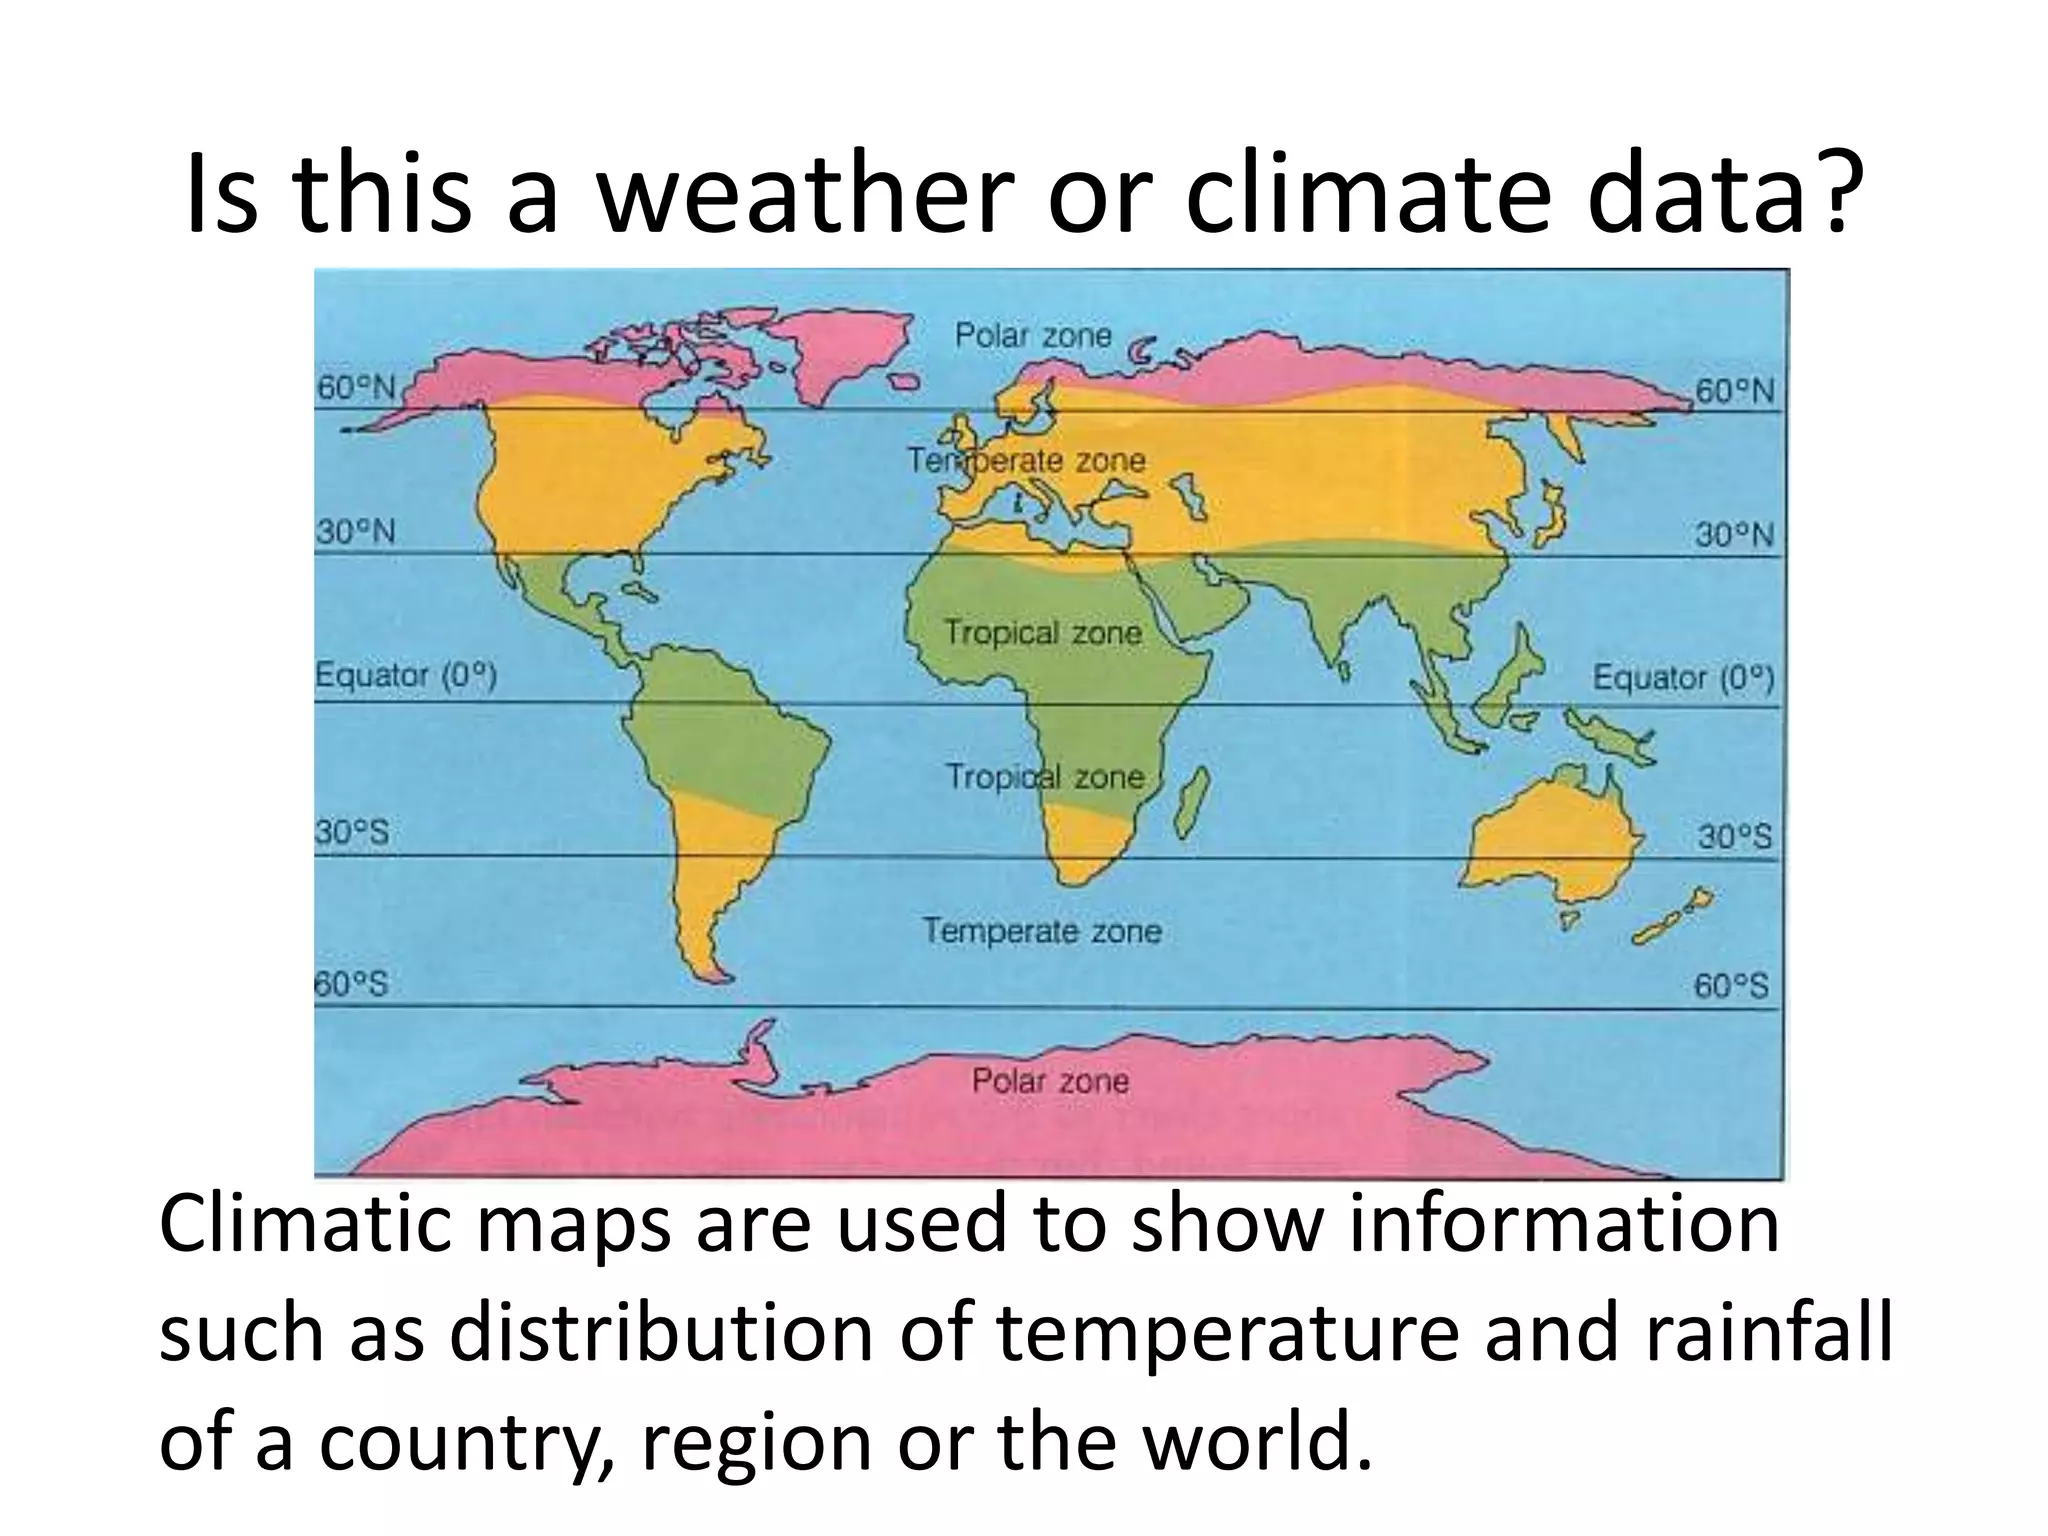
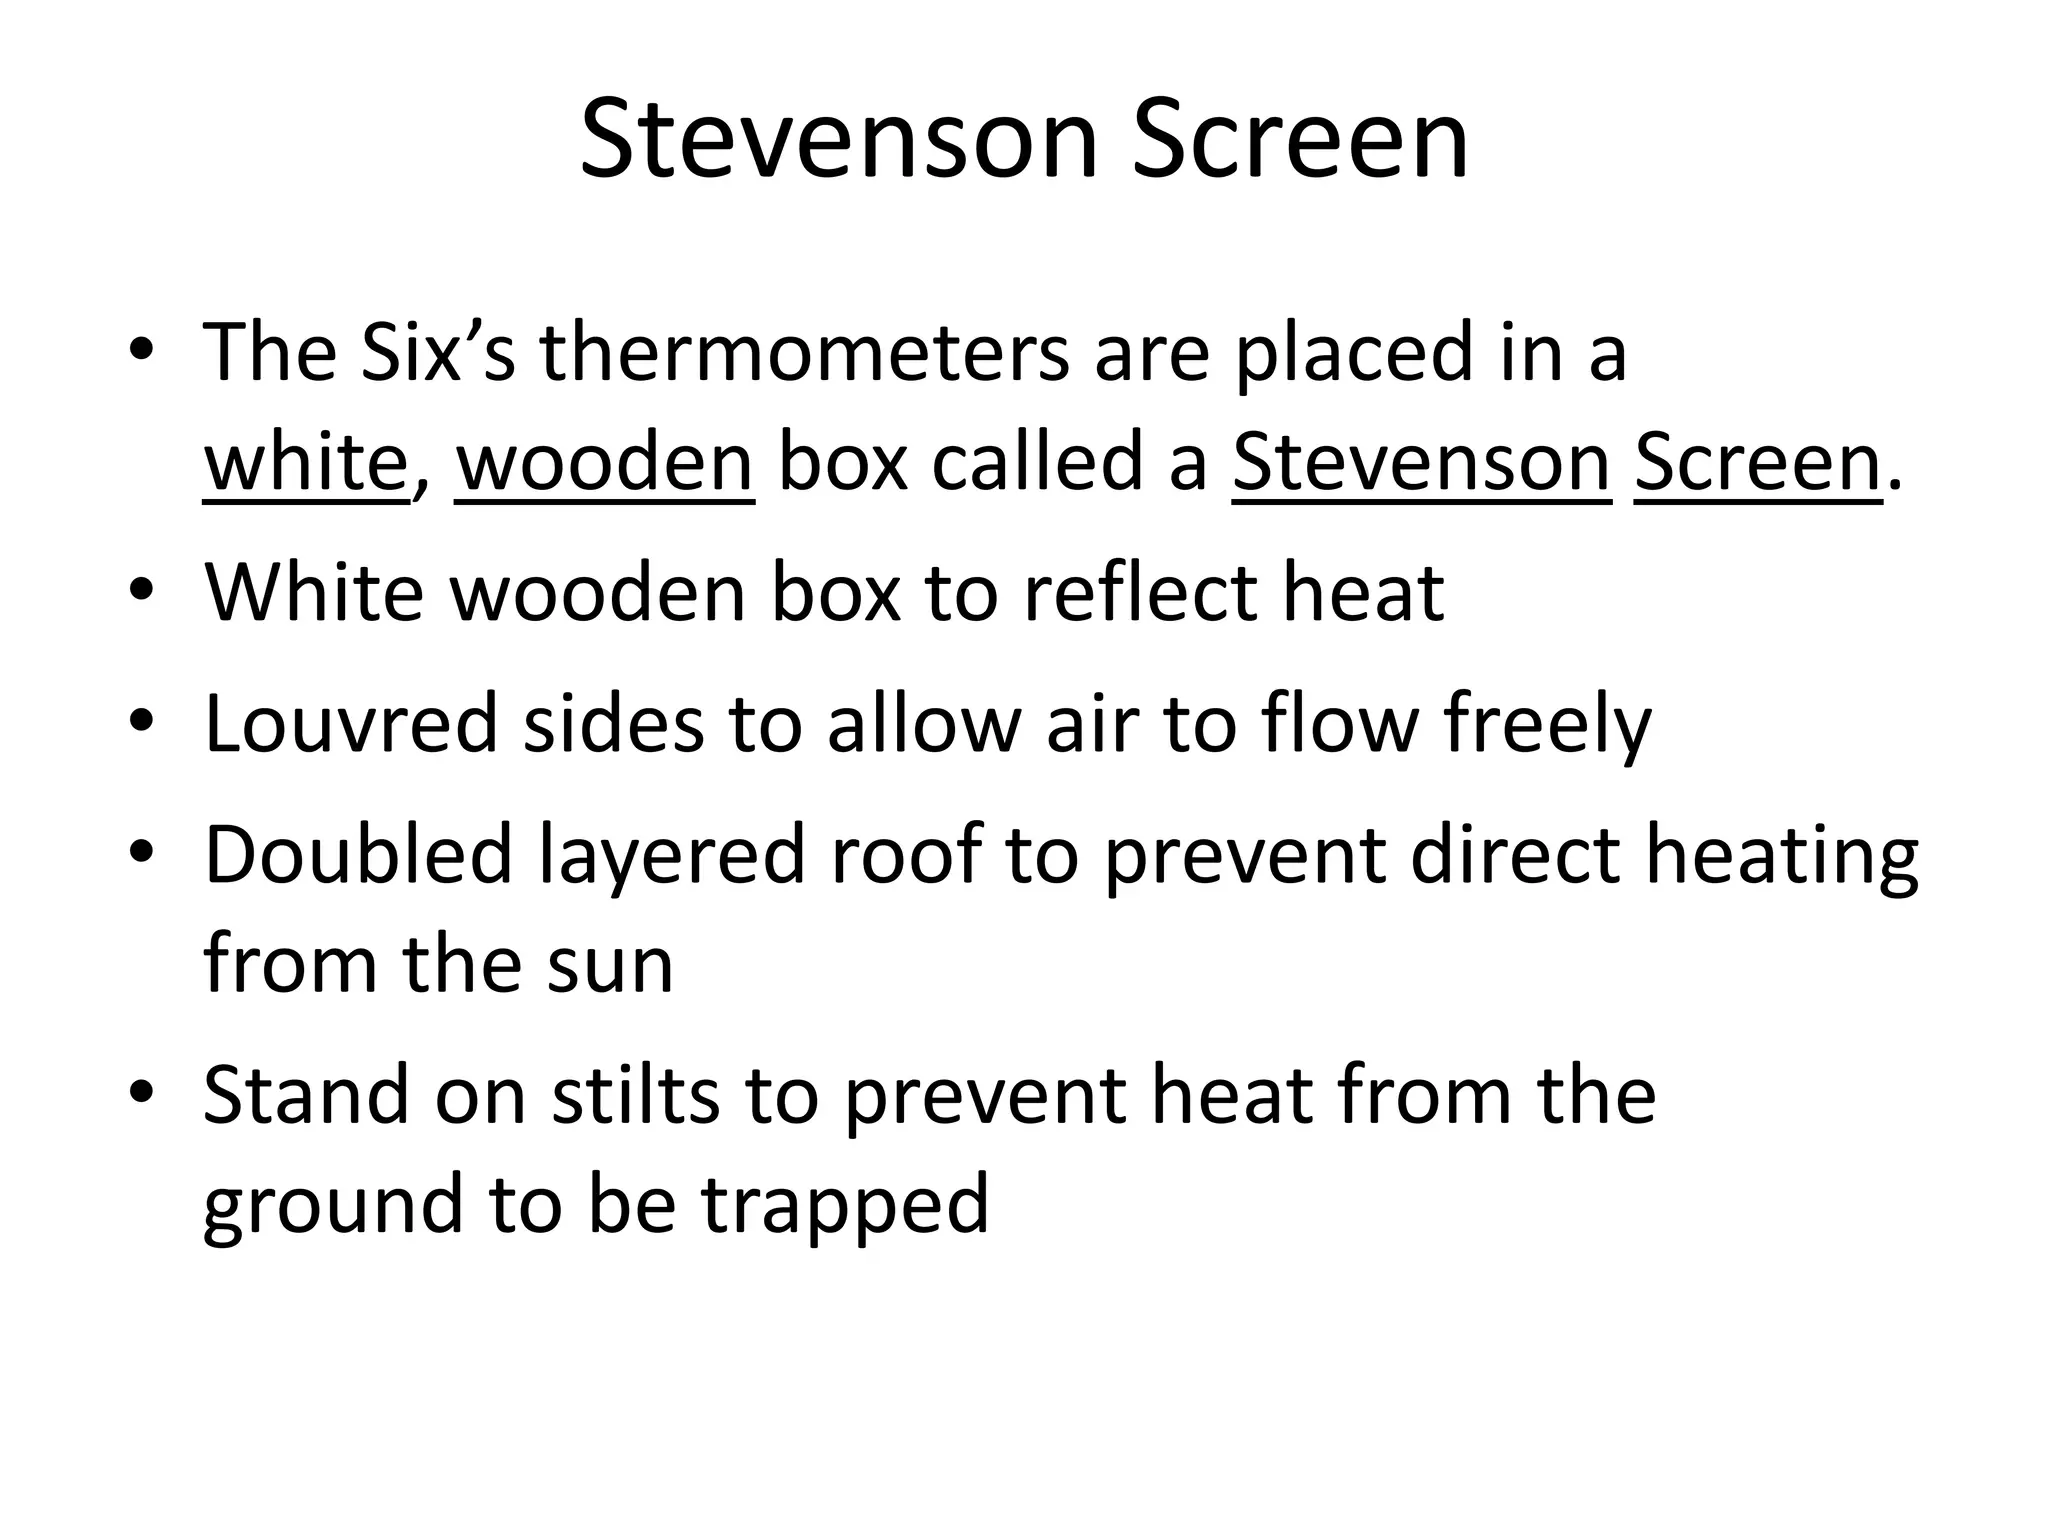
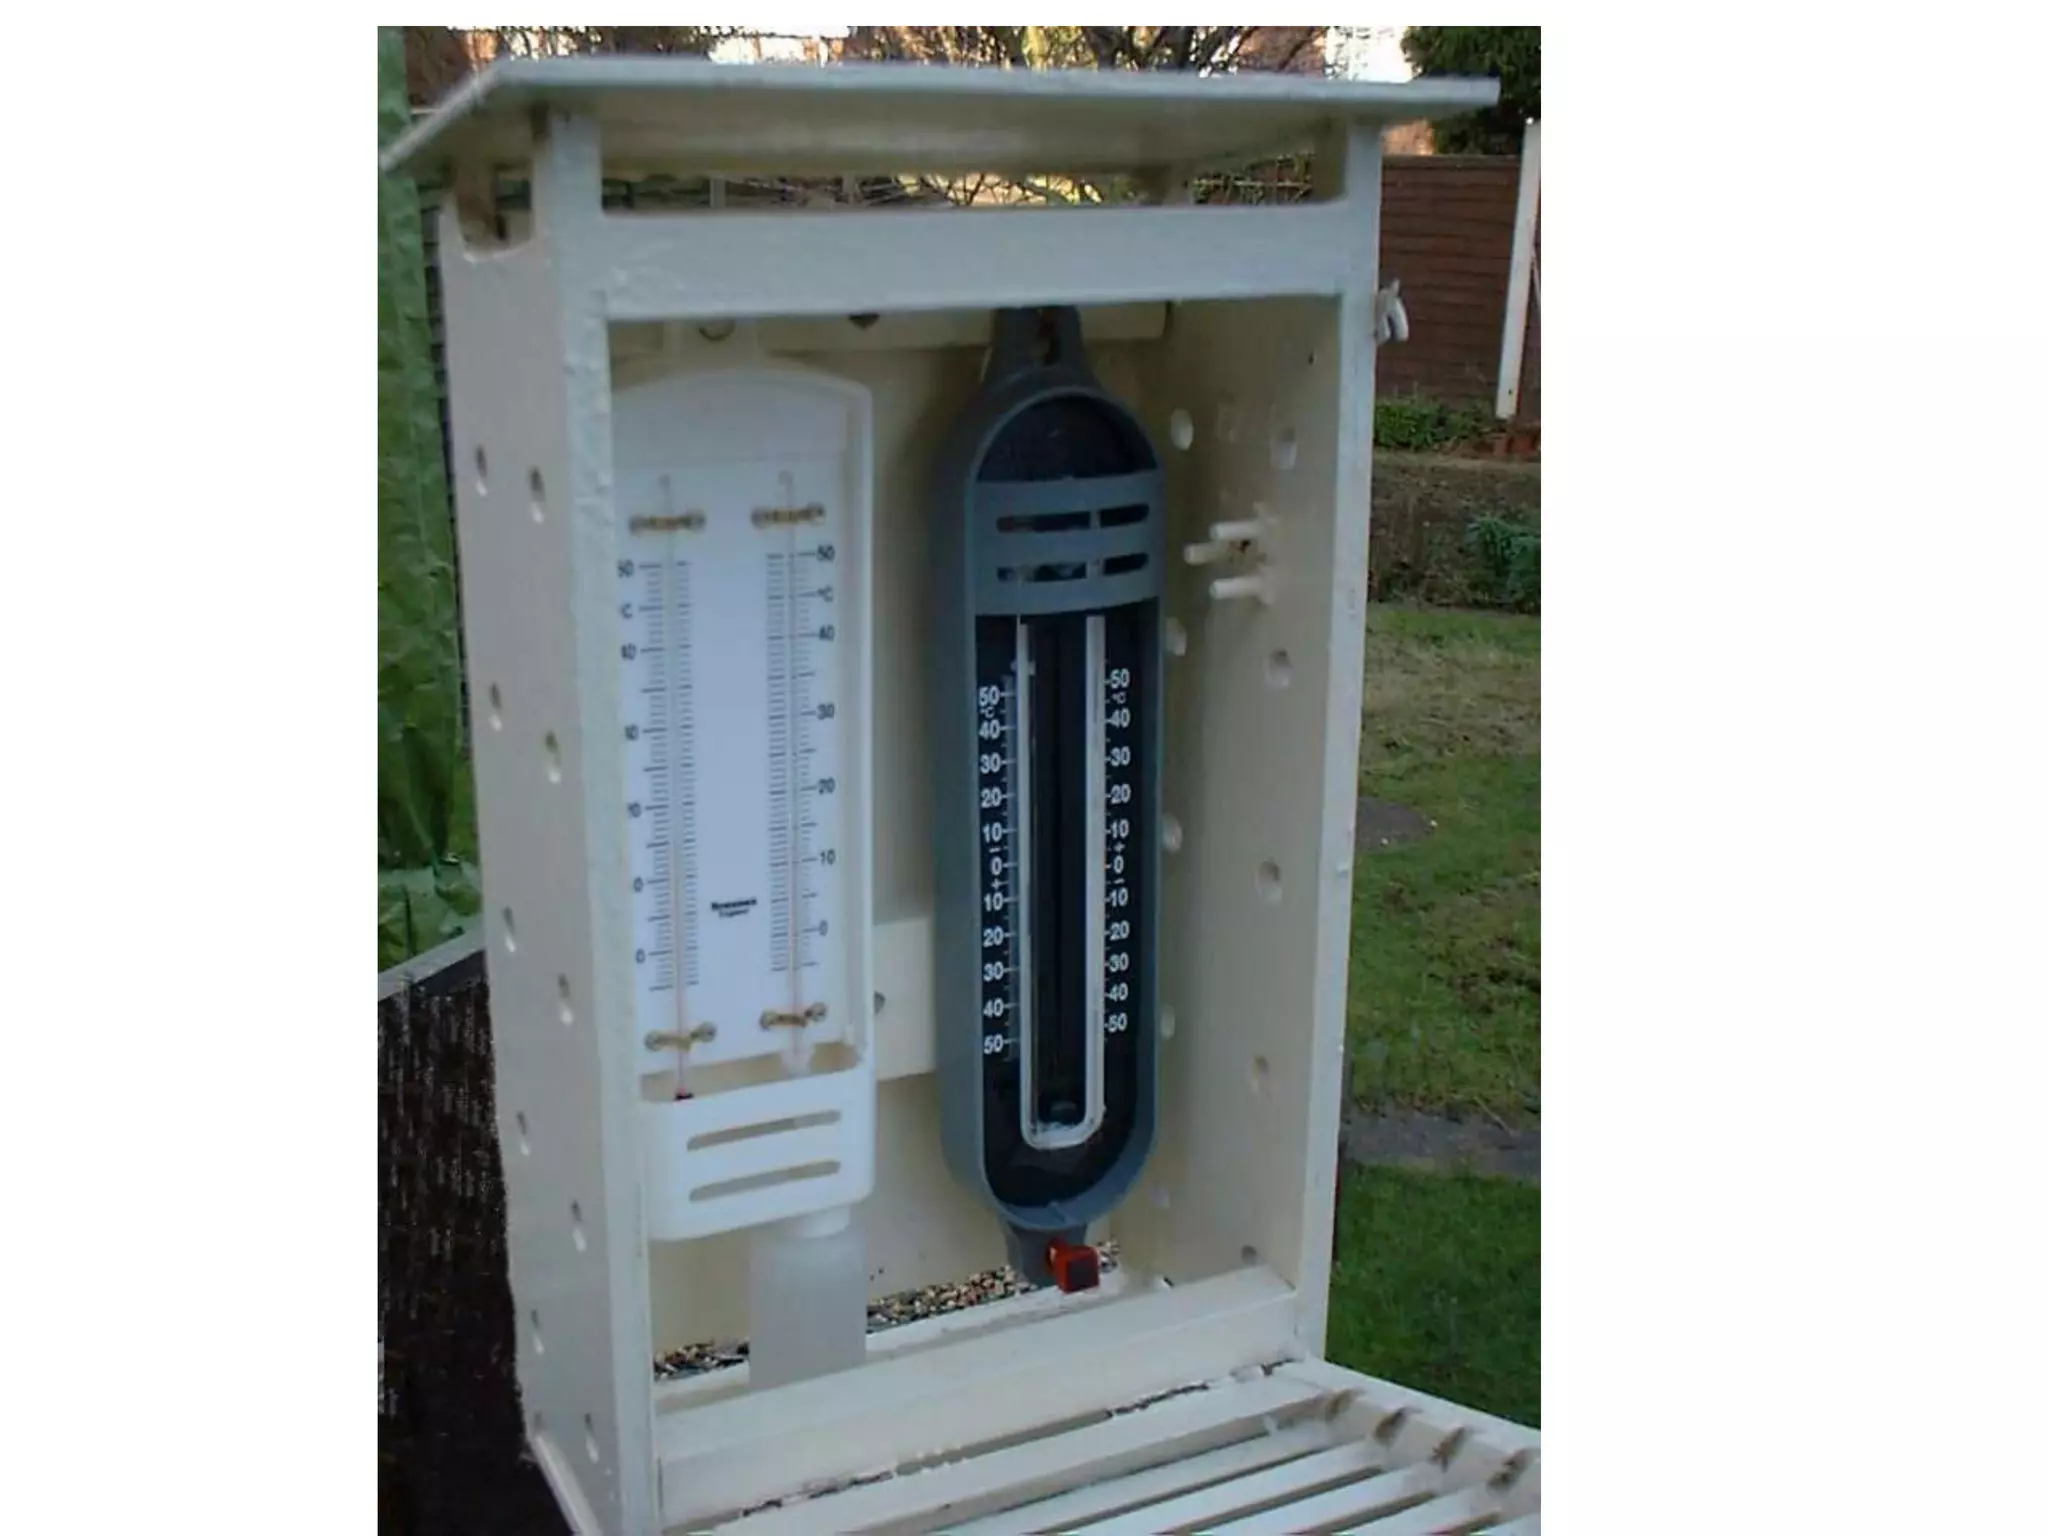
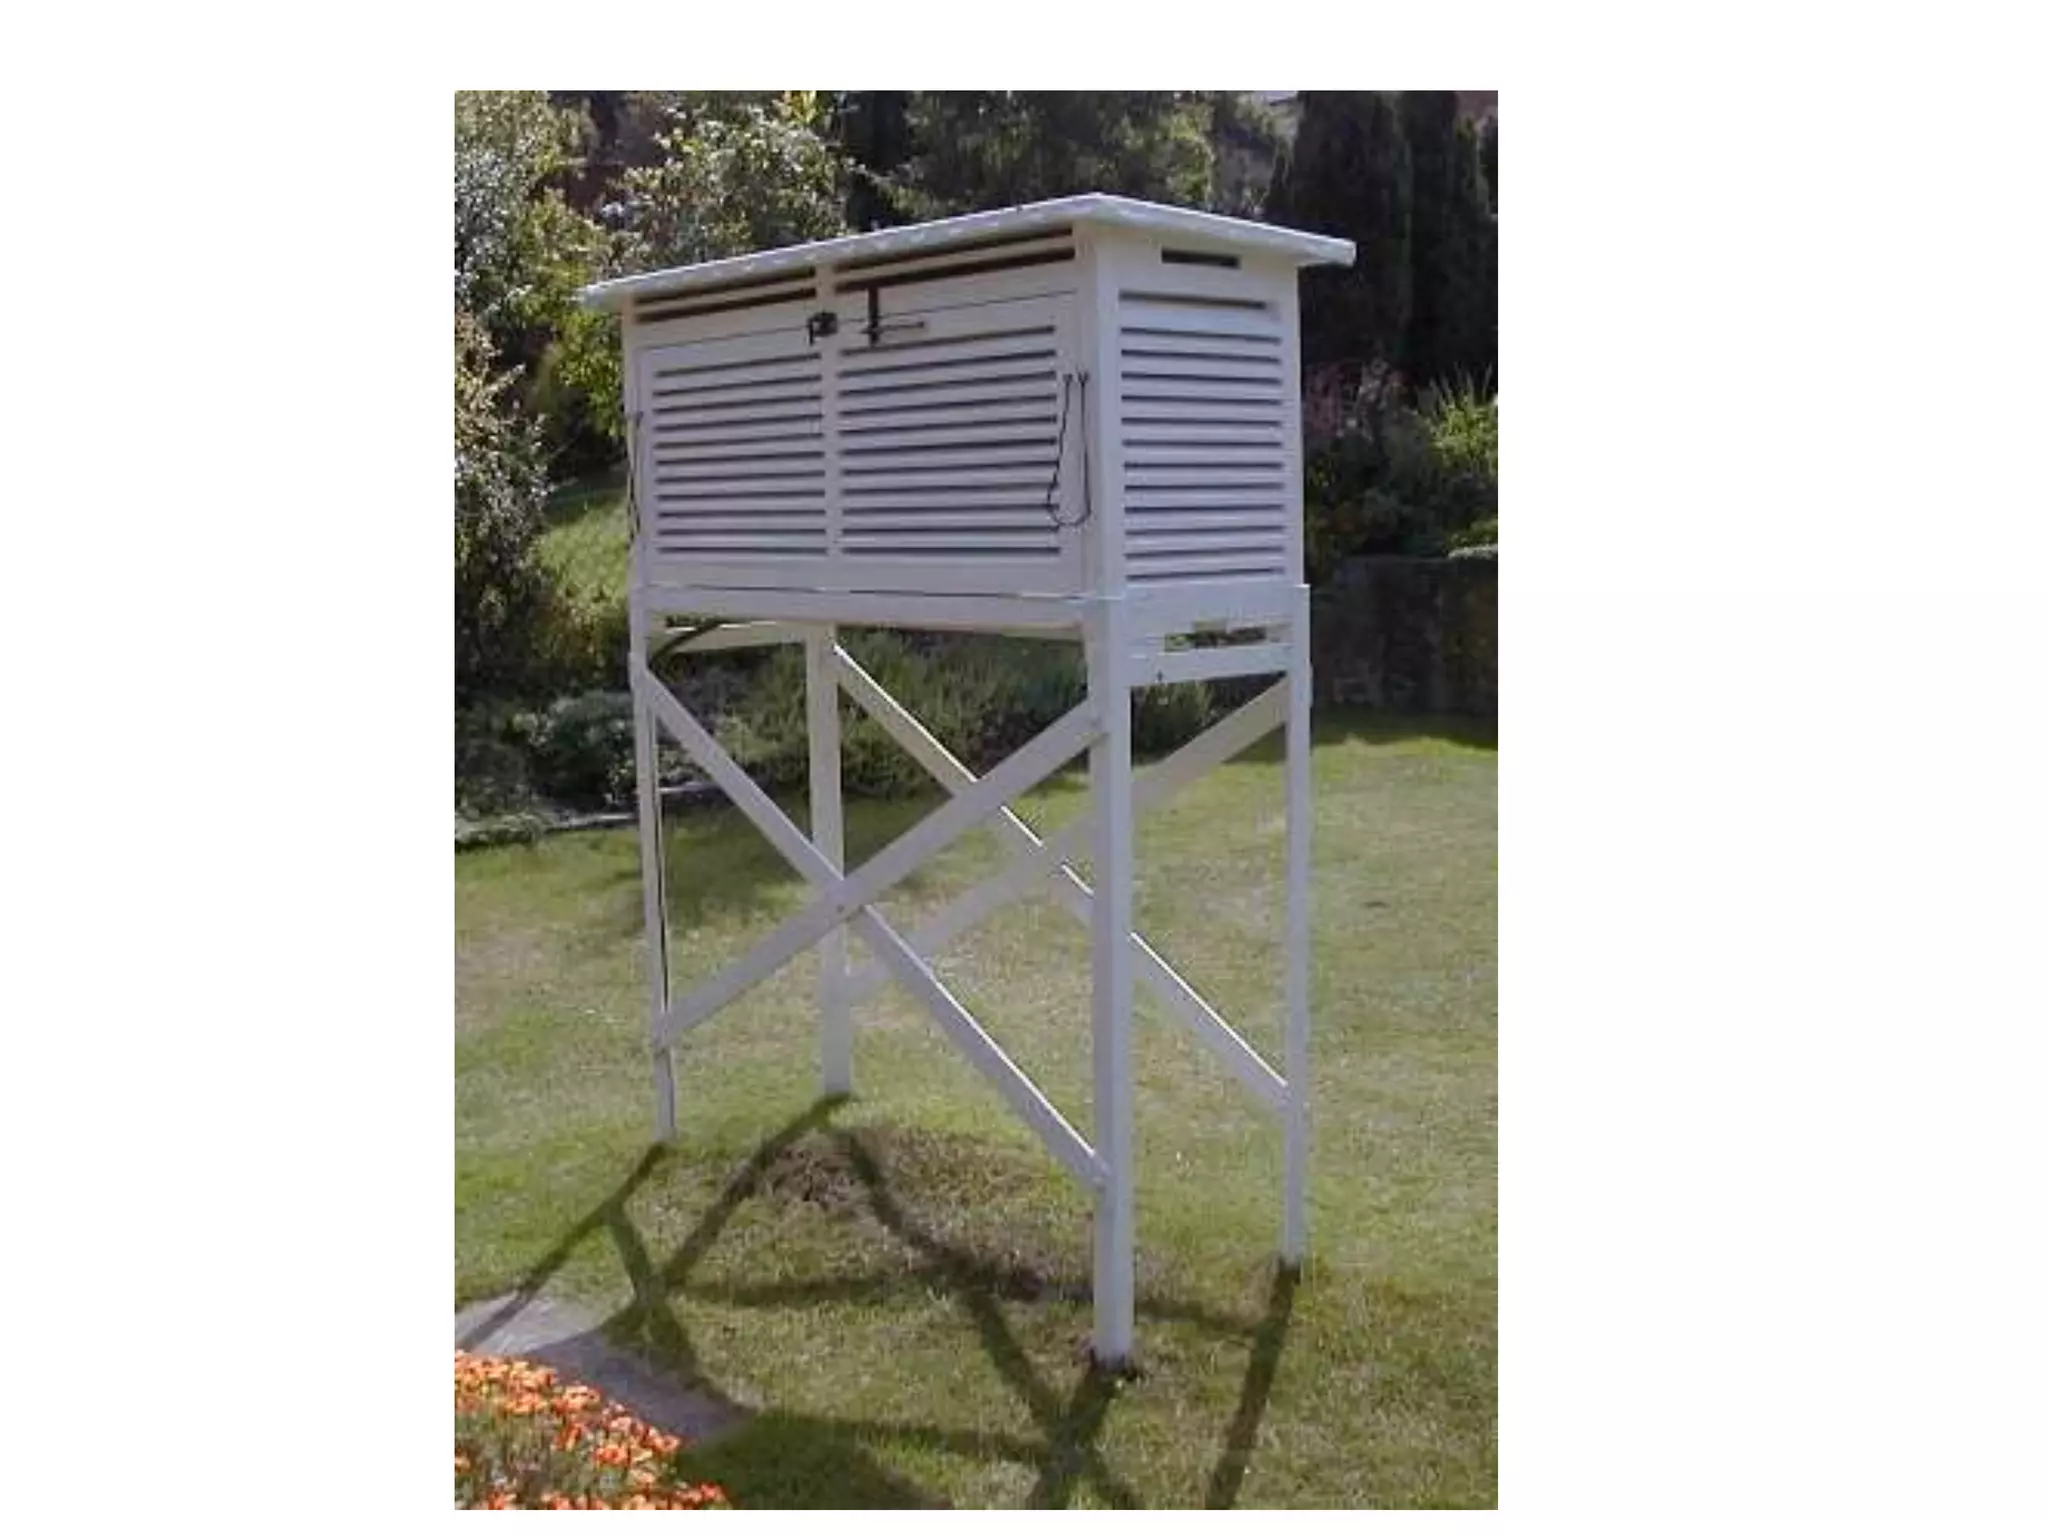
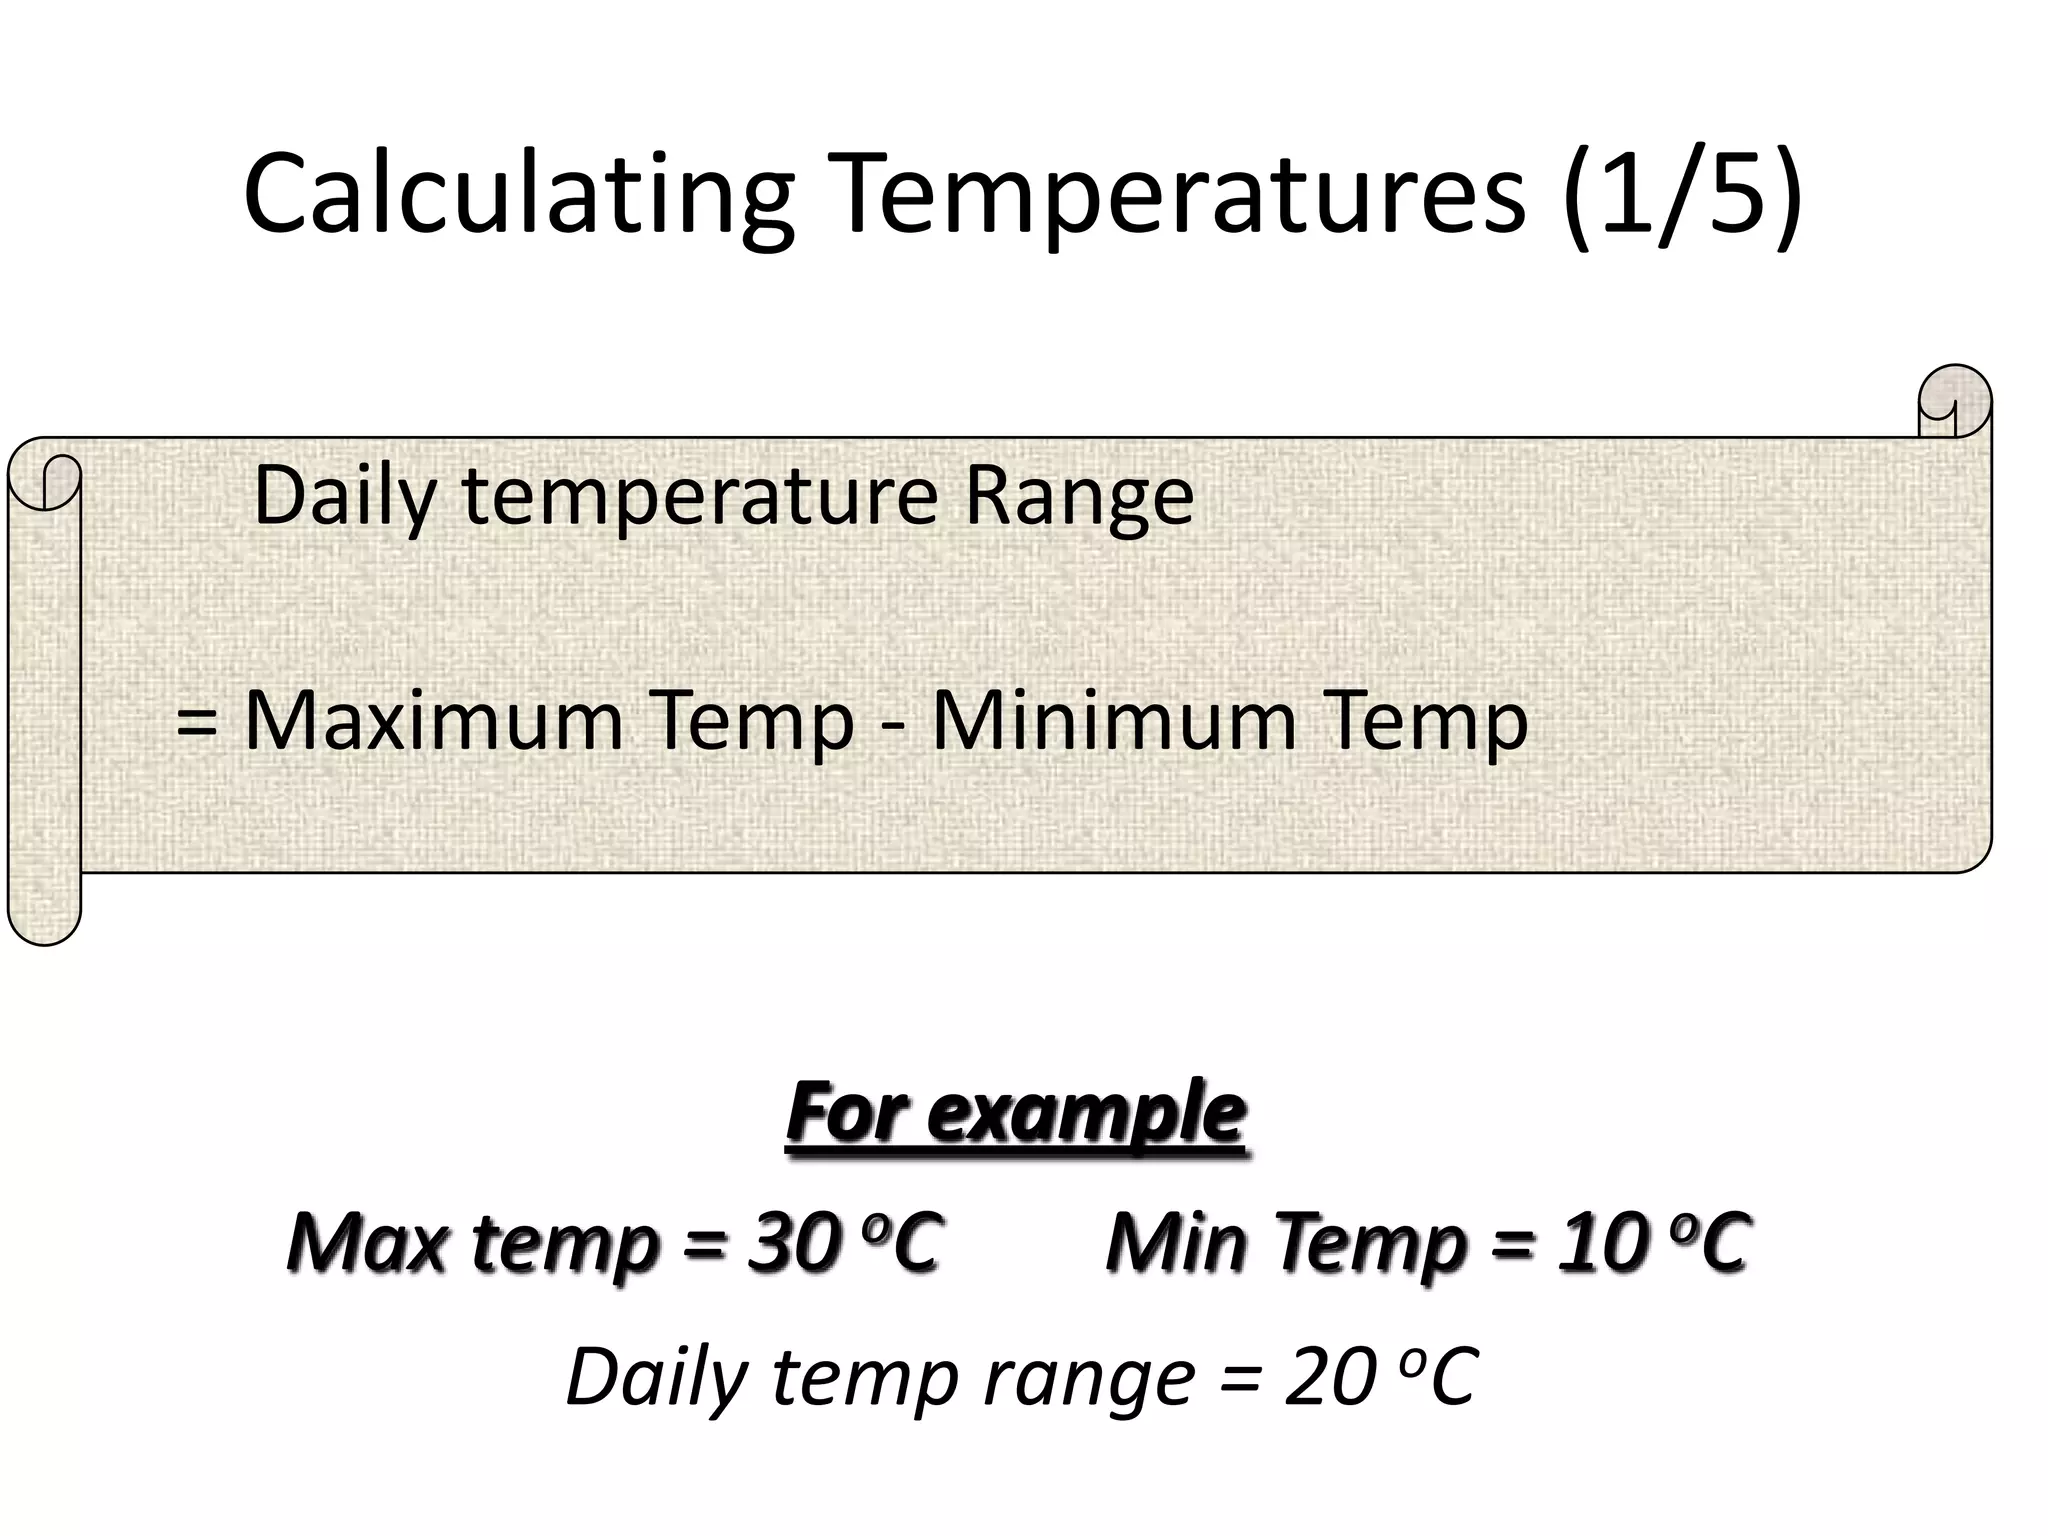
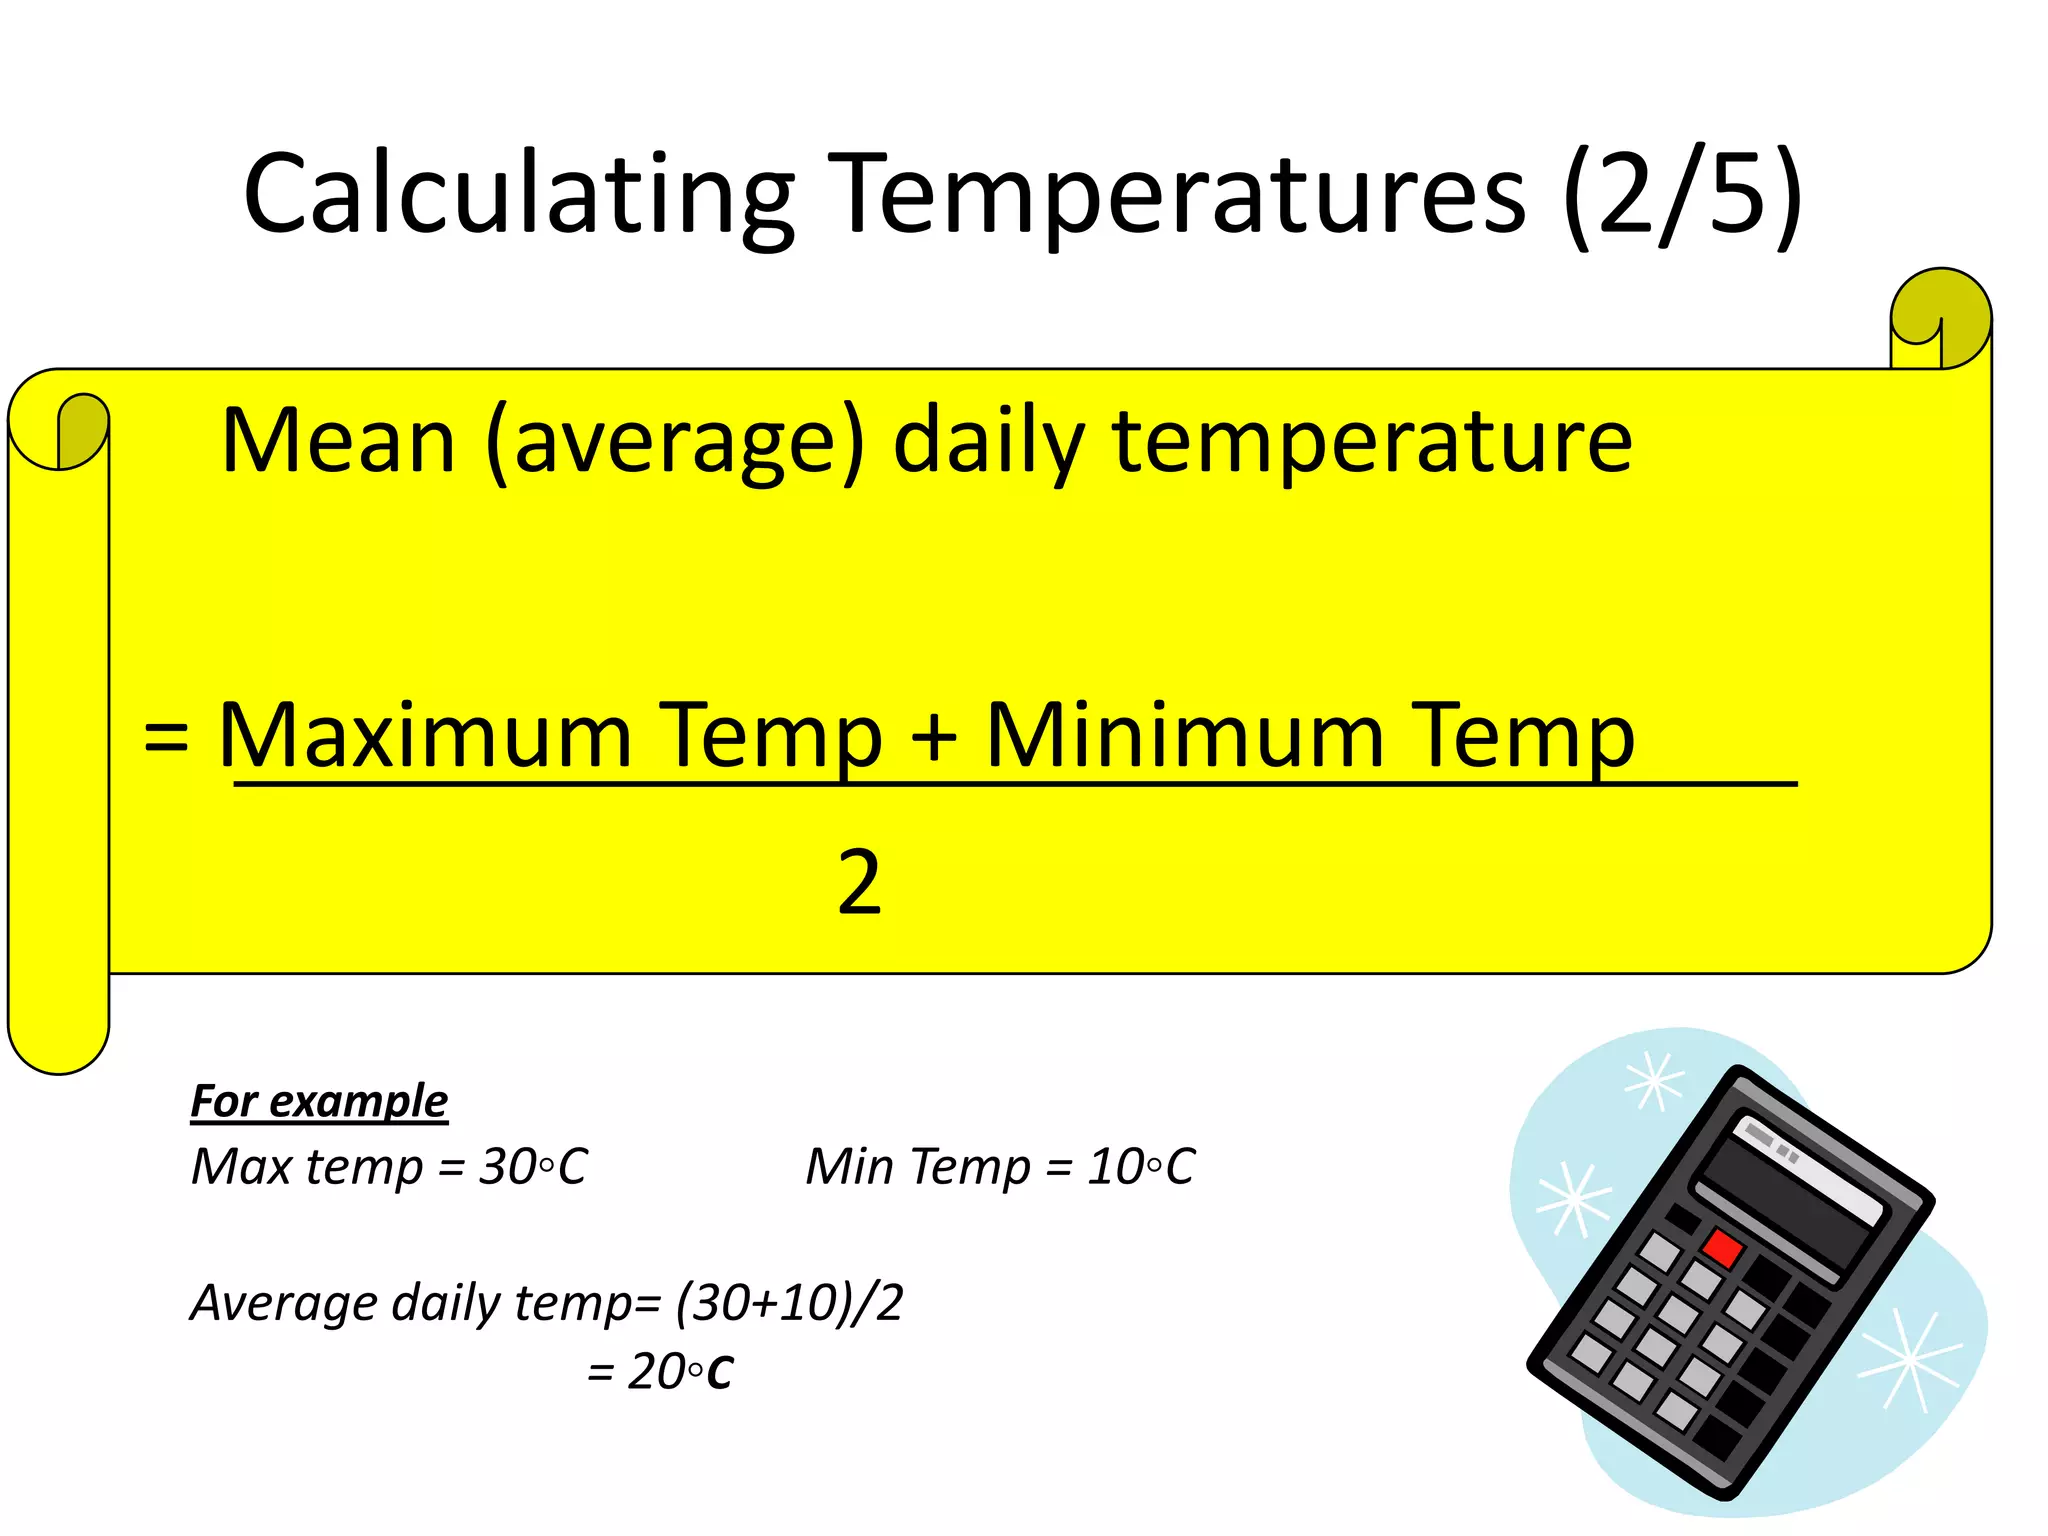
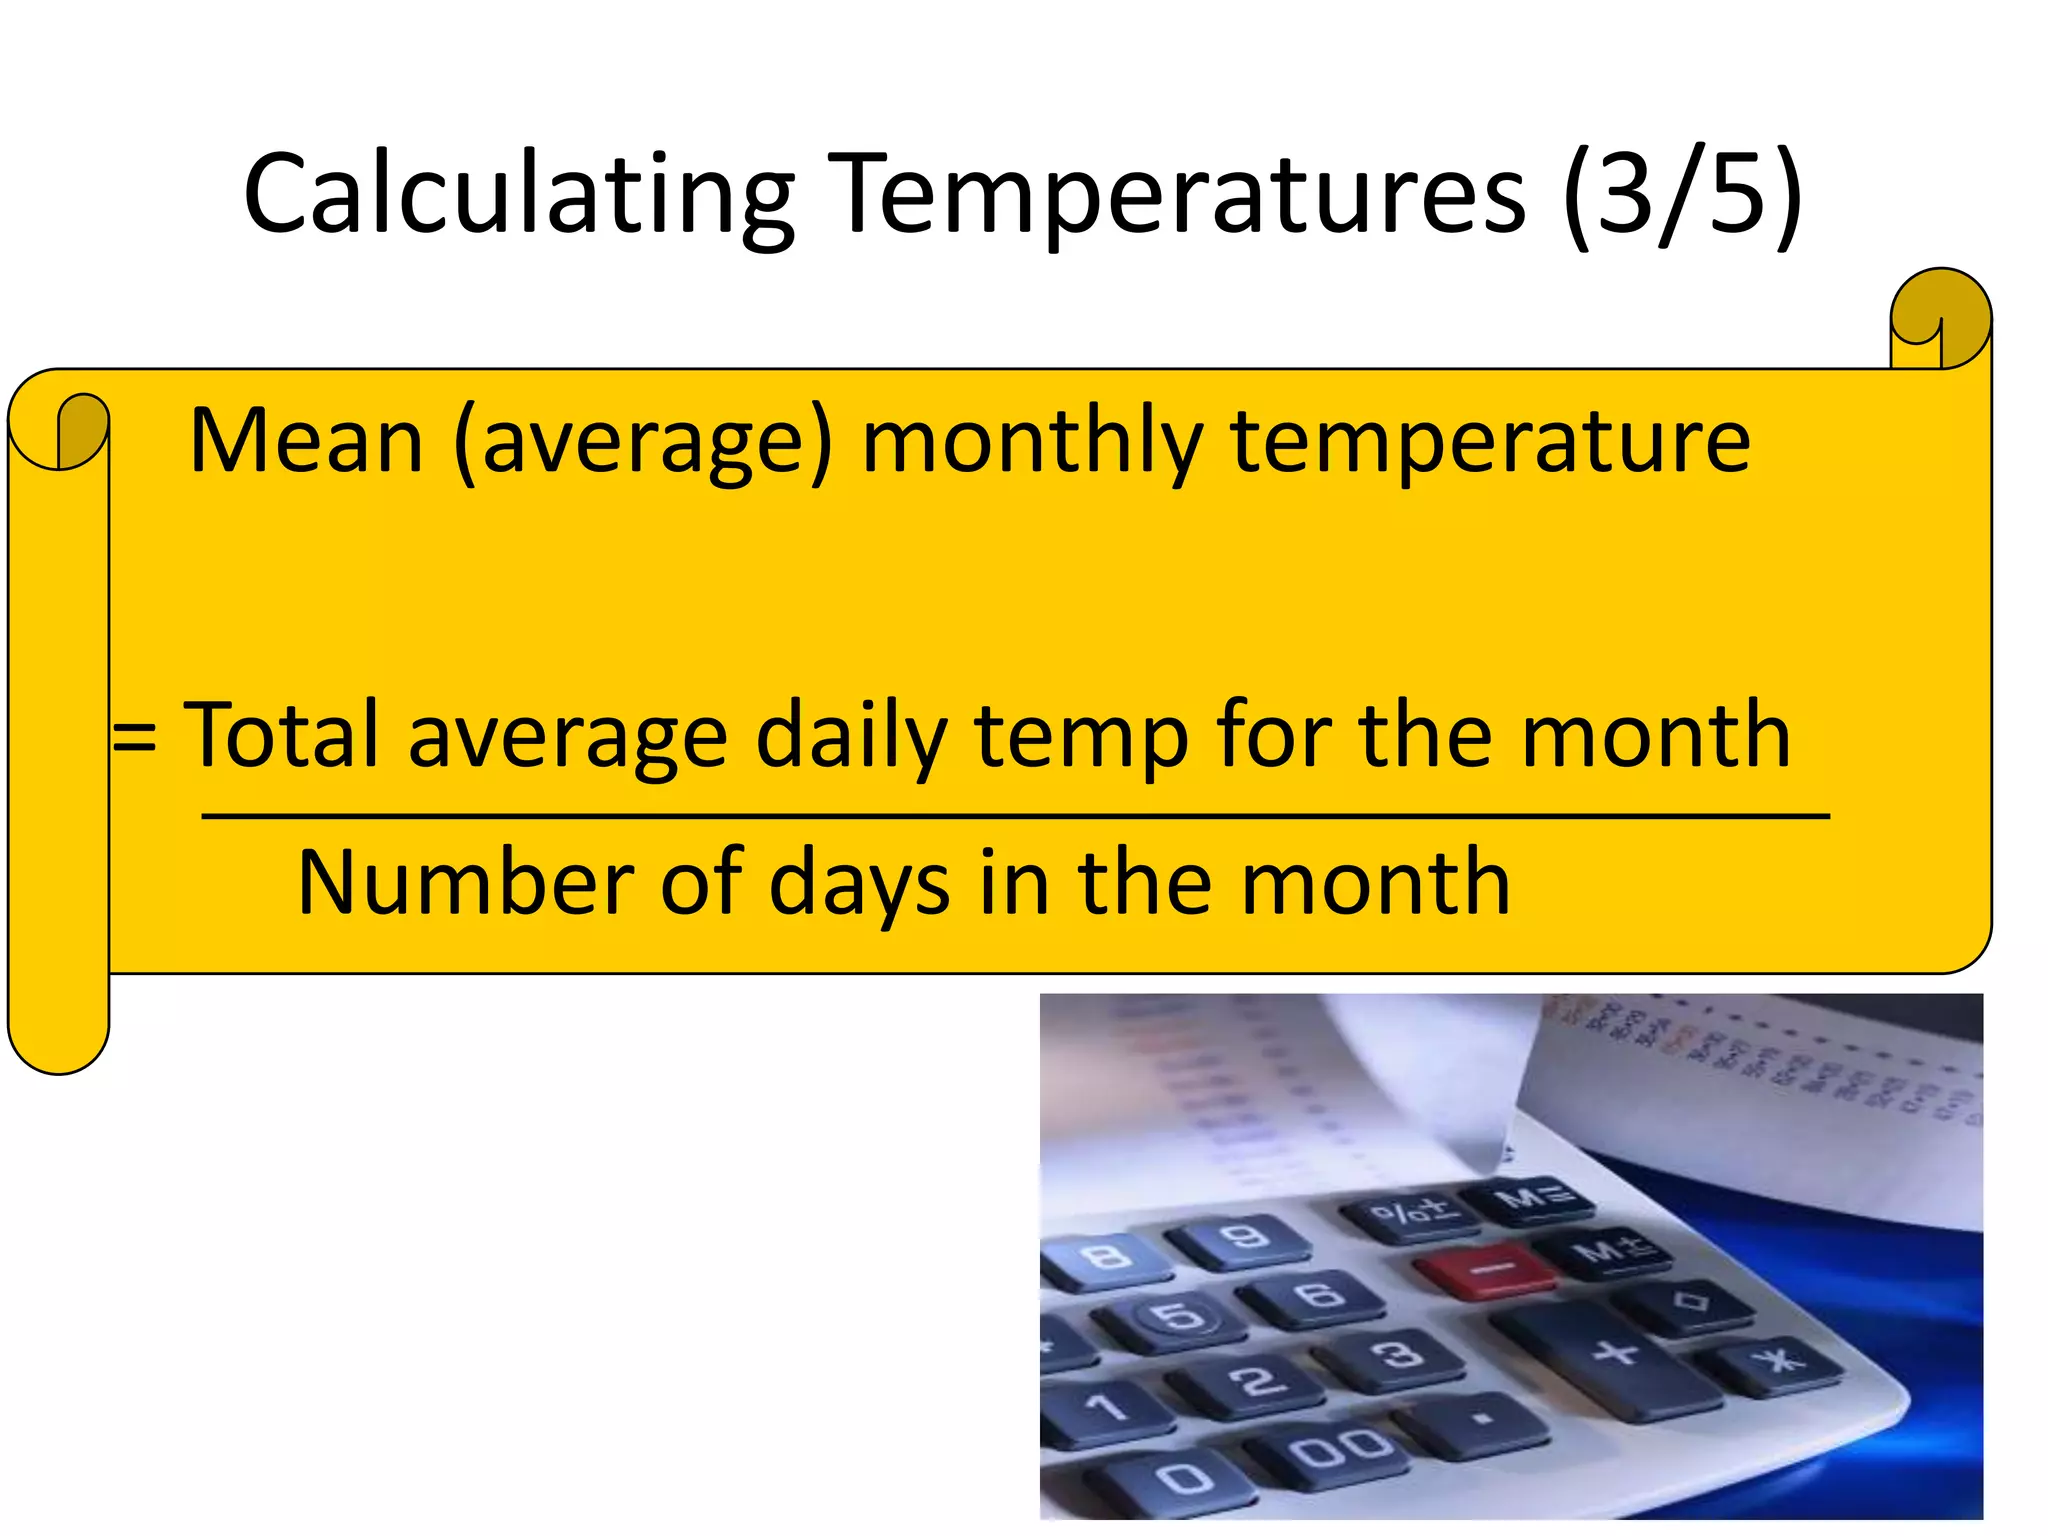
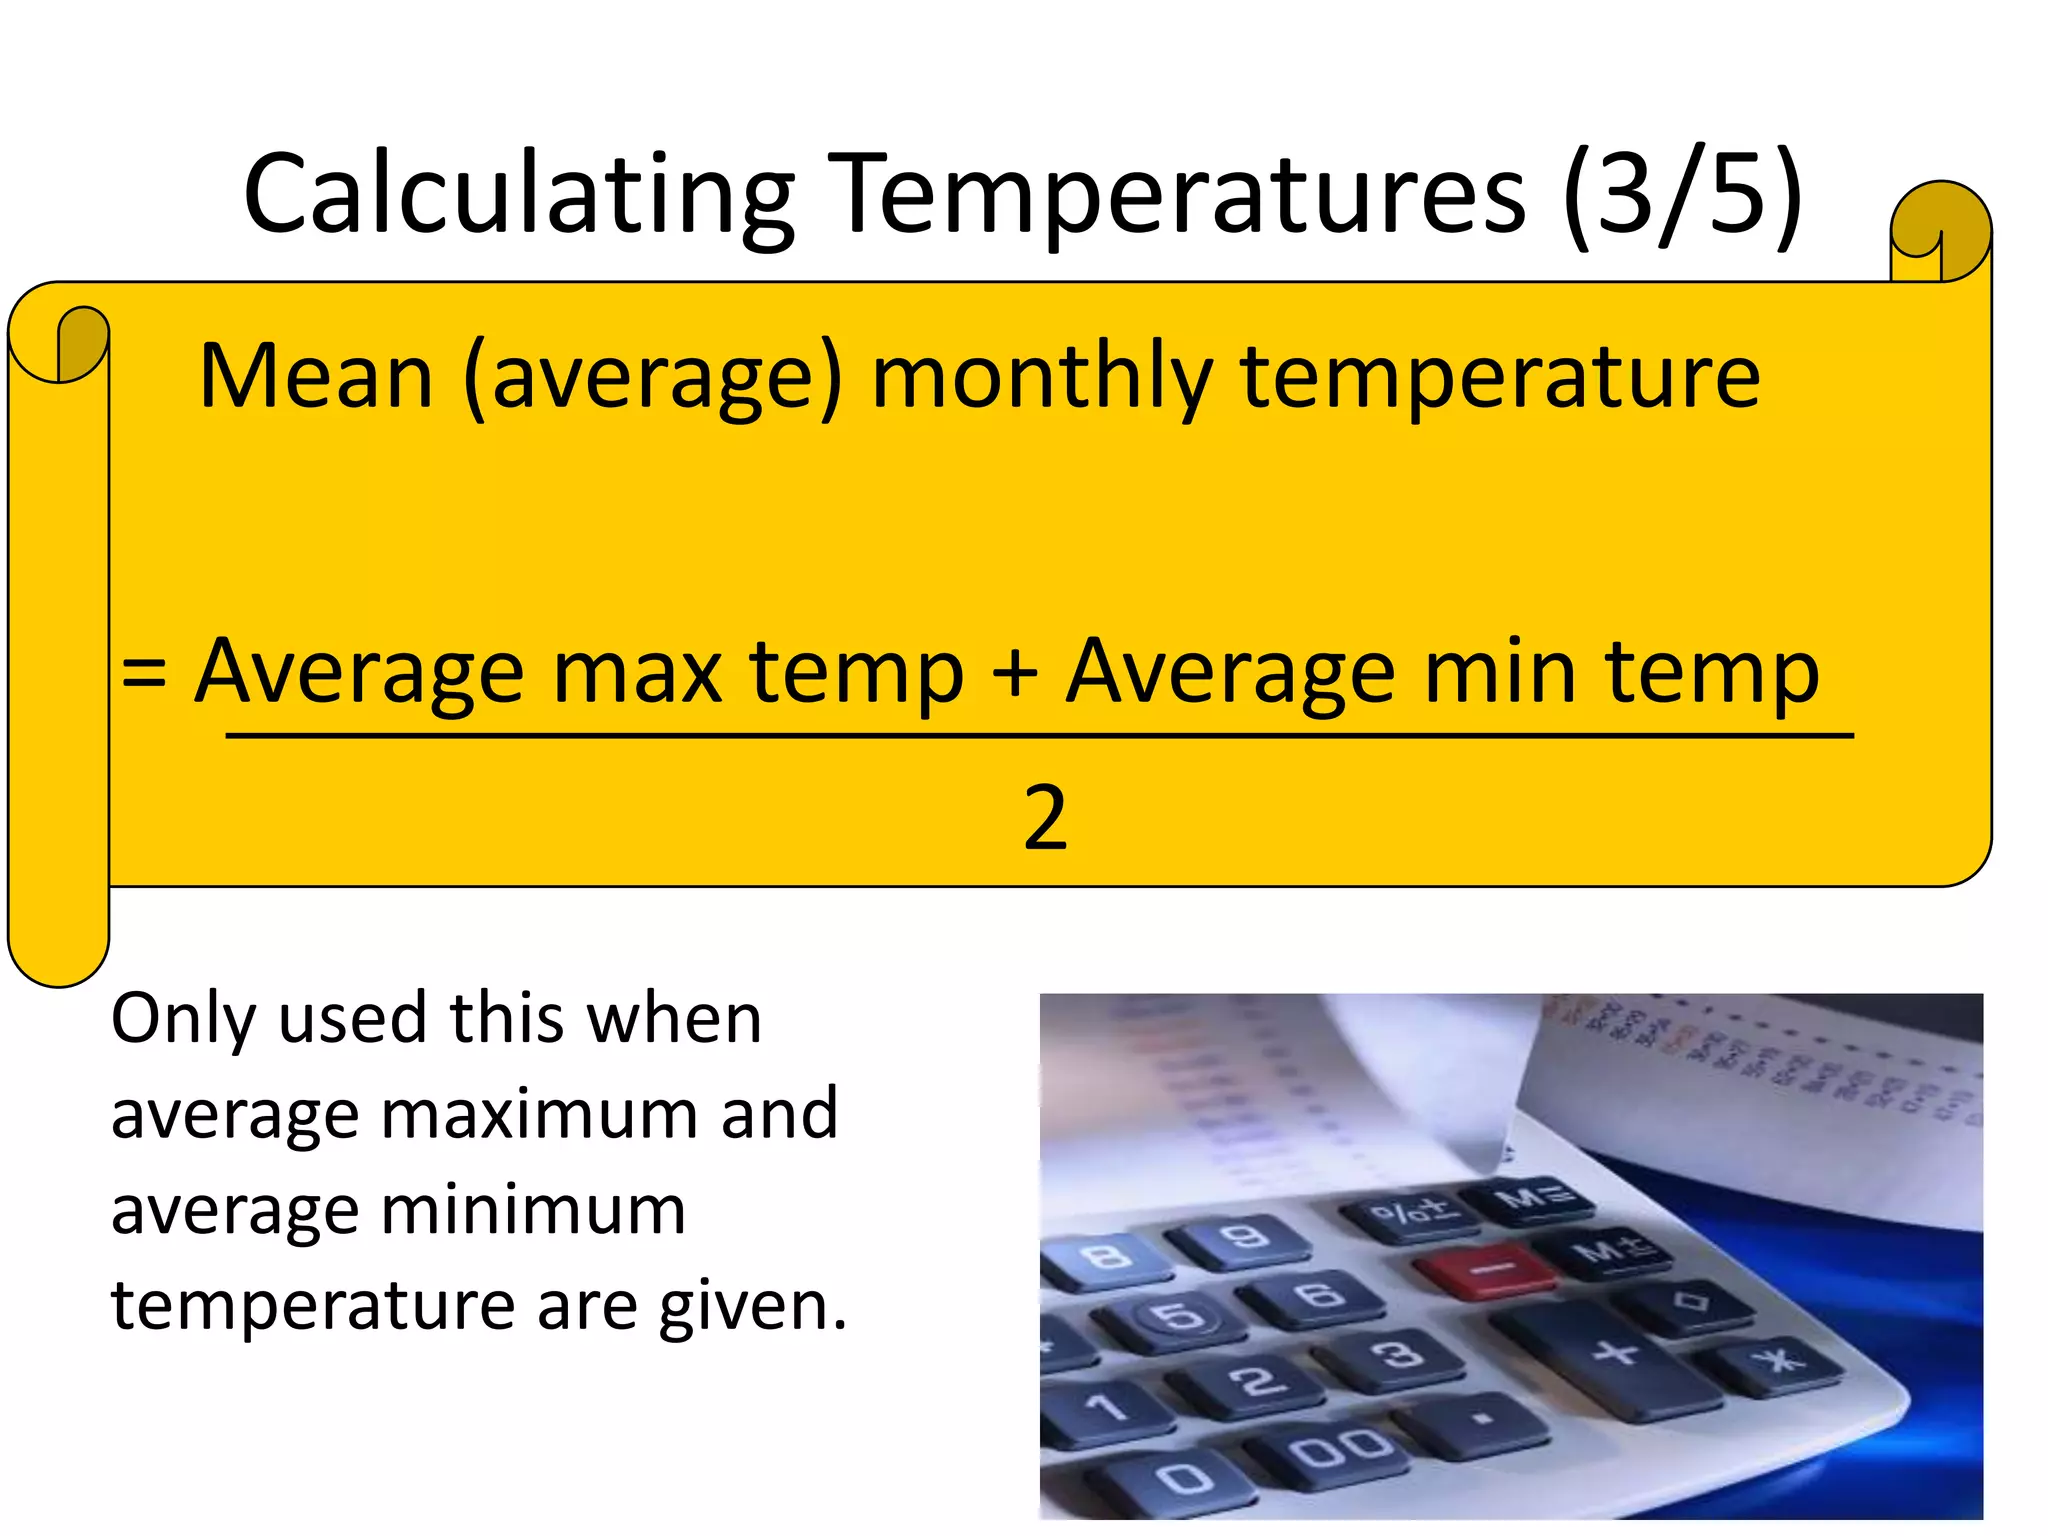
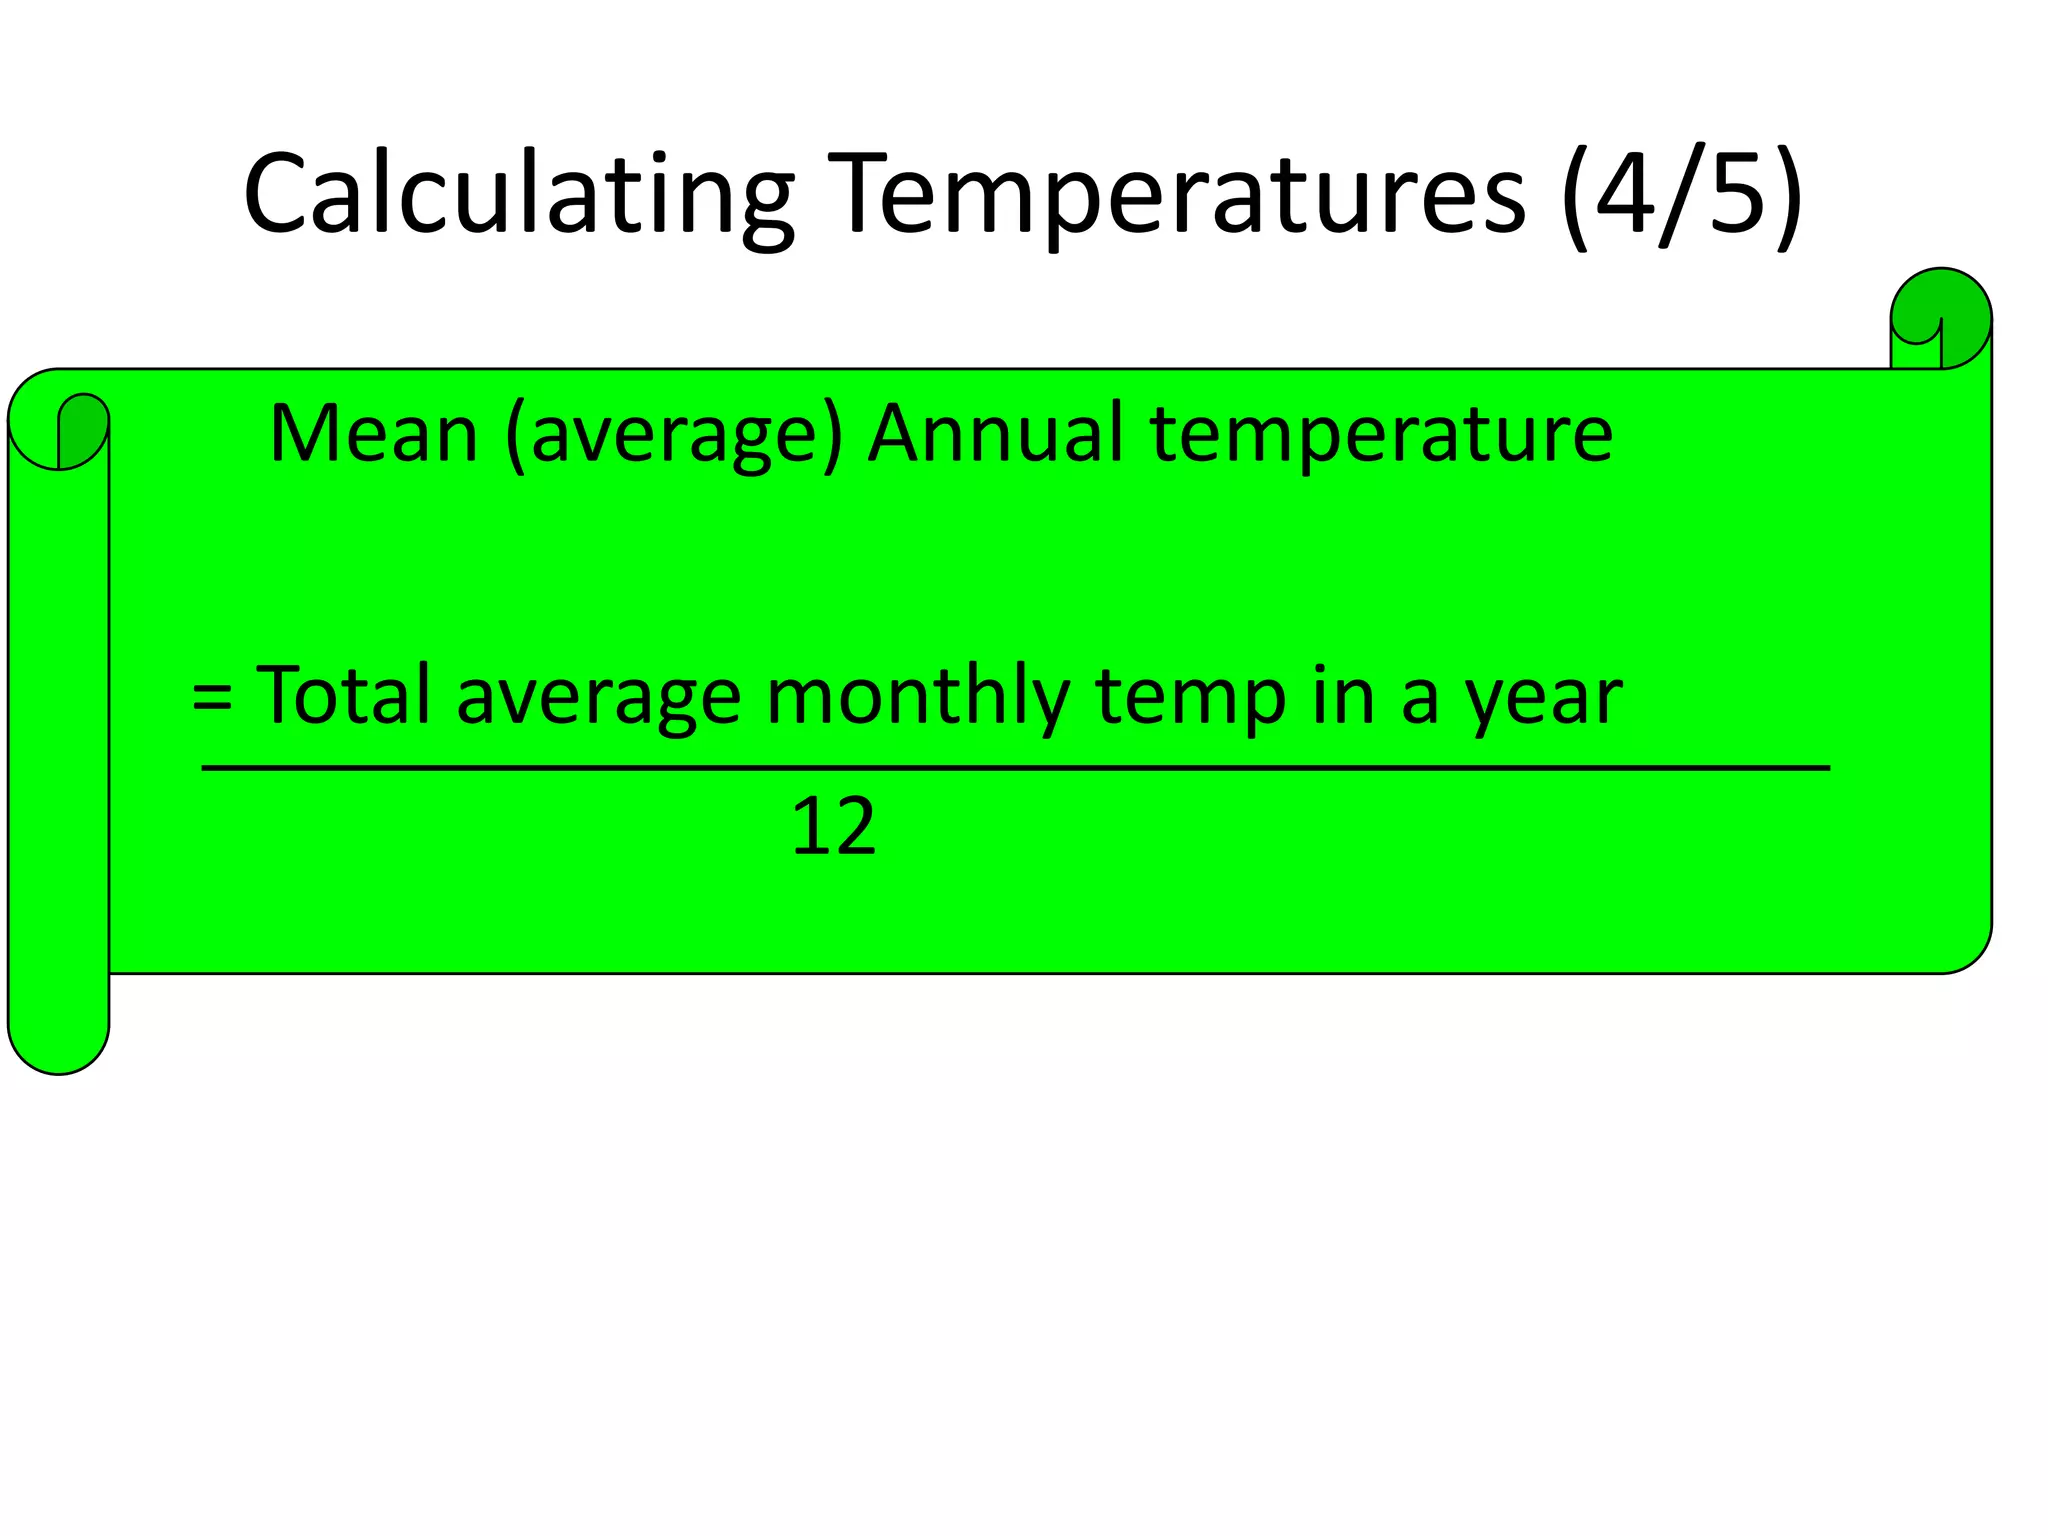
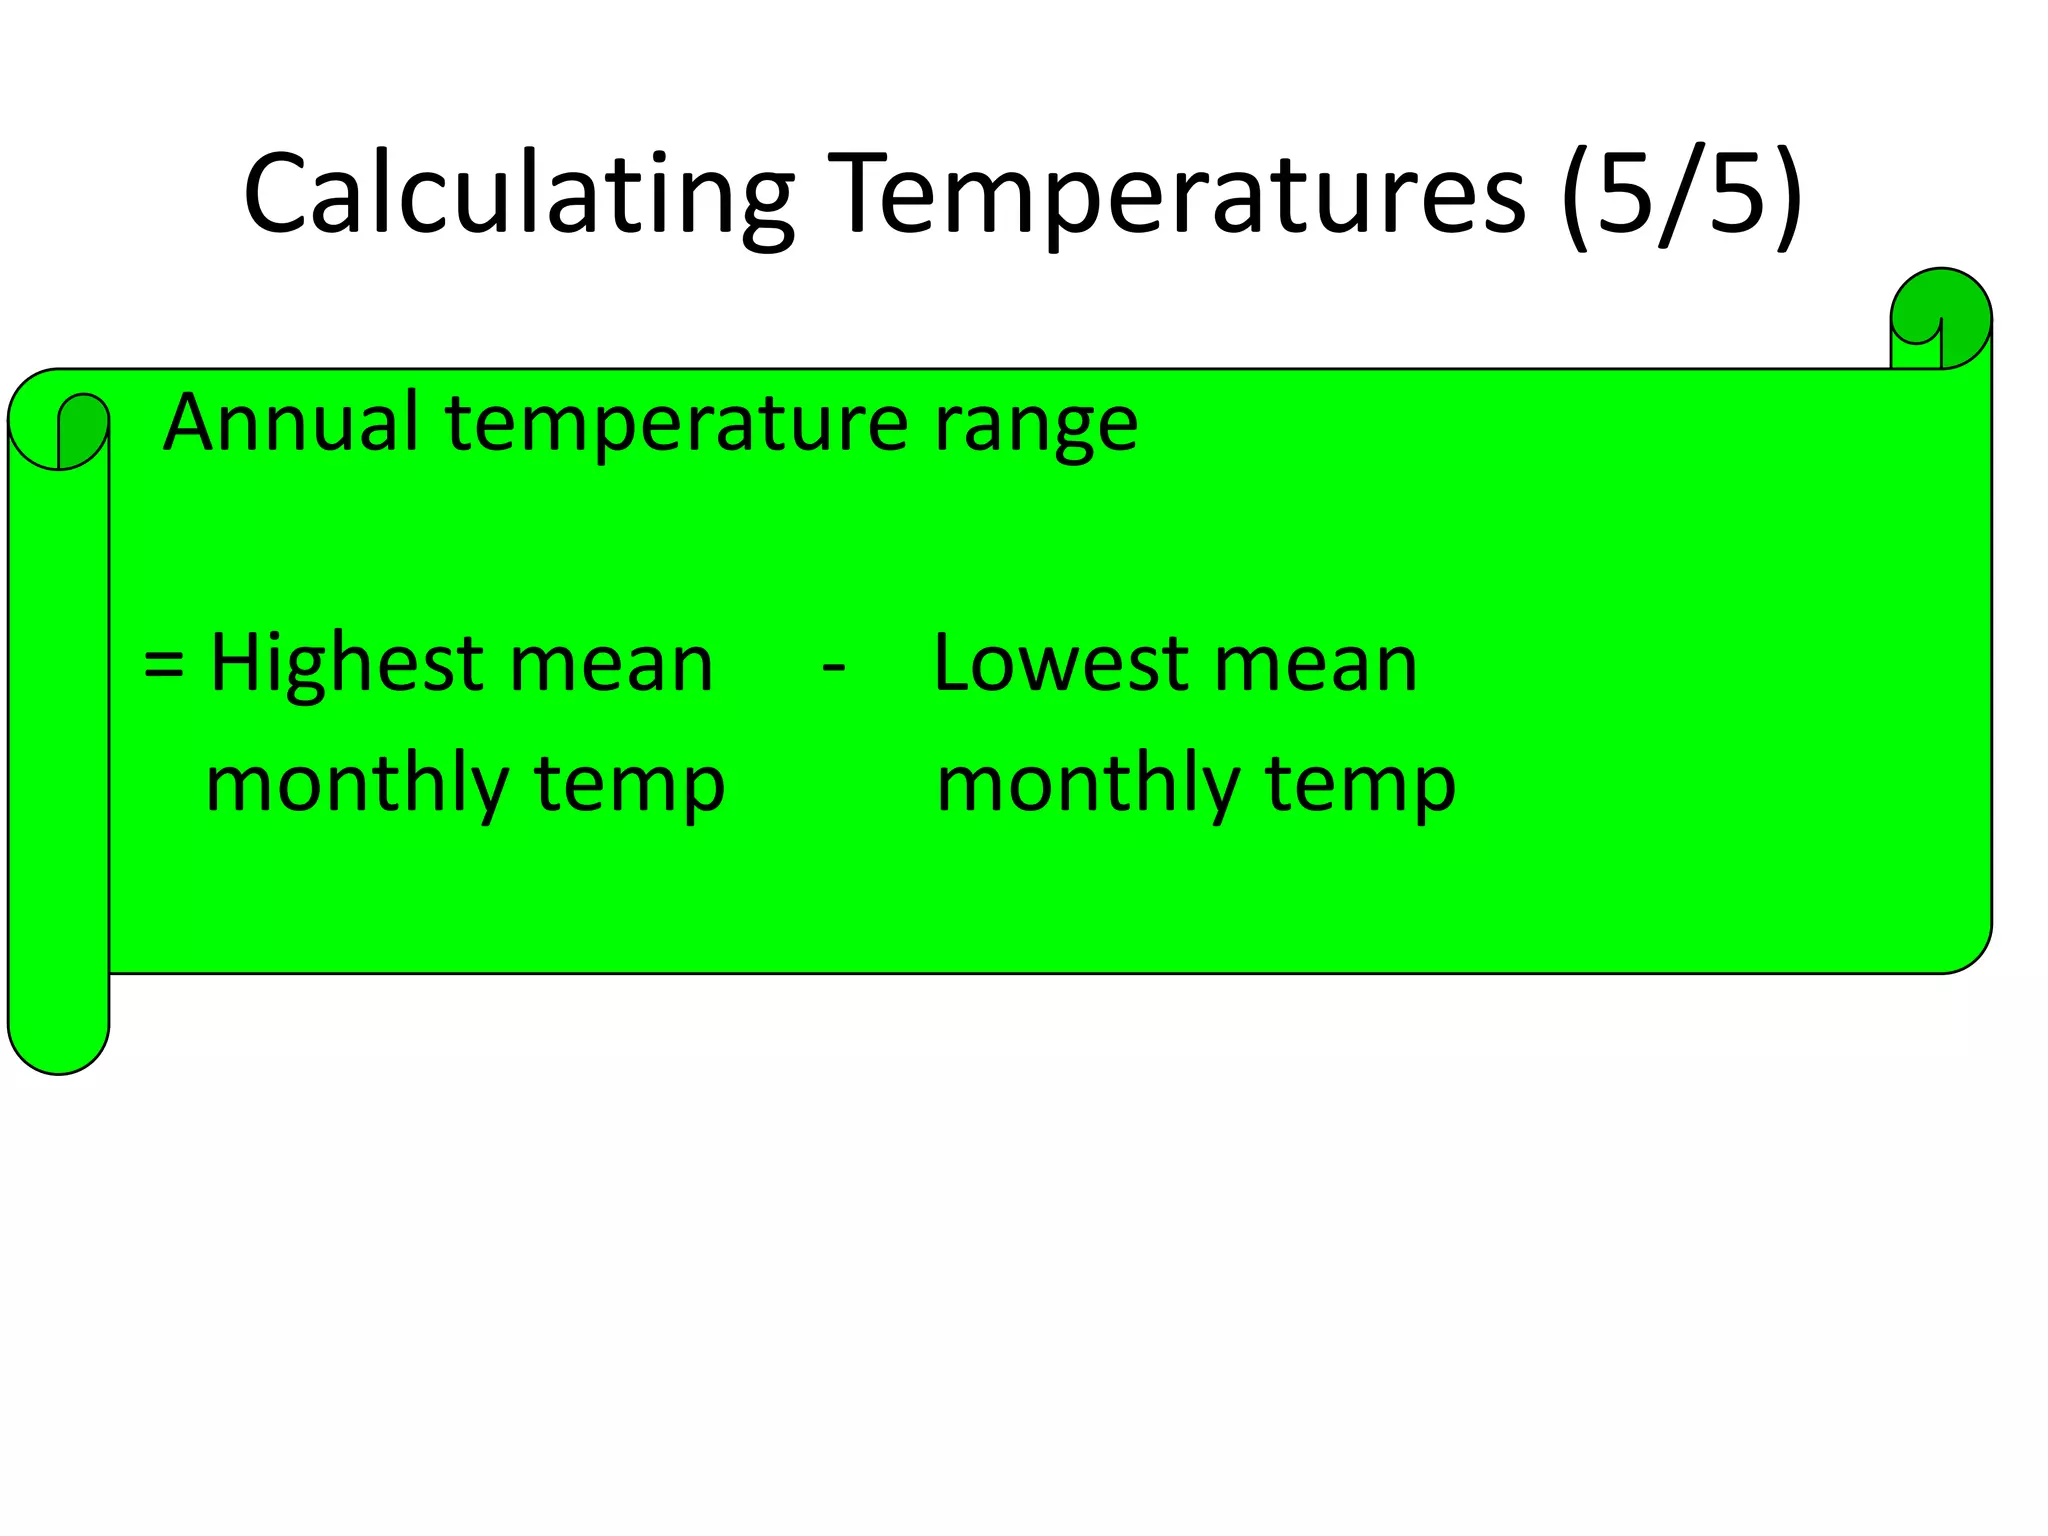
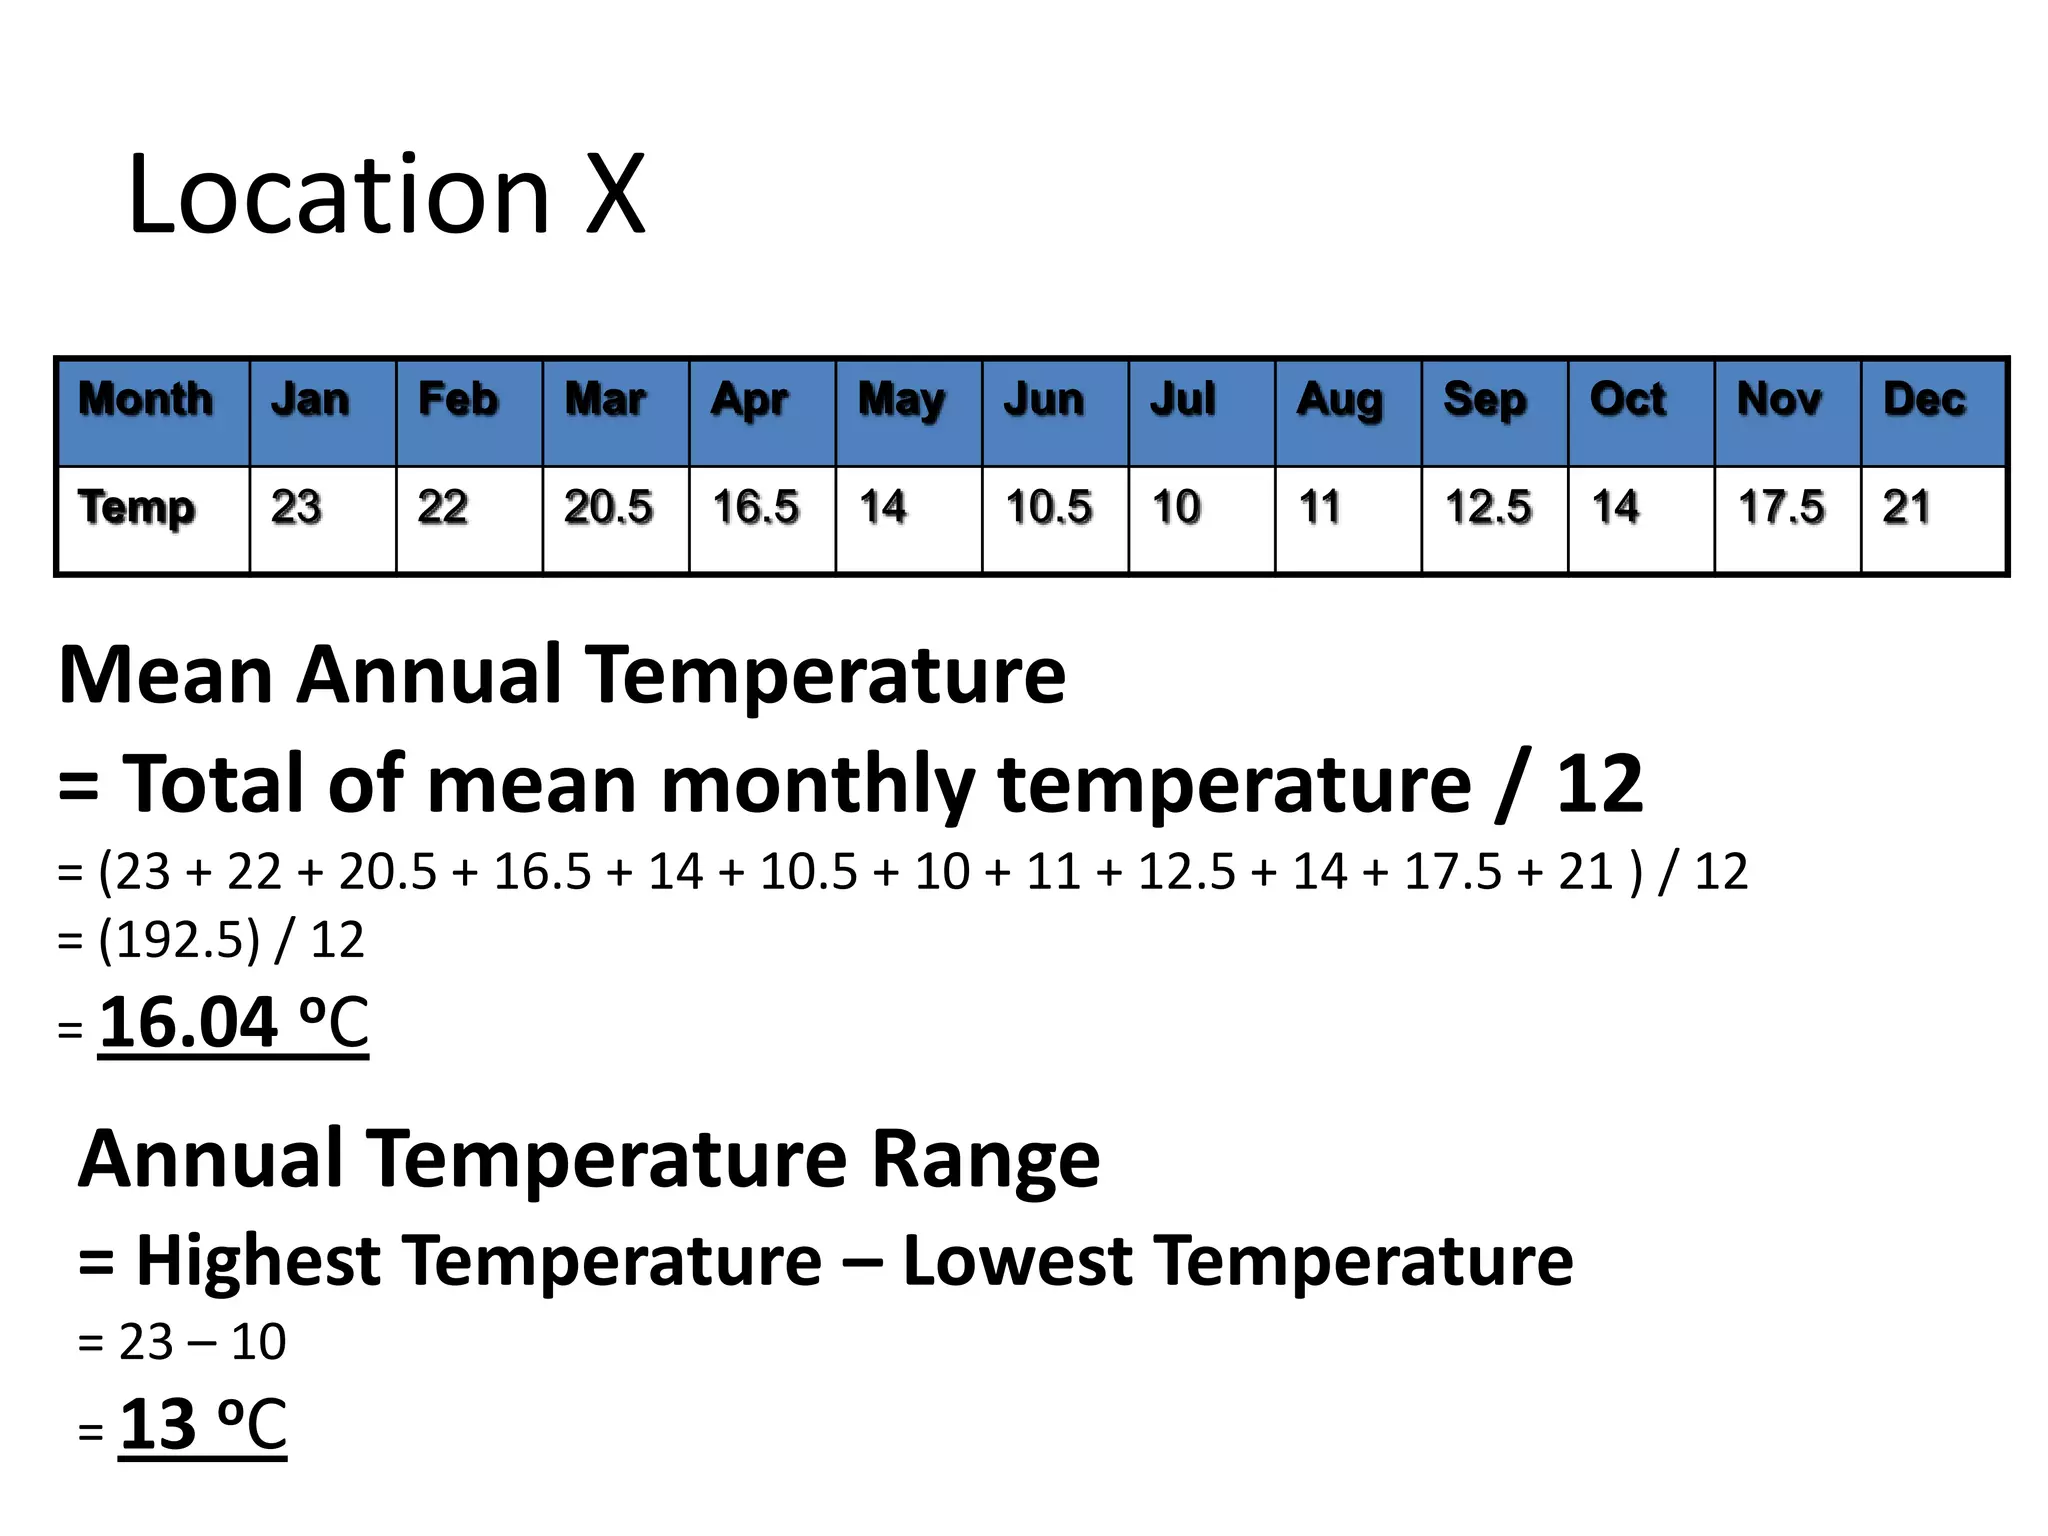
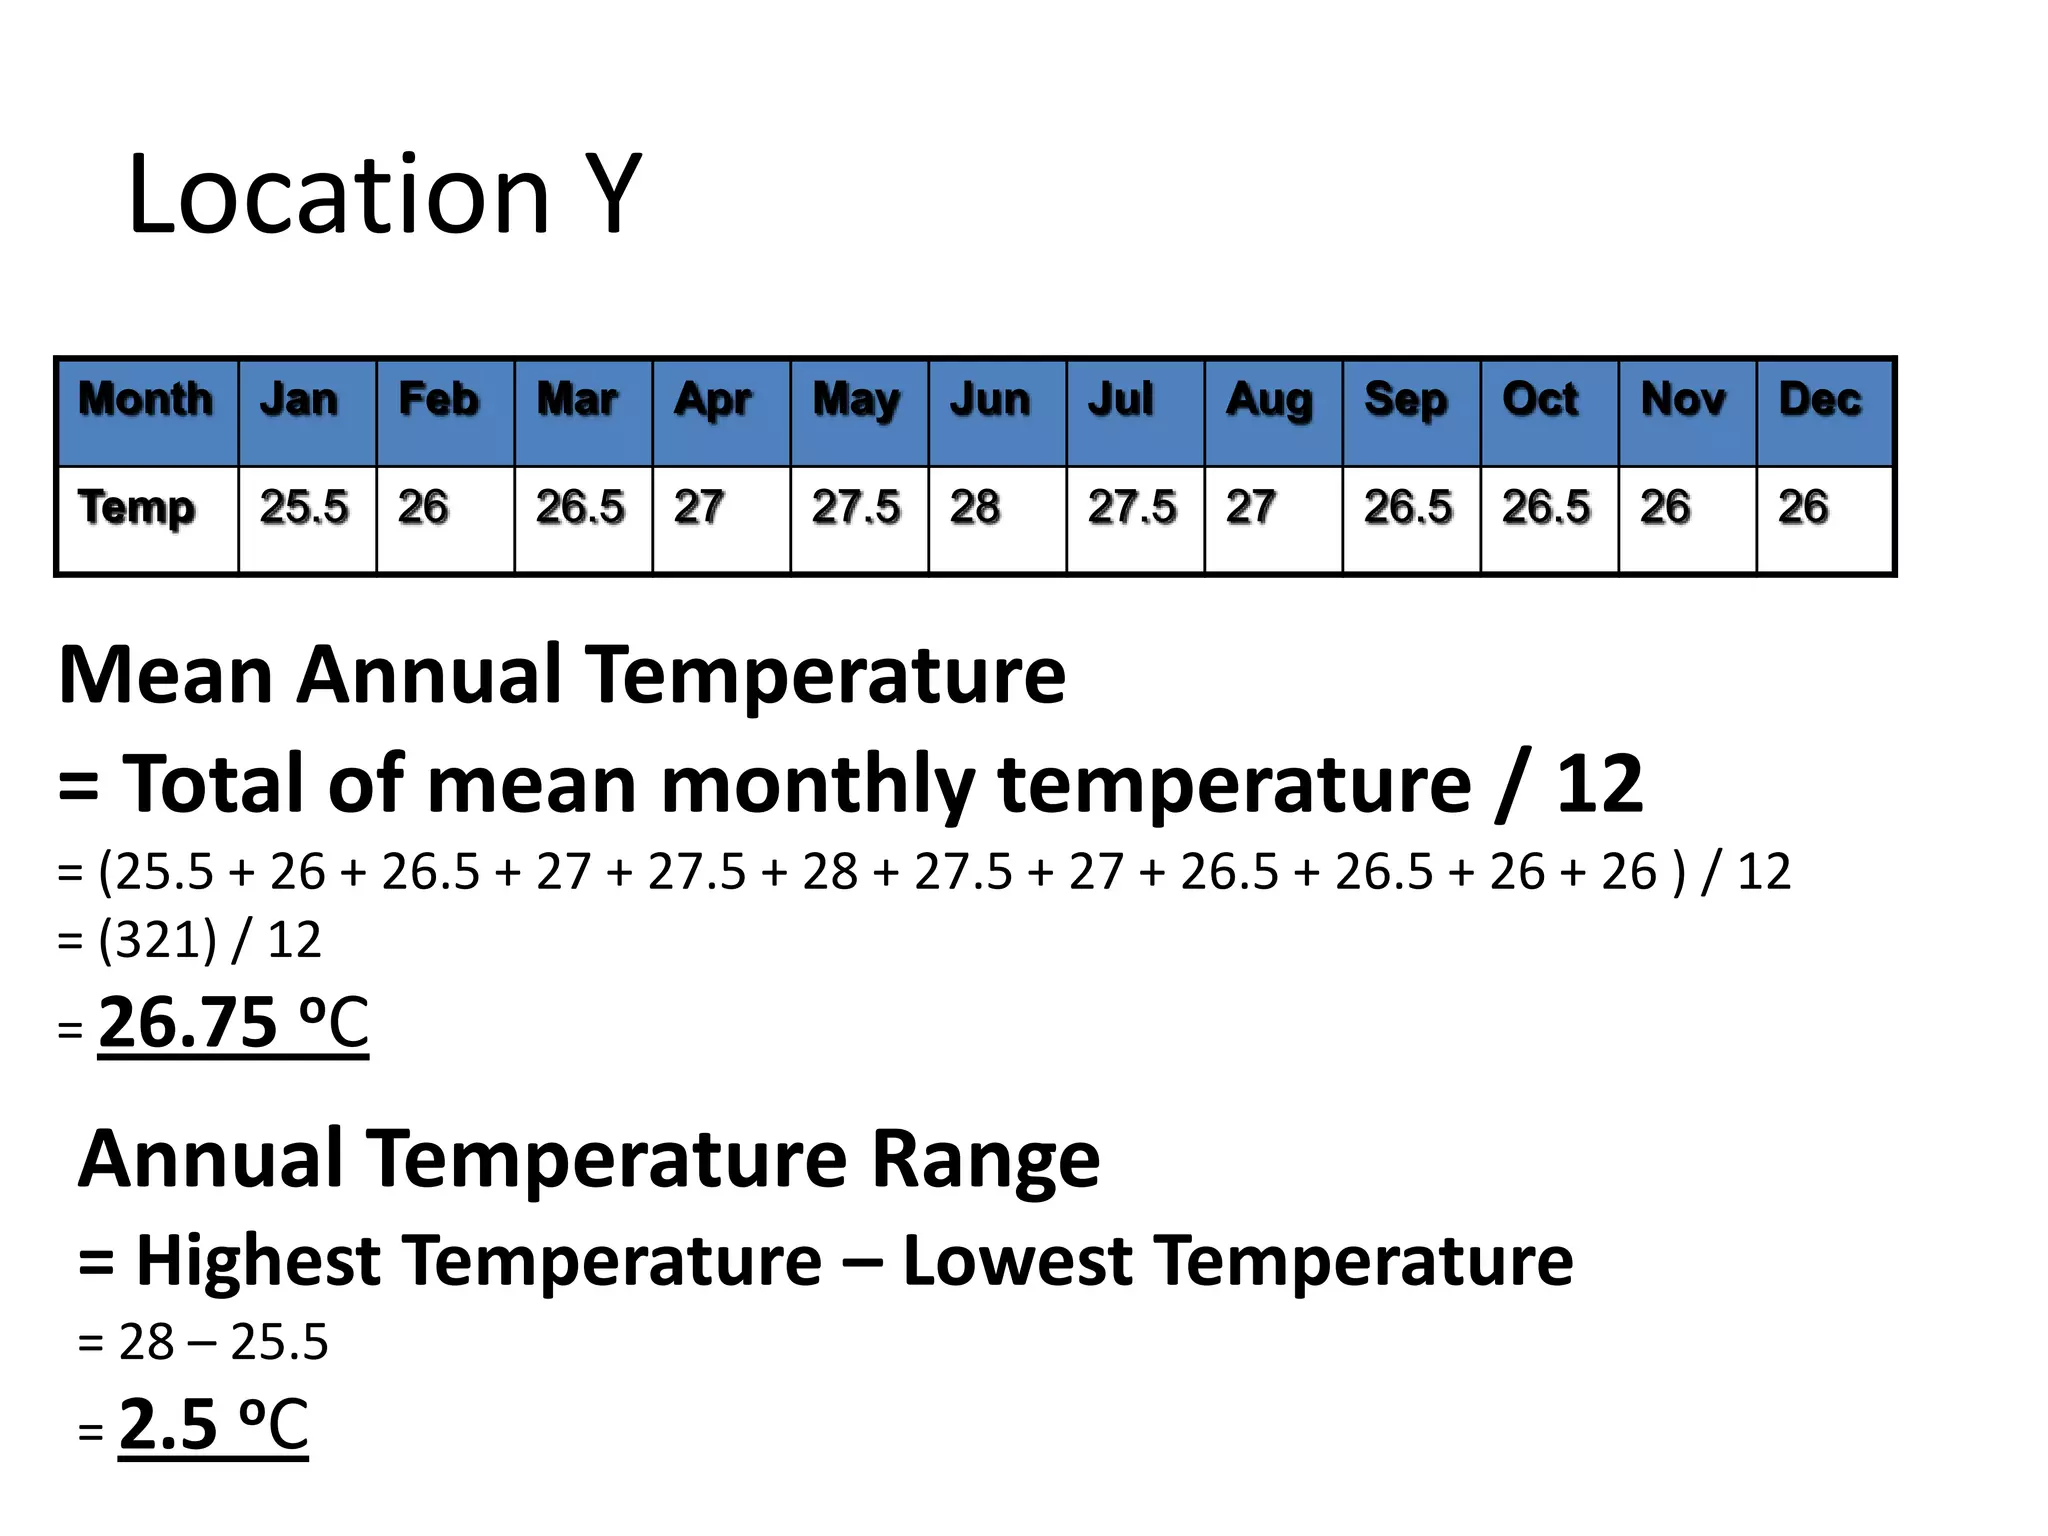
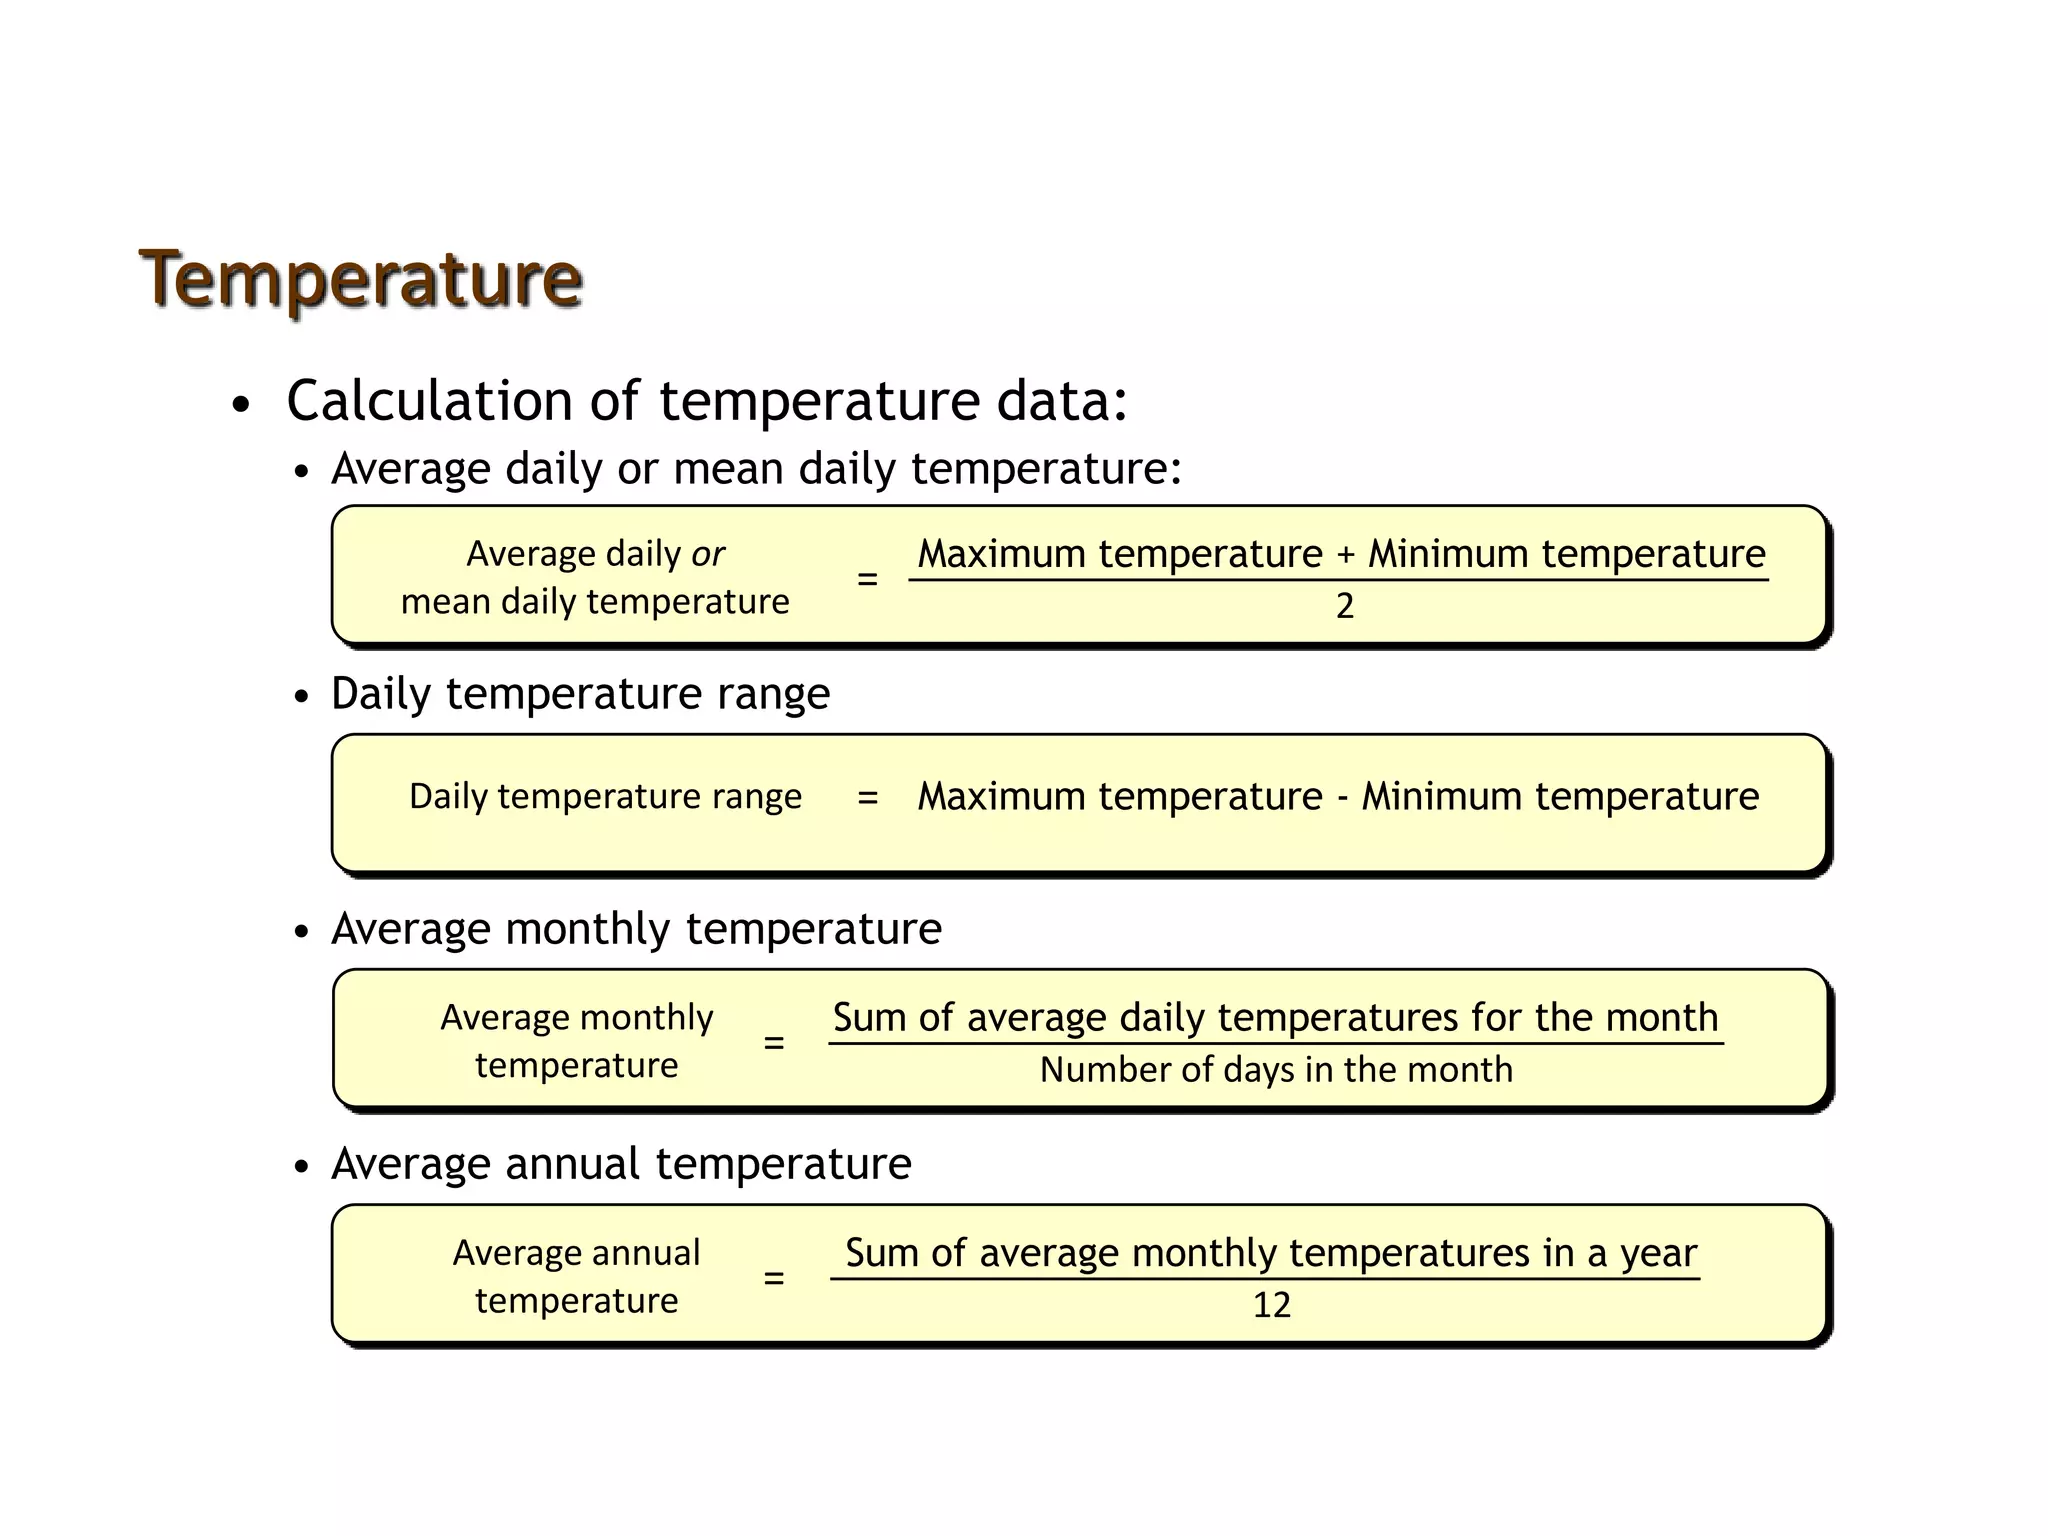
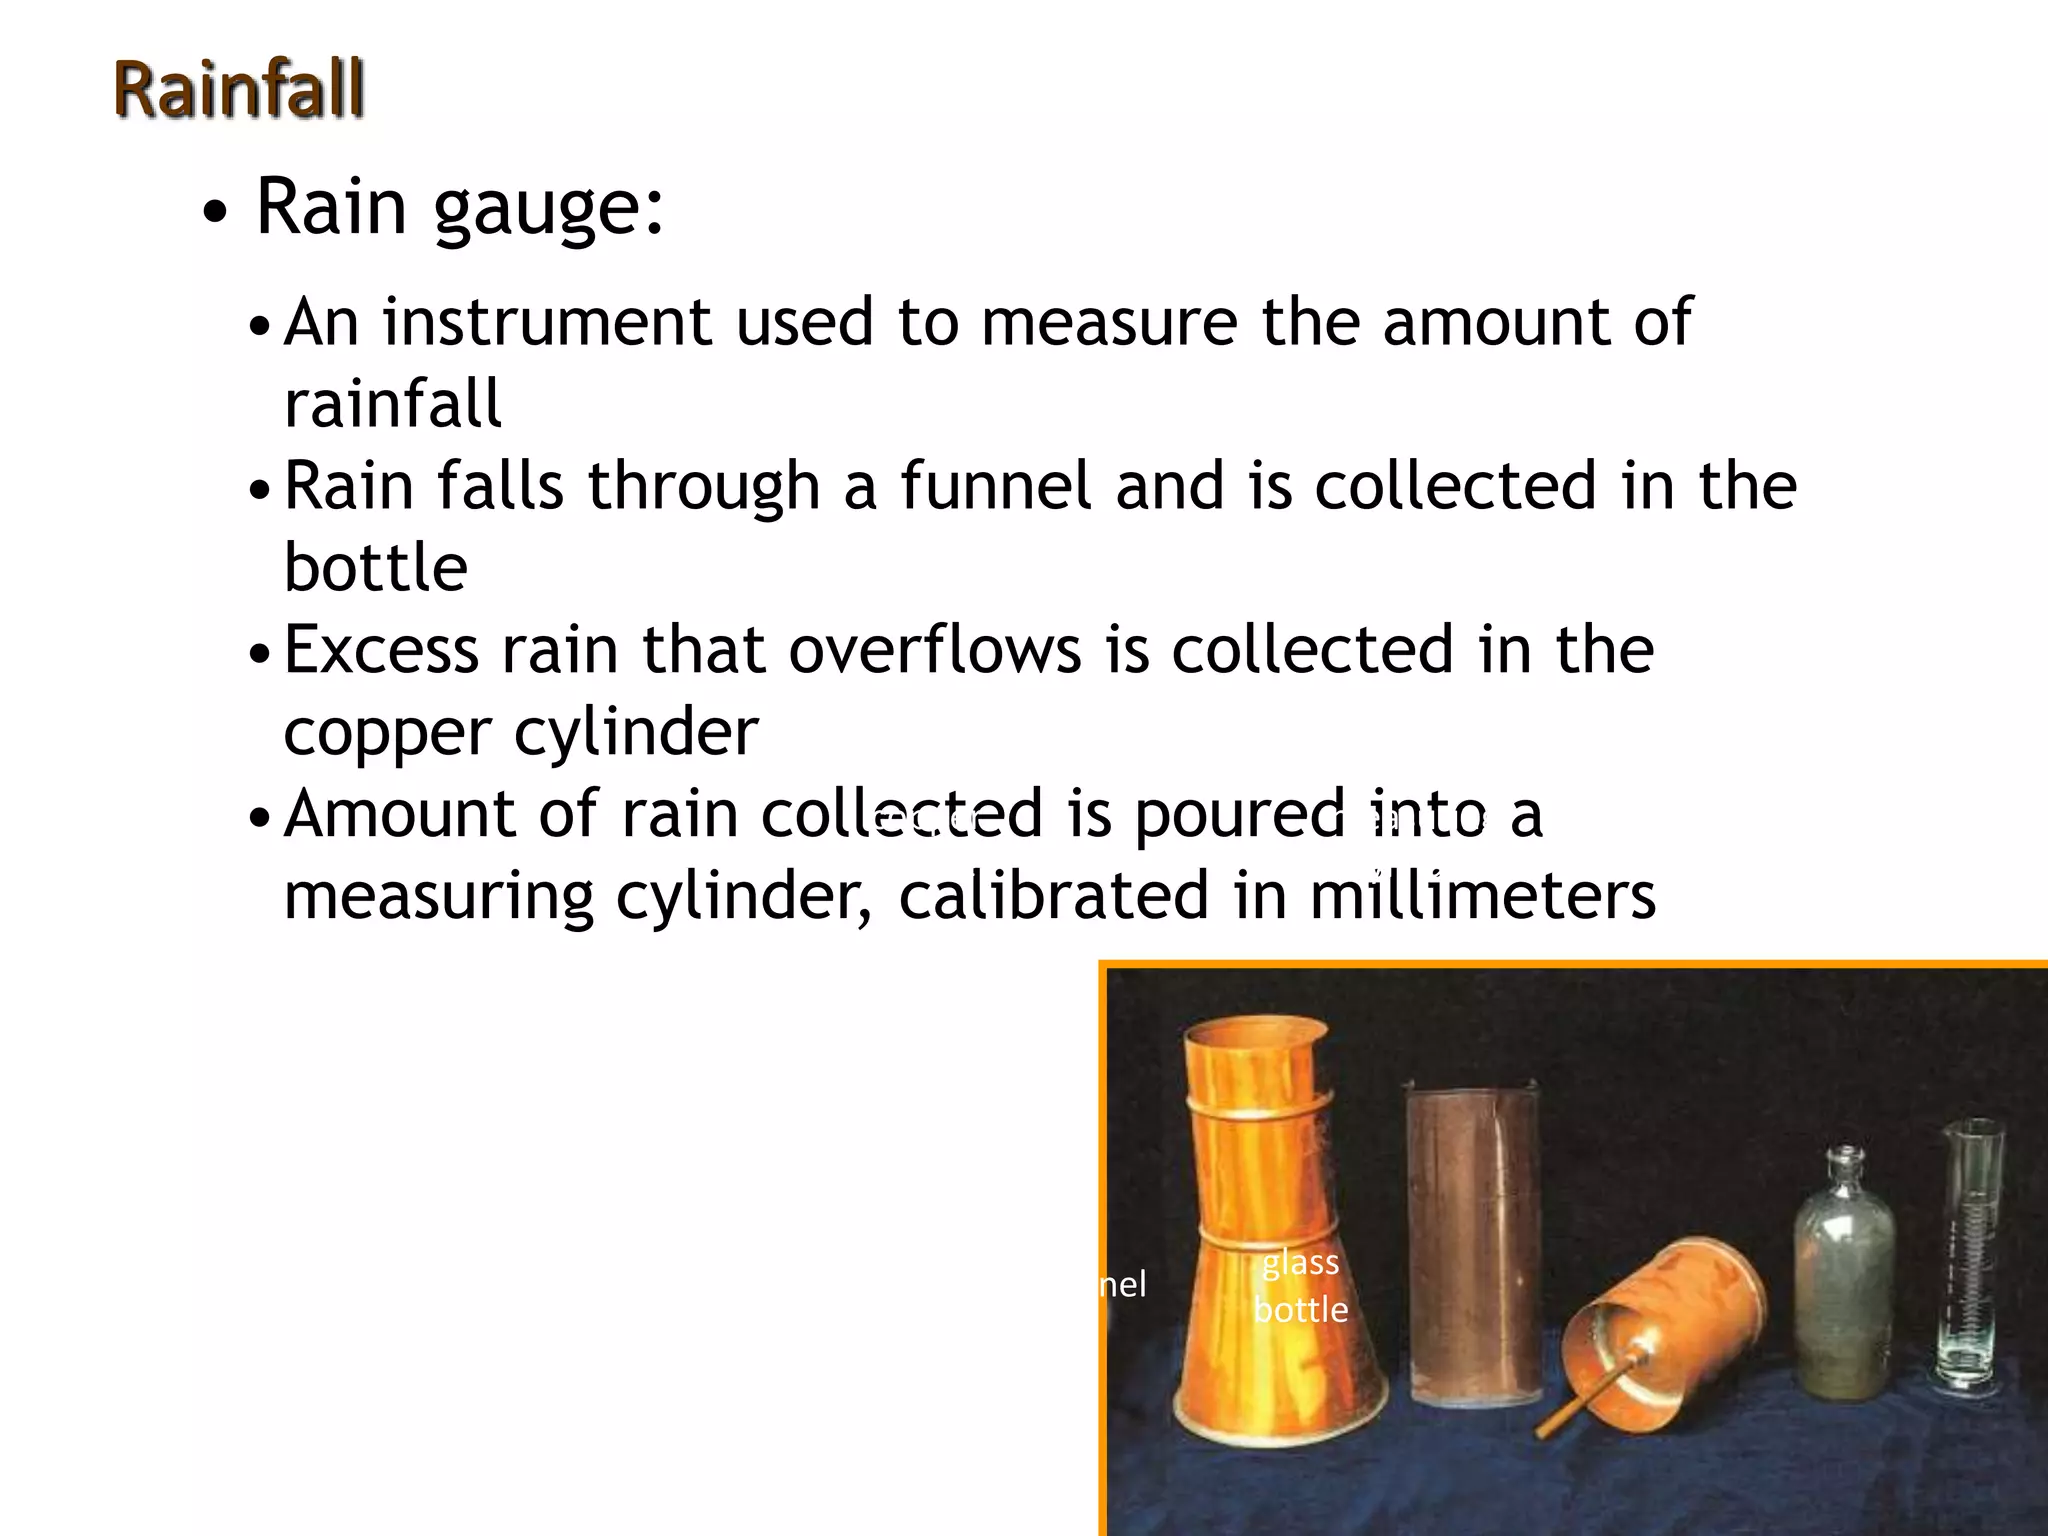
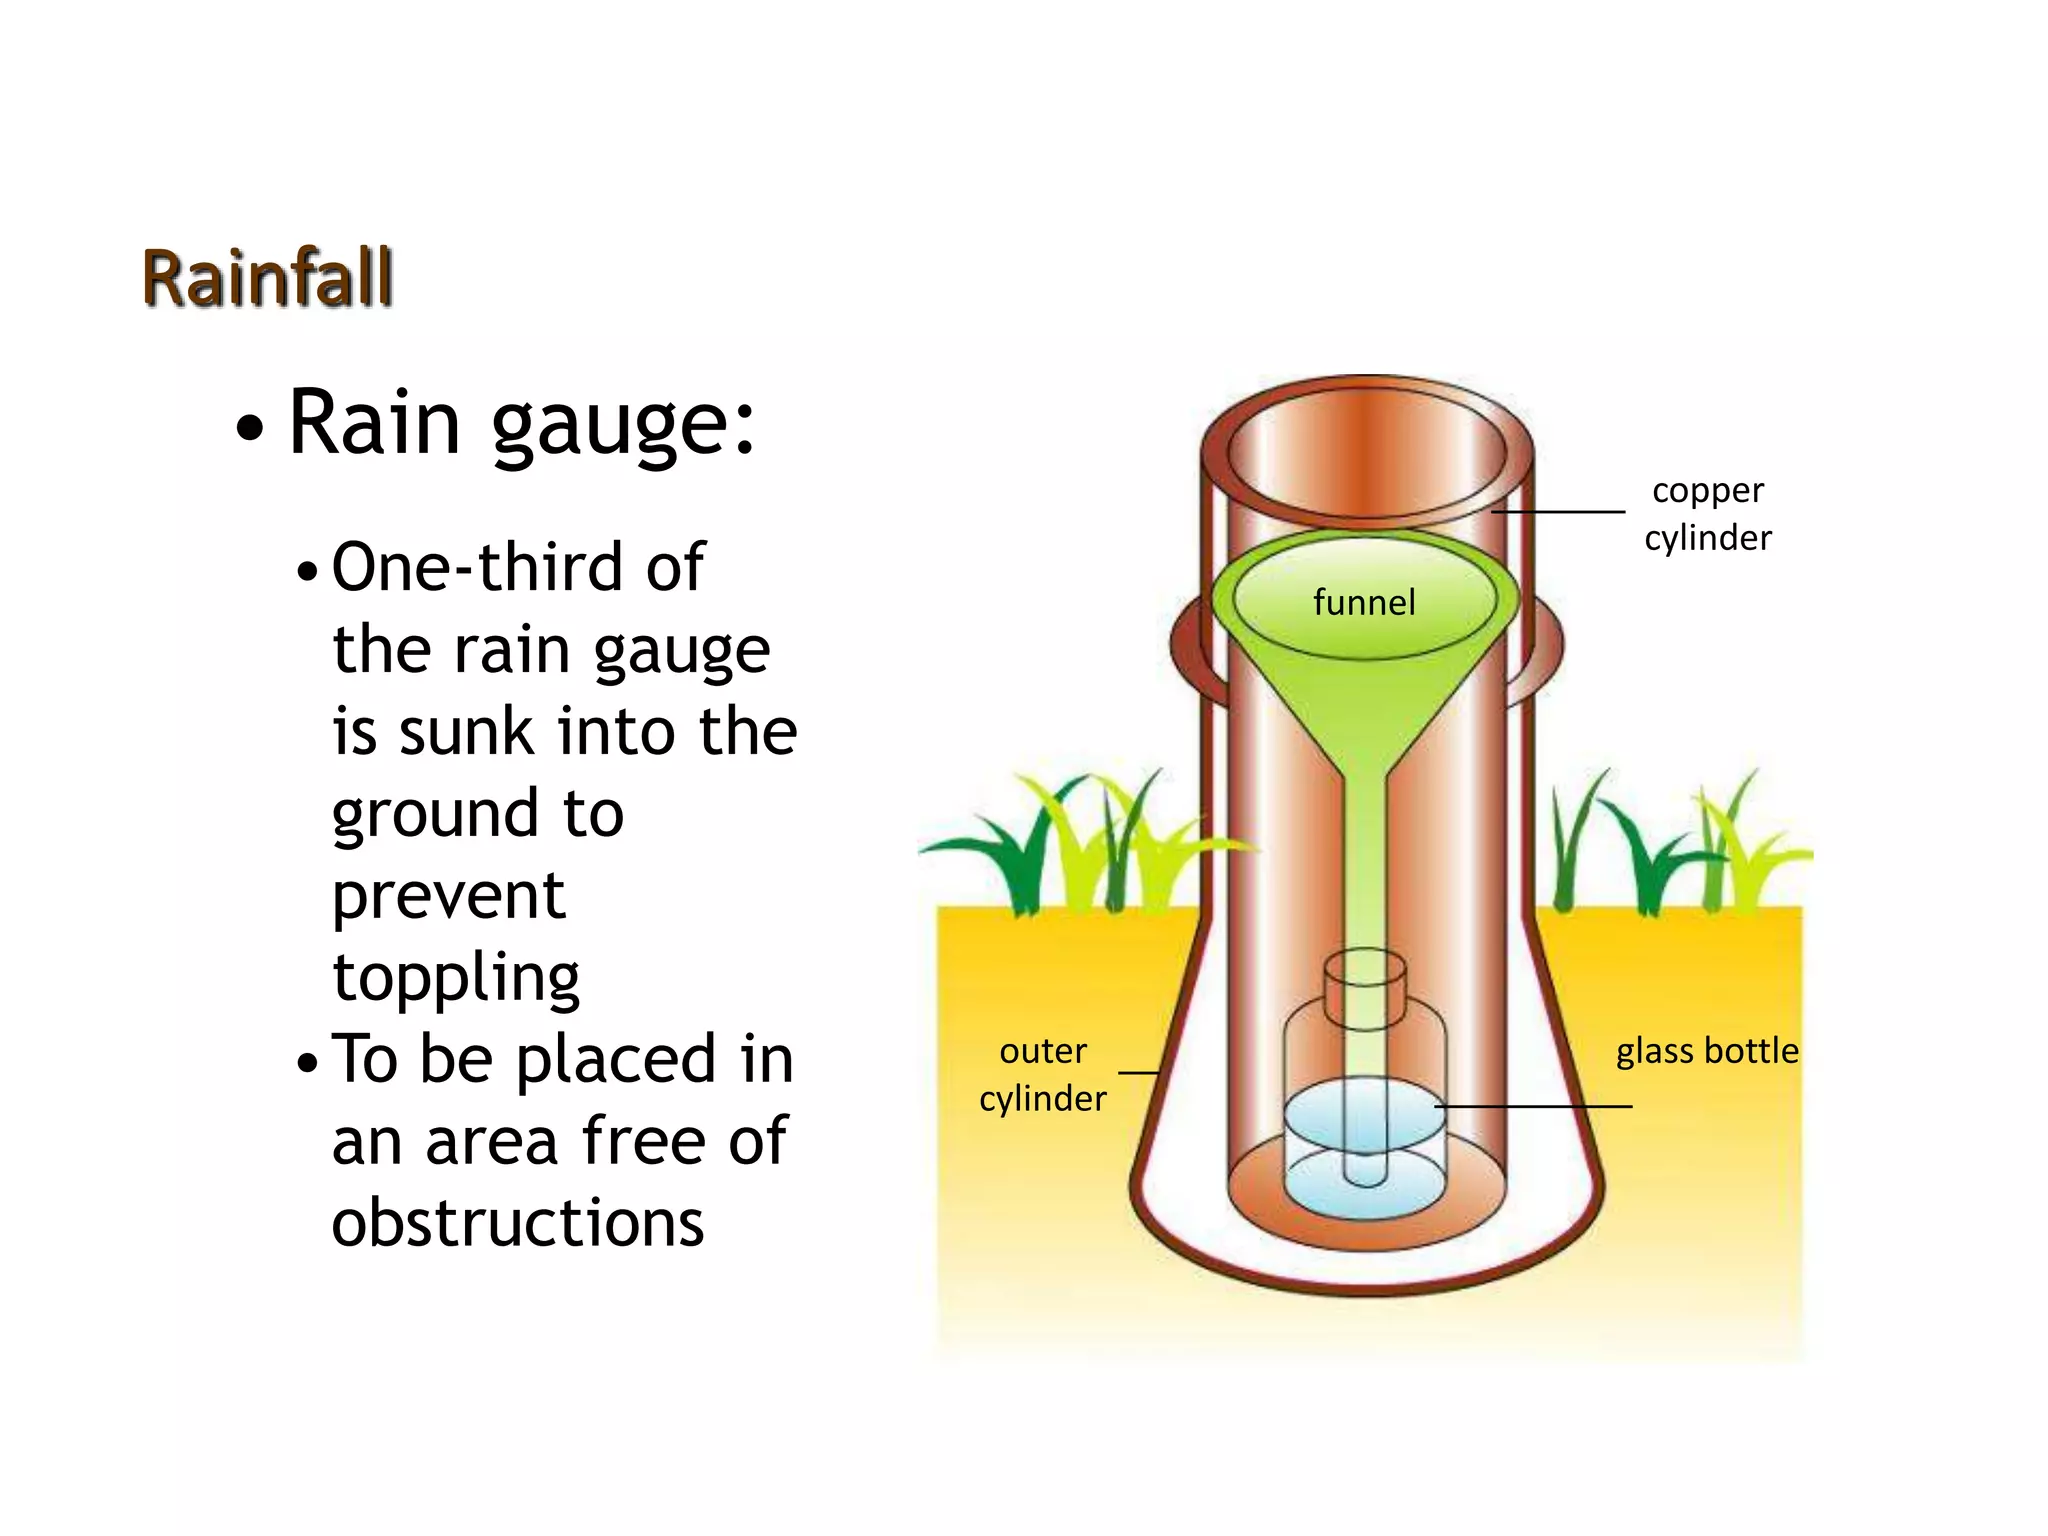
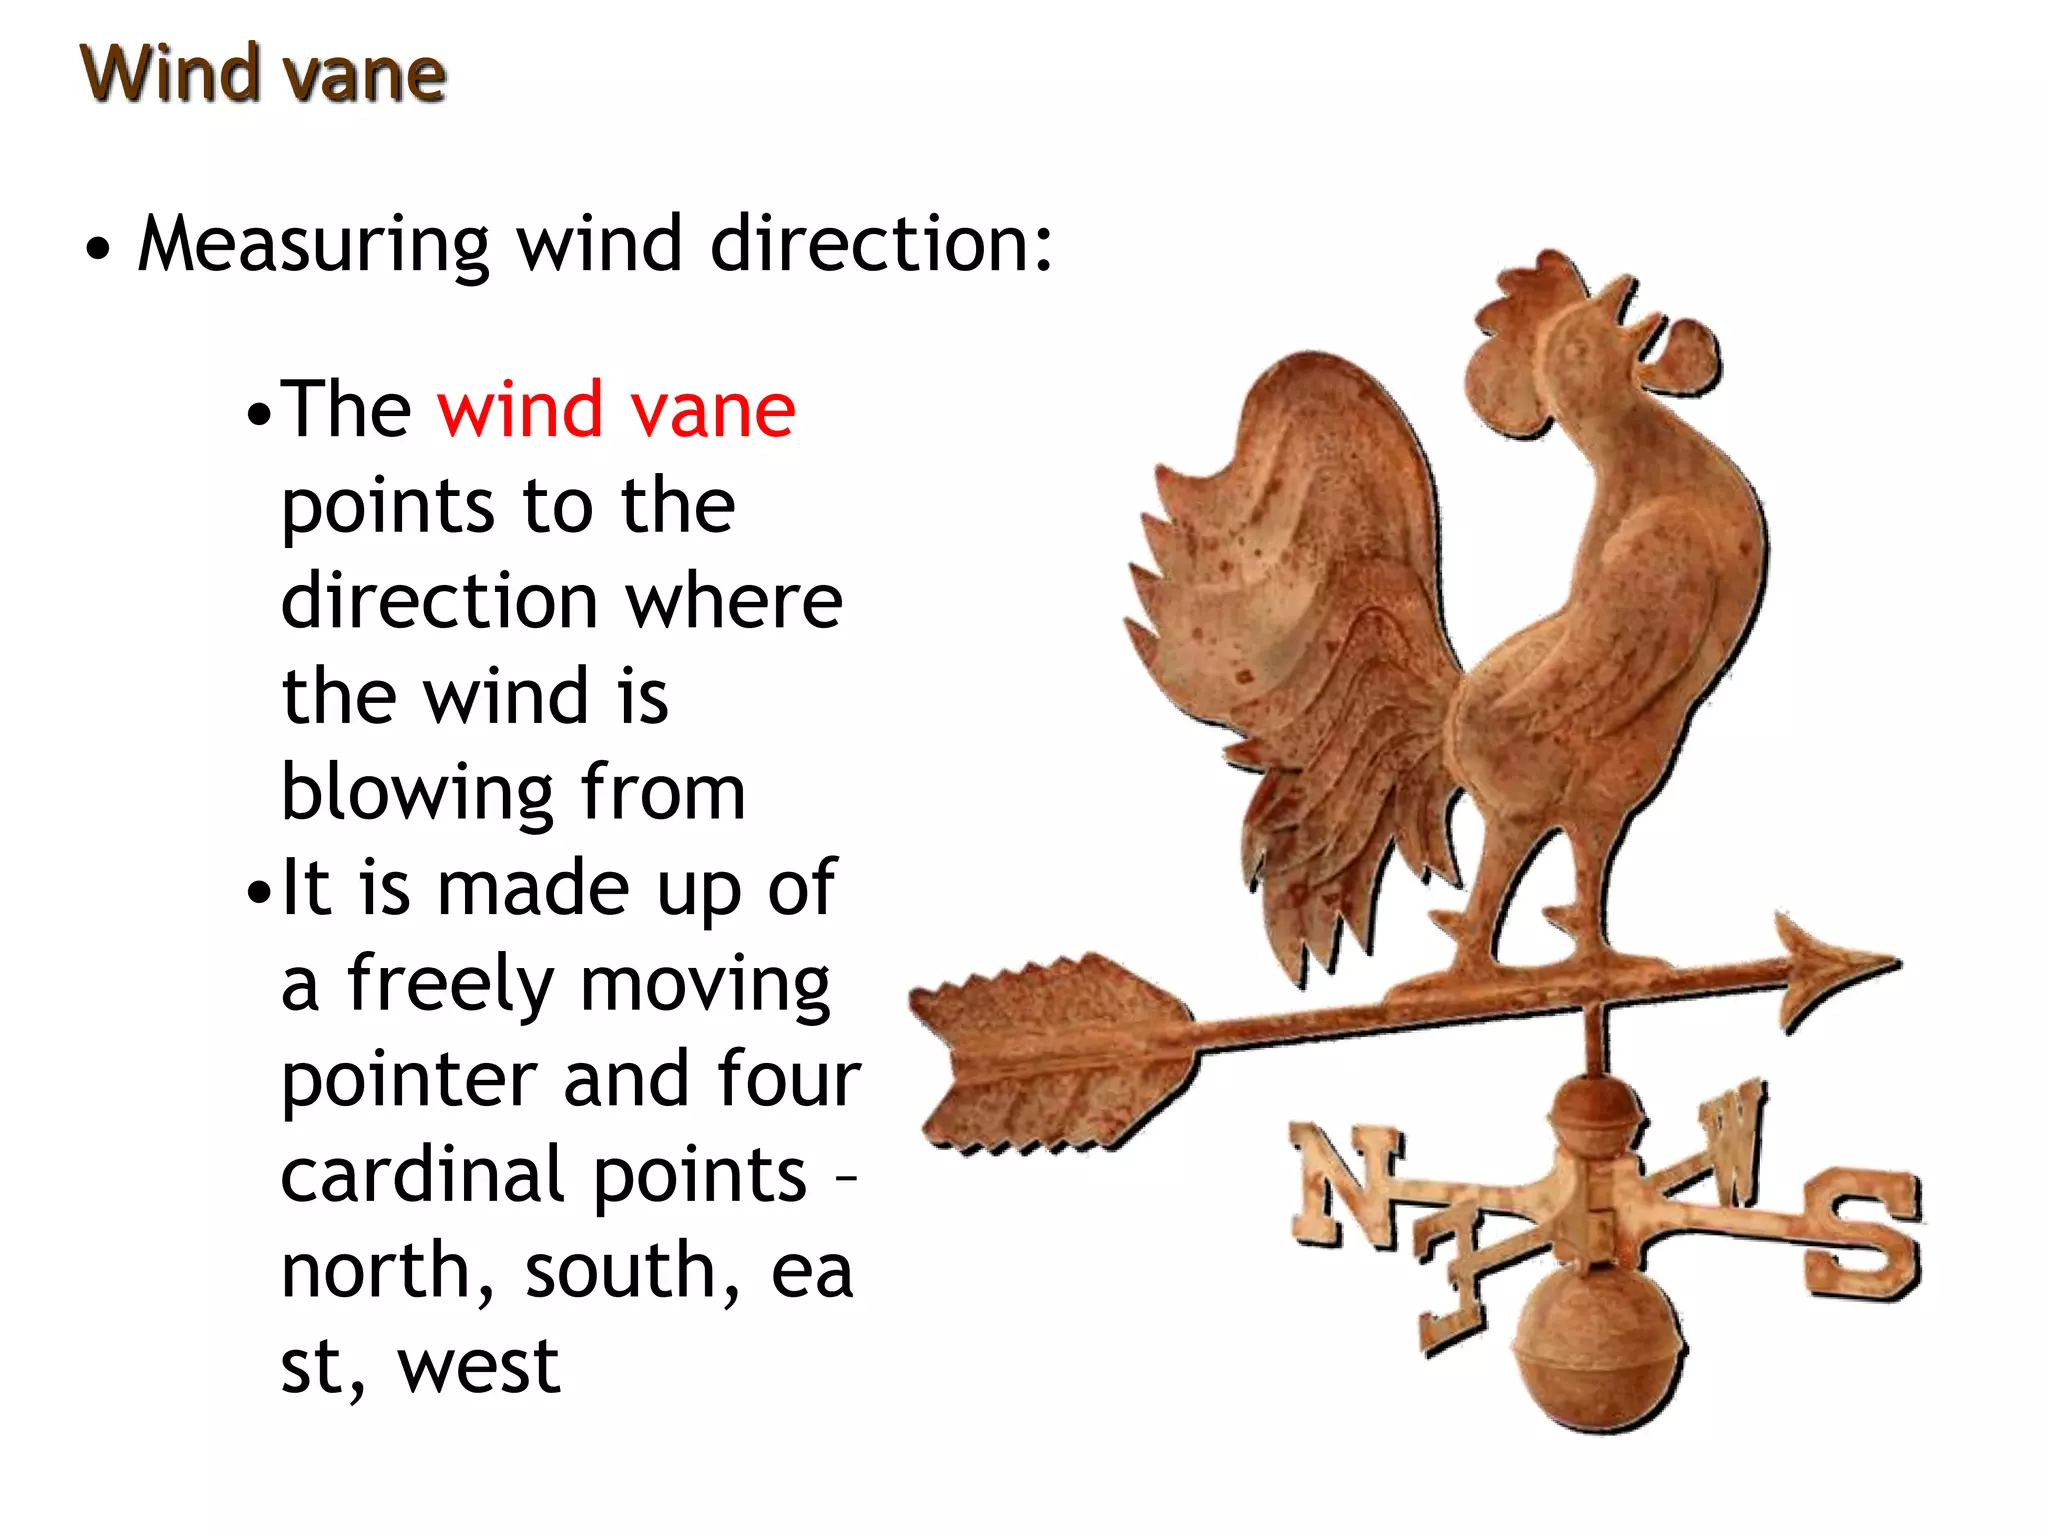
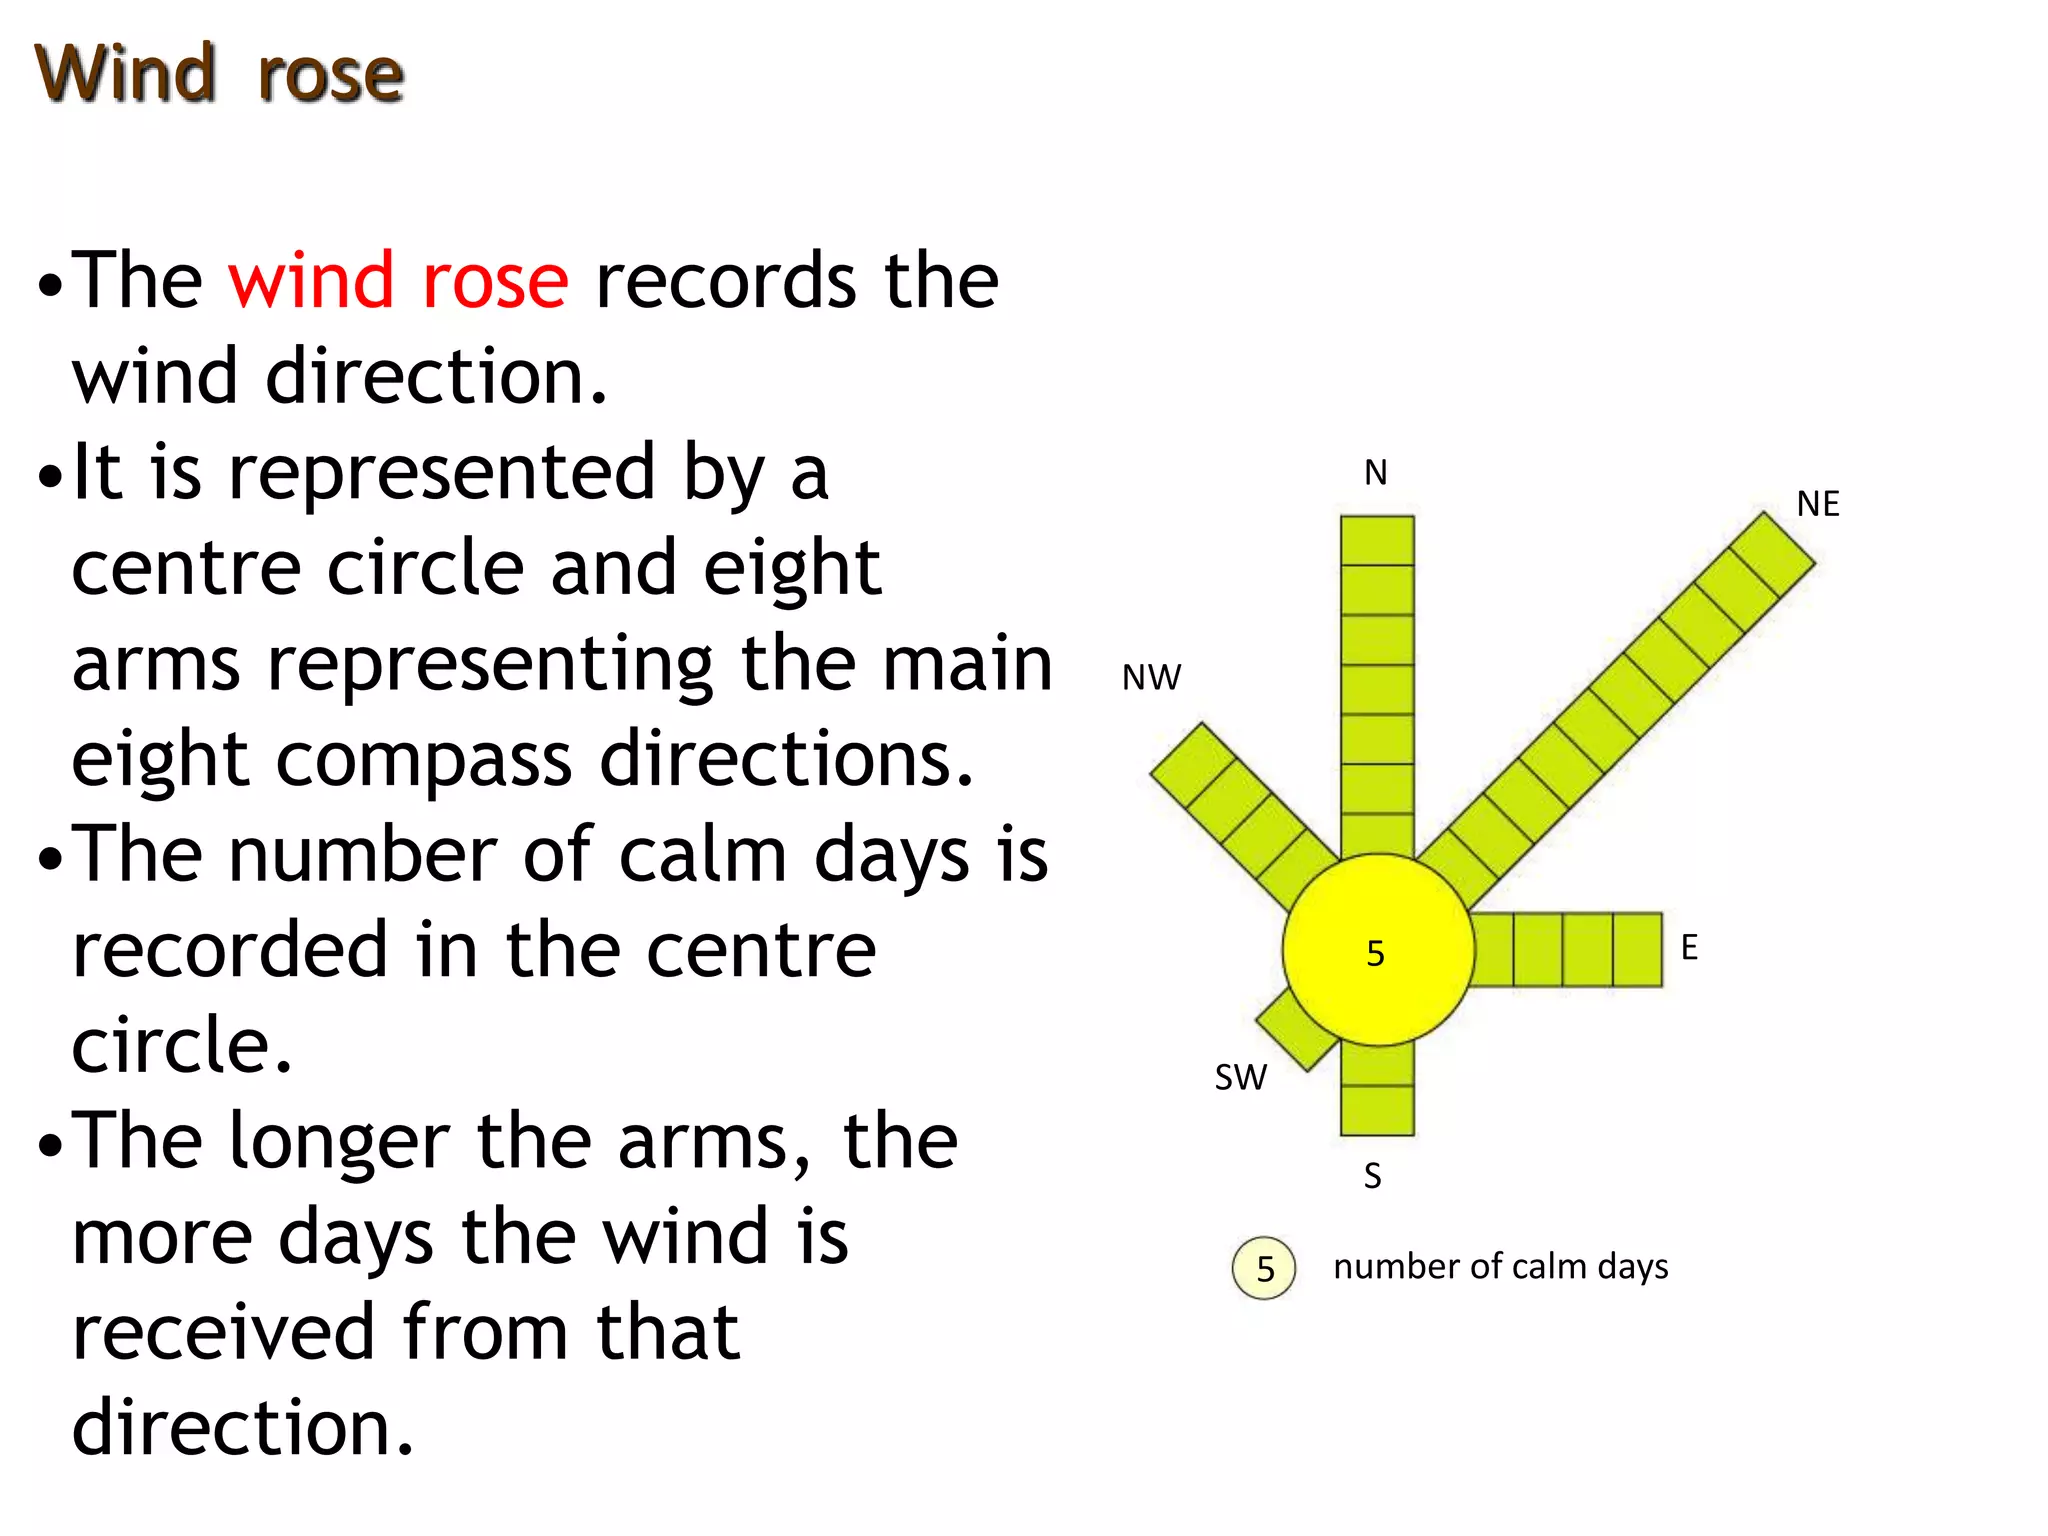
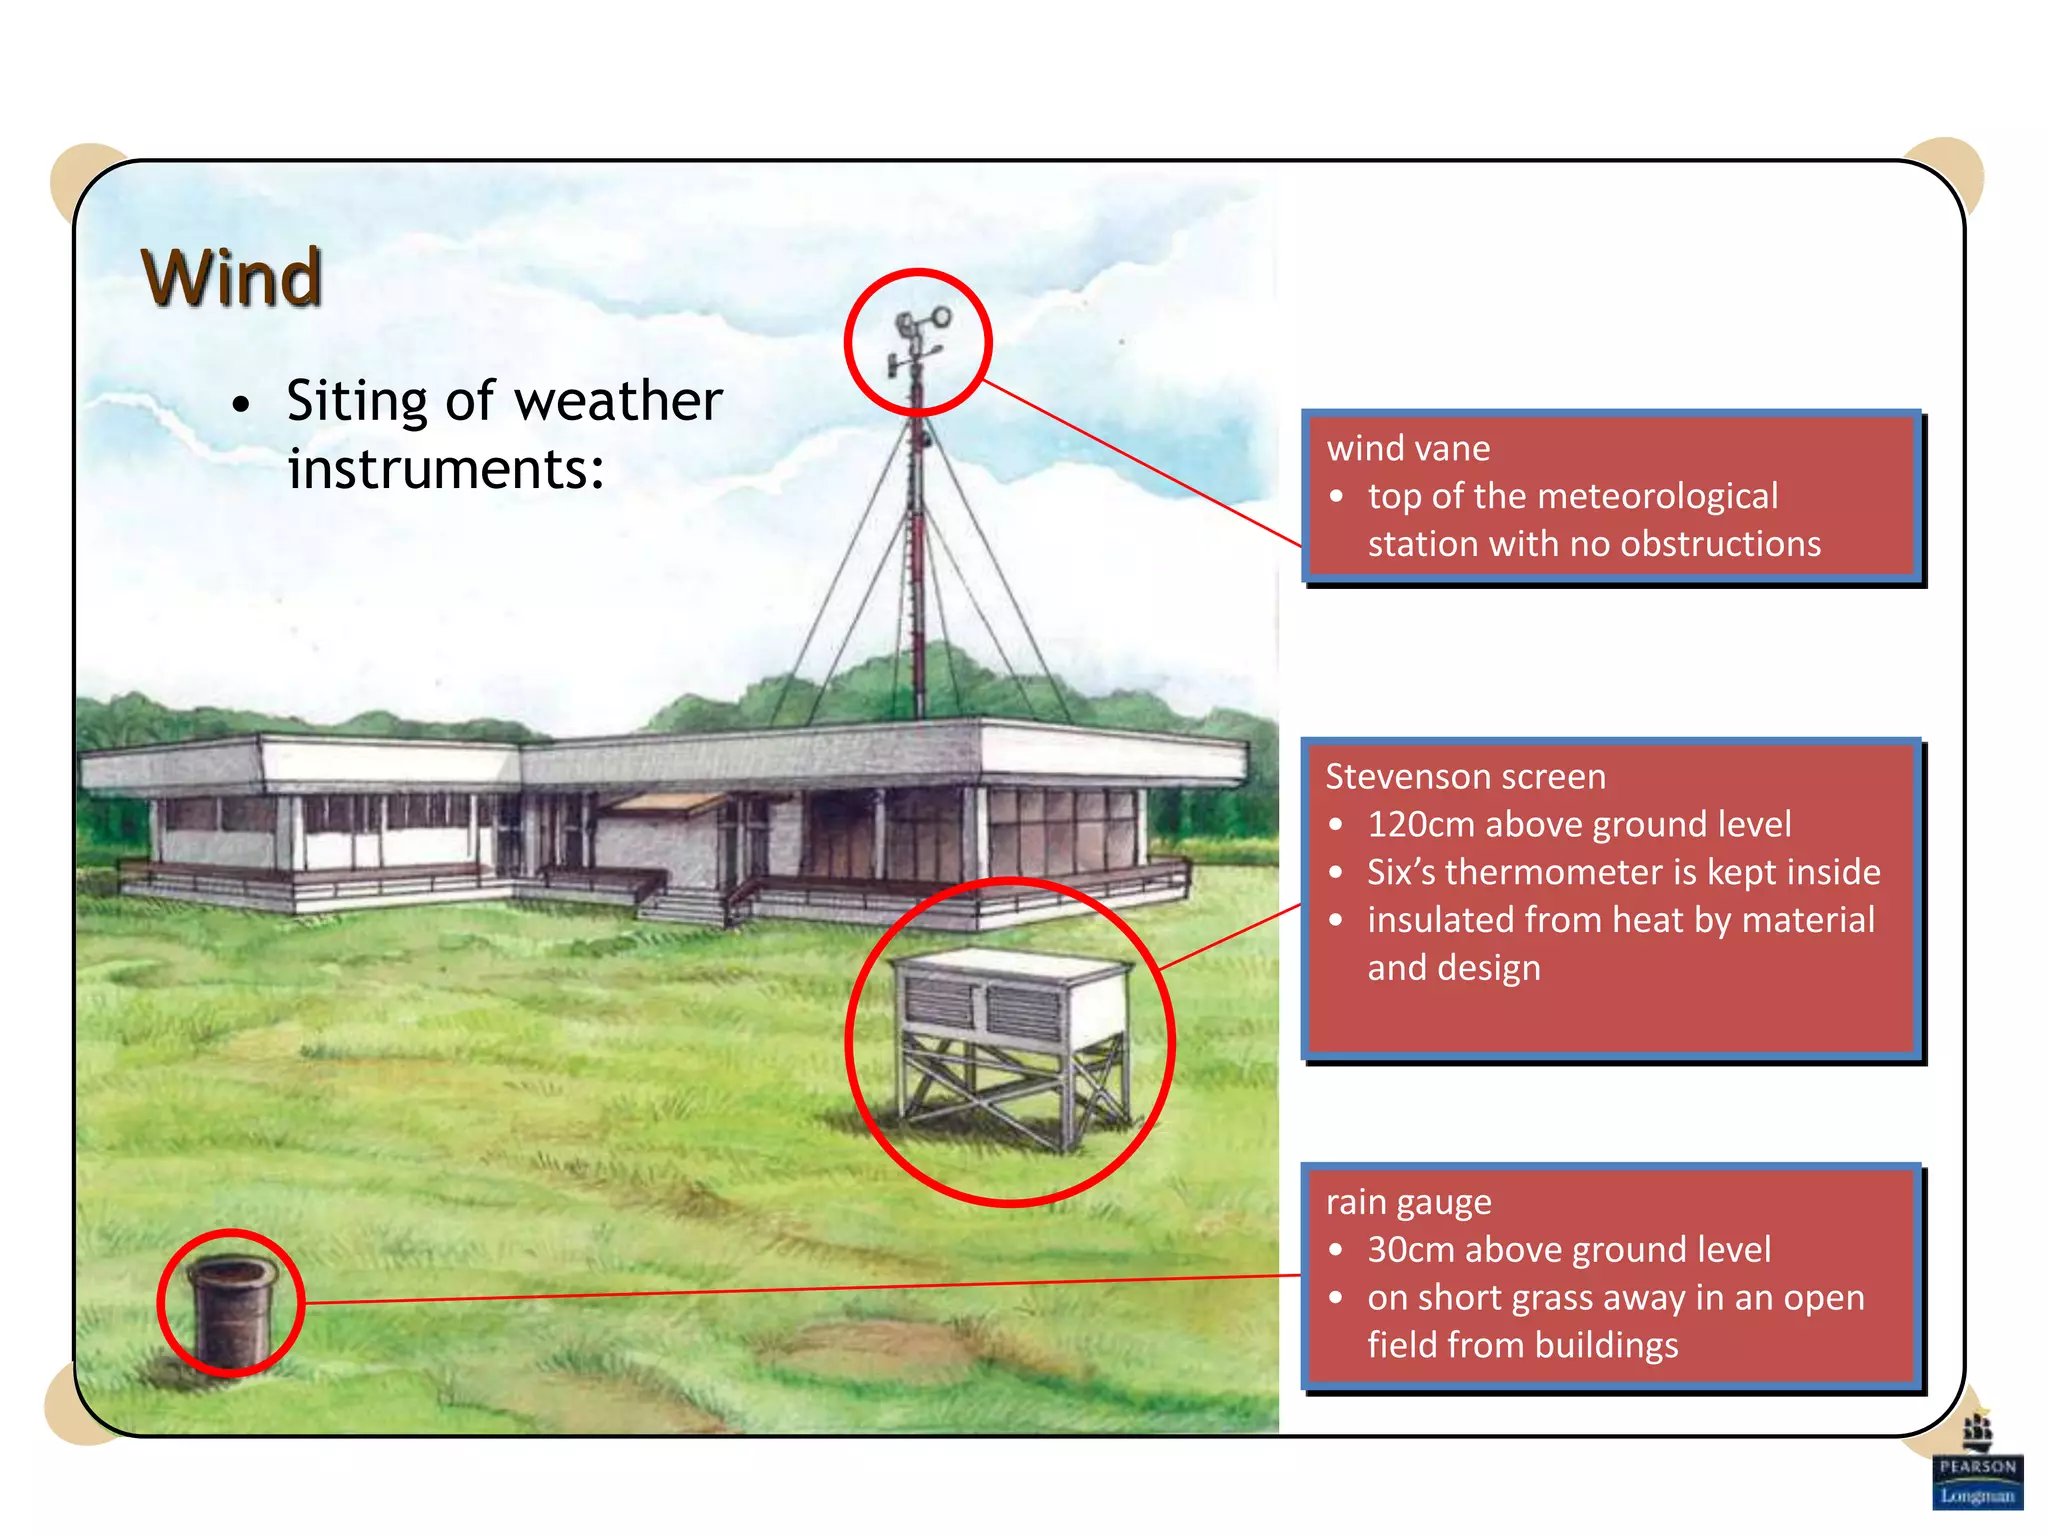
Unit 15: Weather Elements
Objectives
Differentiate between weather and climate.
Understand the use and siting of the weather
instruments.
Weather
• Weather
describes the
condition of the
atmosphere of a
place over a
short period of
time.
• Temperature, rai
nfall and wind
Climate
• Climate is the
average conditions
of the atmosphere
of a place over a
long period of time.
• Average
temperature and
average rainfall
pattern is used.
Is this weather or climate data?
Is this a weather or climate data?
Climatic maps are used to show information
such as distribution of temperature and rainfall
of a country, region or the world.
Thermometer
• Temperature refers to the degree of heat in
the air. It tells us how hot or cold the air is.
• A thermometer is used to measure
temperature in degree Celsius (◦C) or degree
Fahrenheit(◦F).
• Six’s Thermometer or the maximum and
minimum thermometer is used to record the
highest and lowest temperatures of a day.
Six’s thermometer
• Made up of Mercury and
Alcohol
• Mercury – Very high
boiling point
• Alcohol – Very low
freezing point
• Read off the base of the
Indices (Indicators)
Activity - Reading the Six’s
Max = 30 oC
Min = 5 oC
Mercury
Metal
Indices
Alcohol
Max = 20 oC
Min = 10 oC
Max = 7.5 oC
Min = -15 oC
Stevenson Screen
• The Six’s thermometers are placed in a
white, wooden box called a Stevenson Screen.
• White wooden box to reflect heat
• Louvred sides to allow air to flow freely
• Doubled layered roof to prevent direct heating
from the sun
• Stand on stilts to prevent heat from the
ground to be trapped
Calculating Temperatures (1/5)
Daily temperature Range
= Maximum Temp - Minimum Temp
For example
Max temp = 30 oC Min Temp = 10 oC
Daily temp range = 20 oC
Calculating Temperatures (2/5)
Mean (average) daily temperature
= Maximum Temp + Minimum Temp
2
For example
Max temp = 30◦C Min Temp = 10◦C
Average daily temp= (30+10)/2
= 20◦C
Calculating Temperatures (3/5)
Mean (average) monthly temperature
= Total average daily temp for the month
Number of days in the month
Calculating Temperatures (3/5)
Mean (average) monthly temperature
= Average max temp + Average min temp
2
Only used this when
average maximum and
average minimum
temperature are given.
Calculating Temperatures (4/5)
Mean (average) Annual temperature
= Total average monthly temp in a year
12
Calculating Temperatures (5/5)
Annual temperature range
= Highest mean - Lowest mean
monthly temp monthly temp
Location X
Month Jan Feb Mar Apr May Jun Jul Aug Sep Oct Nov Dec
Temp 23 22 20.5 16.5 14 10.5 10 11 12.5 14 17.5 21
Mean Annual Temperature
= Total of mean monthly temperature / 12
= (23 + 22 + 20.5 + 16.5 + 14 + 10.5 + 10 + 11 + 12.5 + 14 + 17.5 + 21 ) / 12
= (192.5) / 12
= 16.04 oC
Annual Temperature Range
= Highest Temperature – Lowest Temperature
= 23 – 10
= 13 oC
Location Y
Month Jan Feb Mar Apr May Jun Jul Aug Sep Oct Nov Dec
Temp 25.5 26 26.5 27 27.5 28 27.5 27 26.5 26.5 26 26
Mean Annual Temperature
= Total of mean monthly temperature / 12
= (25.5 + 26 + 26.5 + 27 + 27.5 + 28 + 27.5 + 27 + 26.5 + 26.5 + 26 + 26 ) / 12
= (321) / 12
= 26.75 oC
Annual Temperature Range
= Highest Temperature – Lowest Temperature
= 28 – 25.5
= 2.5 oC
• Average daily or mean daily temperature:
• Calculation of temperature data:
Temperature
Average daily or
mean daily temperature
Maximum temperature + Minimum temperature
2
=
Daily temperature range Maximum temperature - Minimum temperature=
Average monthly
temperature
Sum of average daily temperatures for the month
Number of days in the month
=
Average annual
temperature
Sum of average monthly temperatures in a year
12
=
• Daily temperature range
• Average monthly temperature
• Average annual temperature
•An instrument used to measure the amount of
rainfall
•Rain falls through a funnel and is collected in the
bottle
•Excess rain that overflows is collected in the
copper cylinder
•Amount of rain collected is poured into a
measuring cylinder, calibrated in millimeters
• Rain gauge:
Rainfall
outer cylinder funnel
glass
bottle
measuring
cylinder
copper
cylinder
•One-third of
the rain gauge
is sunk into the
ground to
prevent
toppling
•To be placed in
an area free of
obstructions
•Rain gauge:
Rainfall
copper
cylinder
funnel
glass bottleouter
cylinder
Calculating Rainfall (1/4)
Daily rainfall
= Sum of all rainfall readings in a day
Calculating Rainfall (2/4)
Monthly rainfall
= Sum of all daily rainfall readings in a
month
Calculating Rainfall (3/4)
Total annual rainfall
= Sum of the total monthly rainfall received for the year.
Calculating Rainfall (4/4)
Mean (average) monthly rainfall
= Total annual rainfall
12
• Horizontal movement of air from a high
pressure area to a low pressure area
• Associated with land and sea breezes
Wind
wind
high
pressure
low pressure
cold air sinkswarm air rises
land Sea
Wind
•In the day, air over the sea is cooler than that
over the land, thus the cooler air
sinks, creating a higher pressure area.
•Warmer air over the land rises, creating a low
pressure.
•Differences in pressure cause the air over the
sea to move towards the low pressure over the
land.
•This horizontal movement of air causes wind.
NOTE: Greater differences in pressure give rise
to stronger breezes.
•The wind vane
points to the
direction where
the wind is
blowing from
•It is made up of
a freely moving
pointer and four
cardinal points –
north, south, ea
st, west
• Measuring wind direction:
Wind vane
•The wind rose records the
wind direction.
•It is represented by a
centre circle and eight
arms representing the main
eight compass directions.
•The number of calm days is
recorded in the centre
circle.
•The longer the arms, the
more days the wind is
received from that
direction.
Wind rose
5 E
S
N
NW
SW
NE
number of calm days5
• Siting of weather
instruments:
Wind
Stevenson screen
• 120cm above ground level
• Six’s thermometer is kept inside
• insulated from heat by material
and design
rain gauge
• 30cm above ground level
• on short grass away in an open
field from buildings
wind vane
• top of the meteorological
station with no obstructions
5 meteorological/weather stations in
Singapore

Weather elements unit 15

  • 1.
    Unit 15: WeatherElements Objectives Differentiate between weather and climate. Understand the use and siting of the weather instruments.
  • 2.
    Weather • Weather describes the conditionof the atmosphere of a place over a short period of time. • Temperature, rai nfall and wind Climate • Climate is the average conditions of the atmosphere of a place over a long period of time. • Average temperature and average rainfall pattern is used.
  • 3.
    Is this weatheror climate data?
  • 4.
    Is this aweather or climate data? Climatic maps are used to show information such as distribution of temperature and rainfall of a country, region or the world.
  • 5.
    Thermometer • Temperature refersto the degree of heat in the air. It tells us how hot or cold the air is. • A thermometer is used to measure temperature in degree Celsius (◦C) or degree Fahrenheit(◦F). • Six’s Thermometer or the maximum and minimum thermometer is used to record the highest and lowest temperatures of a day.
  • 6.
  • 7.
    • Made upof Mercury and Alcohol • Mercury – Very high boiling point • Alcohol – Very low freezing point • Read off the base of the Indices (Indicators)
  • 8.
    Activity - Readingthe Six’s Max = 30 oC Min = 5 oC Mercury Metal Indices Alcohol Max = 20 oC Min = 10 oC Max = 7.5 oC Min = -15 oC
  • 9.
    Stevenson Screen • TheSix’s thermometers are placed in a white, wooden box called a Stevenson Screen. • White wooden box to reflect heat • Louvred sides to allow air to flow freely • Doubled layered roof to prevent direct heating from the sun • Stand on stilts to prevent heat from the ground to be trapped
  • 12.
    Calculating Temperatures (1/5) Dailytemperature Range = Maximum Temp - Minimum Temp For example Max temp = 30 oC Min Temp = 10 oC Daily temp range = 20 oC
  • 13.
    Calculating Temperatures (2/5) Mean(average) daily temperature = Maximum Temp + Minimum Temp 2 For example Max temp = 30◦C Min Temp = 10◦C Average daily temp= (30+10)/2 = 20◦C
  • 14.
    Calculating Temperatures (3/5) Mean(average) monthly temperature = Total average daily temp for the month Number of days in the month
  • 15.
    Calculating Temperatures (3/5) Mean(average) monthly temperature = Average max temp + Average min temp 2 Only used this when average maximum and average minimum temperature are given.
  • 16.
    Calculating Temperatures (4/5) Mean(average) Annual temperature = Total average monthly temp in a year 12
  • 17.
    Calculating Temperatures (5/5) Annualtemperature range = Highest mean - Lowest mean monthly temp monthly temp
  • 18.
    Location X Month JanFeb Mar Apr May Jun Jul Aug Sep Oct Nov Dec Temp 23 22 20.5 16.5 14 10.5 10 11 12.5 14 17.5 21 Mean Annual Temperature = Total of mean monthly temperature / 12 = (23 + 22 + 20.5 + 16.5 + 14 + 10.5 + 10 + 11 + 12.5 + 14 + 17.5 + 21 ) / 12 = (192.5) / 12 = 16.04 oC Annual Temperature Range = Highest Temperature – Lowest Temperature = 23 – 10 = 13 oC
  • 19.
    Location Y Month JanFeb Mar Apr May Jun Jul Aug Sep Oct Nov Dec Temp 25.5 26 26.5 27 27.5 28 27.5 27 26.5 26.5 26 26 Mean Annual Temperature = Total of mean monthly temperature / 12 = (25.5 + 26 + 26.5 + 27 + 27.5 + 28 + 27.5 + 27 + 26.5 + 26.5 + 26 + 26 ) / 12 = (321) / 12 = 26.75 oC Annual Temperature Range = Highest Temperature – Lowest Temperature = 28 – 25.5 = 2.5 oC
  • 20.
    • Average dailyor mean daily temperature: • Calculation of temperature data: Temperature Average daily or mean daily temperature Maximum temperature + Minimum temperature 2 = Daily temperature range Maximum temperature - Minimum temperature= Average monthly temperature Sum of average daily temperatures for the month Number of days in the month = Average annual temperature Sum of average monthly temperatures in a year 12 = • Daily temperature range • Average monthly temperature • Average annual temperature
  • 21.
    •An instrument usedto measure the amount of rainfall •Rain falls through a funnel and is collected in the bottle •Excess rain that overflows is collected in the copper cylinder •Amount of rain collected is poured into a measuring cylinder, calibrated in millimeters • Rain gauge: Rainfall outer cylinder funnel glass bottle measuring cylinder copper cylinder
  • 22.
    •One-third of the raingauge is sunk into the ground to prevent toppling •To be placed in an area free of obstructions •Rain gauge: Rainfall copper cylinder funnel glass bottleouter cylinder
  • 23.
    Calculating Rainfall (1/4) Dailyrainfall = Sum of all rainfall readings in a day
  • 24.
    Calculating Rainfall (2/4) Monthlyrainfall = Sum of all daily rainfall readings in a month
  • 25.
    Calculating Rainfall (3/4) Totalannual rainfall = Sum of the total monthly rainfall received for the year.
  • 26.
    Calculating Rainfall (4/4) Mean(average) monthly rainfall = Total annual rainfall 12
  • 27.
    • Horizontal movementof air from a high pressure area to a low pressure area • Associated with land and sea breezes Wind wind high pressure low pressure cold air sinkswarm air rises land Sea
  • 28.
    Wind •In the day,air over the sea is cooler than that over the land, thus the cooler air sinks, creating a higher pressure area. •Warmer air over the land rises, creating a low pressure. •Differences in pressure cause the air over the sea to move towards the low pressure over the land. •This horizontal movement of air causes wind. NOTE: Greater differences in pressure give rise to stronger breezes.
  • 29.
    •The wind vane pointsto the direction where the wind is blowing from •It is made up of a freely moving pointer and four cardinal points – north, south, ea st, west • Measuring wind direction: Wind vane
  • 30.
    •The wind roserecords the wind direction. •It is represented by a centre circle and eight arms representing the main eight compass directions. •The number of calm days is recorded in the centre circle. •The longer the arms, the more days the wind is received from that direction. Wind rose 5 E S N NW SW NE number of calm days5
  • 31.
    • Siting ofweather instruments: Wind Stevenson screen • 120cm above ground level • Six’s thermometer is kept inside • insulated from heat by material and design rain gauge • 30cm above ground level • on short grass away in an open field from buildings wind vane • top of the meteorological station with no obstructions
  • 32.