1. 17th Oct’14 Aaj Ka Trend
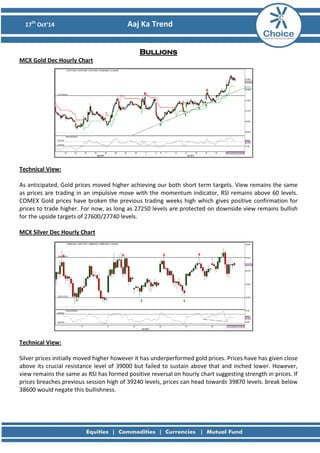
Bullions MCX Gold Dec Hourly Chart
Technical View: As anticipated, Gold prices moved higher achieving our both short term targets. View remains the same as prices are trading in an impulsive move with the momentum indicator, RSI remains above 60 levels. COMEX Gold prices have broken the previous trading weeks high which gives positive confirmation for prices to trade higher. For now, as long as 27250 levels are protected on downside view remains bullish for the upside targets of 27600/27740 levels. MCX Silver Dec Hourly Chart
Technical View: Silver prices initially moved higher however it has underperformed gold prices. Prices have has given close above its crucial resistance level of 39000 but failed to sustain above that and inched lower. However, view remains the same as RSI has formed positive reversal on hourly chart suggesting strength in prices. If prices breaches previous session high of 39240 levels, prices can head towards 39870 levels. break below 38600 would negate this bullishness.
2. 17th Oct’14 Aaj Ka Trend
Fundamental News:
• Gold prices fell on Thursday, but still remained near a one-month peak as Wednesday's disappointing U.S. data added to concerns over the outlook for global economic growth, supporting demand for the safe-haven asset.
• On the Comex division of the New York Mercantile Exchange, gold for December delivery traded at $1,222.80 a troy ounce during European early morning hours, down 0.42%.
Pivot Levels for the Day:
S1
S2
S3
Pivot
R1
R2
R3
Gold
27276
27103
26763
27443
27616
27783
28123
Silver
38595
38317
37747
38887
39165
39457
40027
Recommendation:
Gold
Buy
Silver
Buy above 39240
3. 17th Oct’14 Aaj Ka Trend
Base Metals MCX Copper Nov Hourly Chart
Technical Views: Prices gave a gap down opening and gave a sharp decline. We now change our bias to negative as prices given steep decline which suggest bearishness in prices. The momentum indicator, RSI has also fell below 40 on hourly chart giving another negative confirmation. Rallies near 411 can be used as selling opportunity to test 408/406 levels.
MCX Aluminum Oct Hourly Chart
MCX Lead Oct Hourly Chart
MCX Nickel Oct Hourly Chart
MCX Zinc Oct Hourly Chart
4. 17th Oct’14 Aaj Ka Trend
Fundamental News:
• Copper futures were mildly lower during European morning trade on Wednesday, after data showed that Chinese inflation in September slowed more than expected, underlining concerns over the health of the world's second biggest economy
• On the Comex division of the New York Mercantile Exchange, copper for December delivery traded at $3.074 a pound during European morning hours, down 1.6 cents, or 0.52%.
Pivot Levels for the Day:
S1
S2
S3
Pivot
R1
R2
R3
Copper
403.7
398.4
384.8
412.1
417.4
425.7
439.4
Aluminum
116.8
115.7
114.0
117.4
118.5
119.1
120.8
Lead
120.6
118.9
114.7
123.0
124.8
127.2
131.3
Nickel
938.1
917.0
863.5
970.5
991.6
1024.0
1077.5
Zinc
134.5
131.3
123.4
139.1
142.4
147.0
154.8
Recommendation:
Copper
Sell on Rallies
Aluminum
Buy
Lead
Sell
Nickel
Sell on Rallies
Zinc
Sell on Rallies
5. 17th Oct’14 Aaj Ka Trend
Energy MCX Crude Oct Hourly Chart:
Technical Views: Prices moved lower exceeding our short term target of 5000 levels. However, prices witnessed sharp short covering in the second half of the trading session but failed to sustain that level and moved lower after taking resistance near 5140 levels. The momentum indicator, RSI has also taken resistance near 60 levels. Hourly close above 5150 could add momentum in prices for 200/300 points up move as long as 4950 levels are intact on downside. MCX Natural Gas Oct Hourly Chart:
Technical Views: We expect natural gas prices to move lower as prices are trading in lower top lower bottom formation. The momentum indicator, RSI has also remained in over sold territory which suggests weakness/ lack of momentum in prices. We expect prices could test 230/228 levels as long as 238 is capped on higher side.
6. 17th Oct’14 Aaj Ka Trend
Fundamental News:
• Crude futures slid on Thursday after data revealed U.S. inventories rose more than markets were expecting last week, while soft Chinese inflation figures softened the commodity as well by stoking concerns that global supply far outstrips demand.
• Crude futures slid on Thursday after data revealed U.S. inventories rose more than markets were expecting last week, while soft Chinese inflation figures softened the commodity as well by stoking concerns that global supply far outstrips demand.
• Natural gas futures edged lower on Wednesday after updated weather-forecasting models scaled back on the intensity of a U.S. cool snap, leaving investors to conclude demand for heating will be less than once anticipated
• On the New York Mercantile Exchange, natural gas futures for delivery in November were down 0.72% at $3.789 per million British thermal units during U.S. trading. The commodity hit a session low of $3.765, and a high of $3.855.
Pivot Levels for the Day:
S1
S2
S3
Pivot
R1
R2
R3
Crude
4960
4811
4529
5093
5242
5375
5657
Natural Gas
232.8
229.6
223.7
235.5
238.7
241.4
247.3
Recommendation:
Crude
Sell
Natural Gas
Sell
8. 17th Oct’14 Aaj Ka Trend
This is solely for information of clients of Choice India and does not construe to be an investment advice. It is also not intended as an offer or solicitation for the purchase and sale of any financial instruments. Any action taken by you on the basis of the information contained herein is your responsibility alone and Choice India its subsidiaries or its employees or associates will not be liable in any manner for the consequences of such action taken by you. We have exercised due diligence in checking the correctness and authenticity of the information contained in this recommendation, but Choice India or any of its subsidiaries or associates or employees shall not be in any way responsible for any loss or damage that may arise to any person from any inadvertent error in the information contained in this recommendation or any action taken on basis of this information. Technical analysis studies market psychology, price patterns and volume levels. It is used to forecast future price and market movements. Technical analysis is complementary to fundamental analysis and news sources. The recommendations issued herewith might be contrary to recommendations issued by Choice India in the company research undertaken as the recommendations stated in this report is derived purely from technical analysis. Choice India has based this document on information obtained from sources it believes to be reliable but which it has not independently verified; Choice India makes no guarantee, representation or warranty and accepts no responsibility or liability as to its accuracy or completeness. The opinions contained within the report are based upon publicly available information at the time of publication and are subject to change without notice. The information and any disclosures provided herein are in summary form and have been prepared for informational purposes. The recommendations and suggested price levels are intended purely for trading purposes. The recommendations are valid for the day of the report however trading trends and volumes might vary substantially on an intraday basis and the recommendations may be subject to change. The information and any disclosures provided herein may be considered confidential. Any use, distribution, modification, copying, forwarding or disclosure by any person is strictly prohibited. The information and any disclosures provided herein do not constitute a solicitation or offer to purchase or sell any security or other financial product or instrument. The current performance may be unaudited. Past performance does not guarantee future returns. There can be no assurance that investments will achieve any targeted rates of return, and there is no guarantee against the loss of your entire investment. POTENTIAL CONFLICT OF INTEREST DISCLOSURE (as on date of report) Disclosure of interest statement – • Analyst interest of the stock /Instrument(s): - No. • Firm interest of the stock / Instrument (s): - No.
Disclaimer