Downloaded 287 times
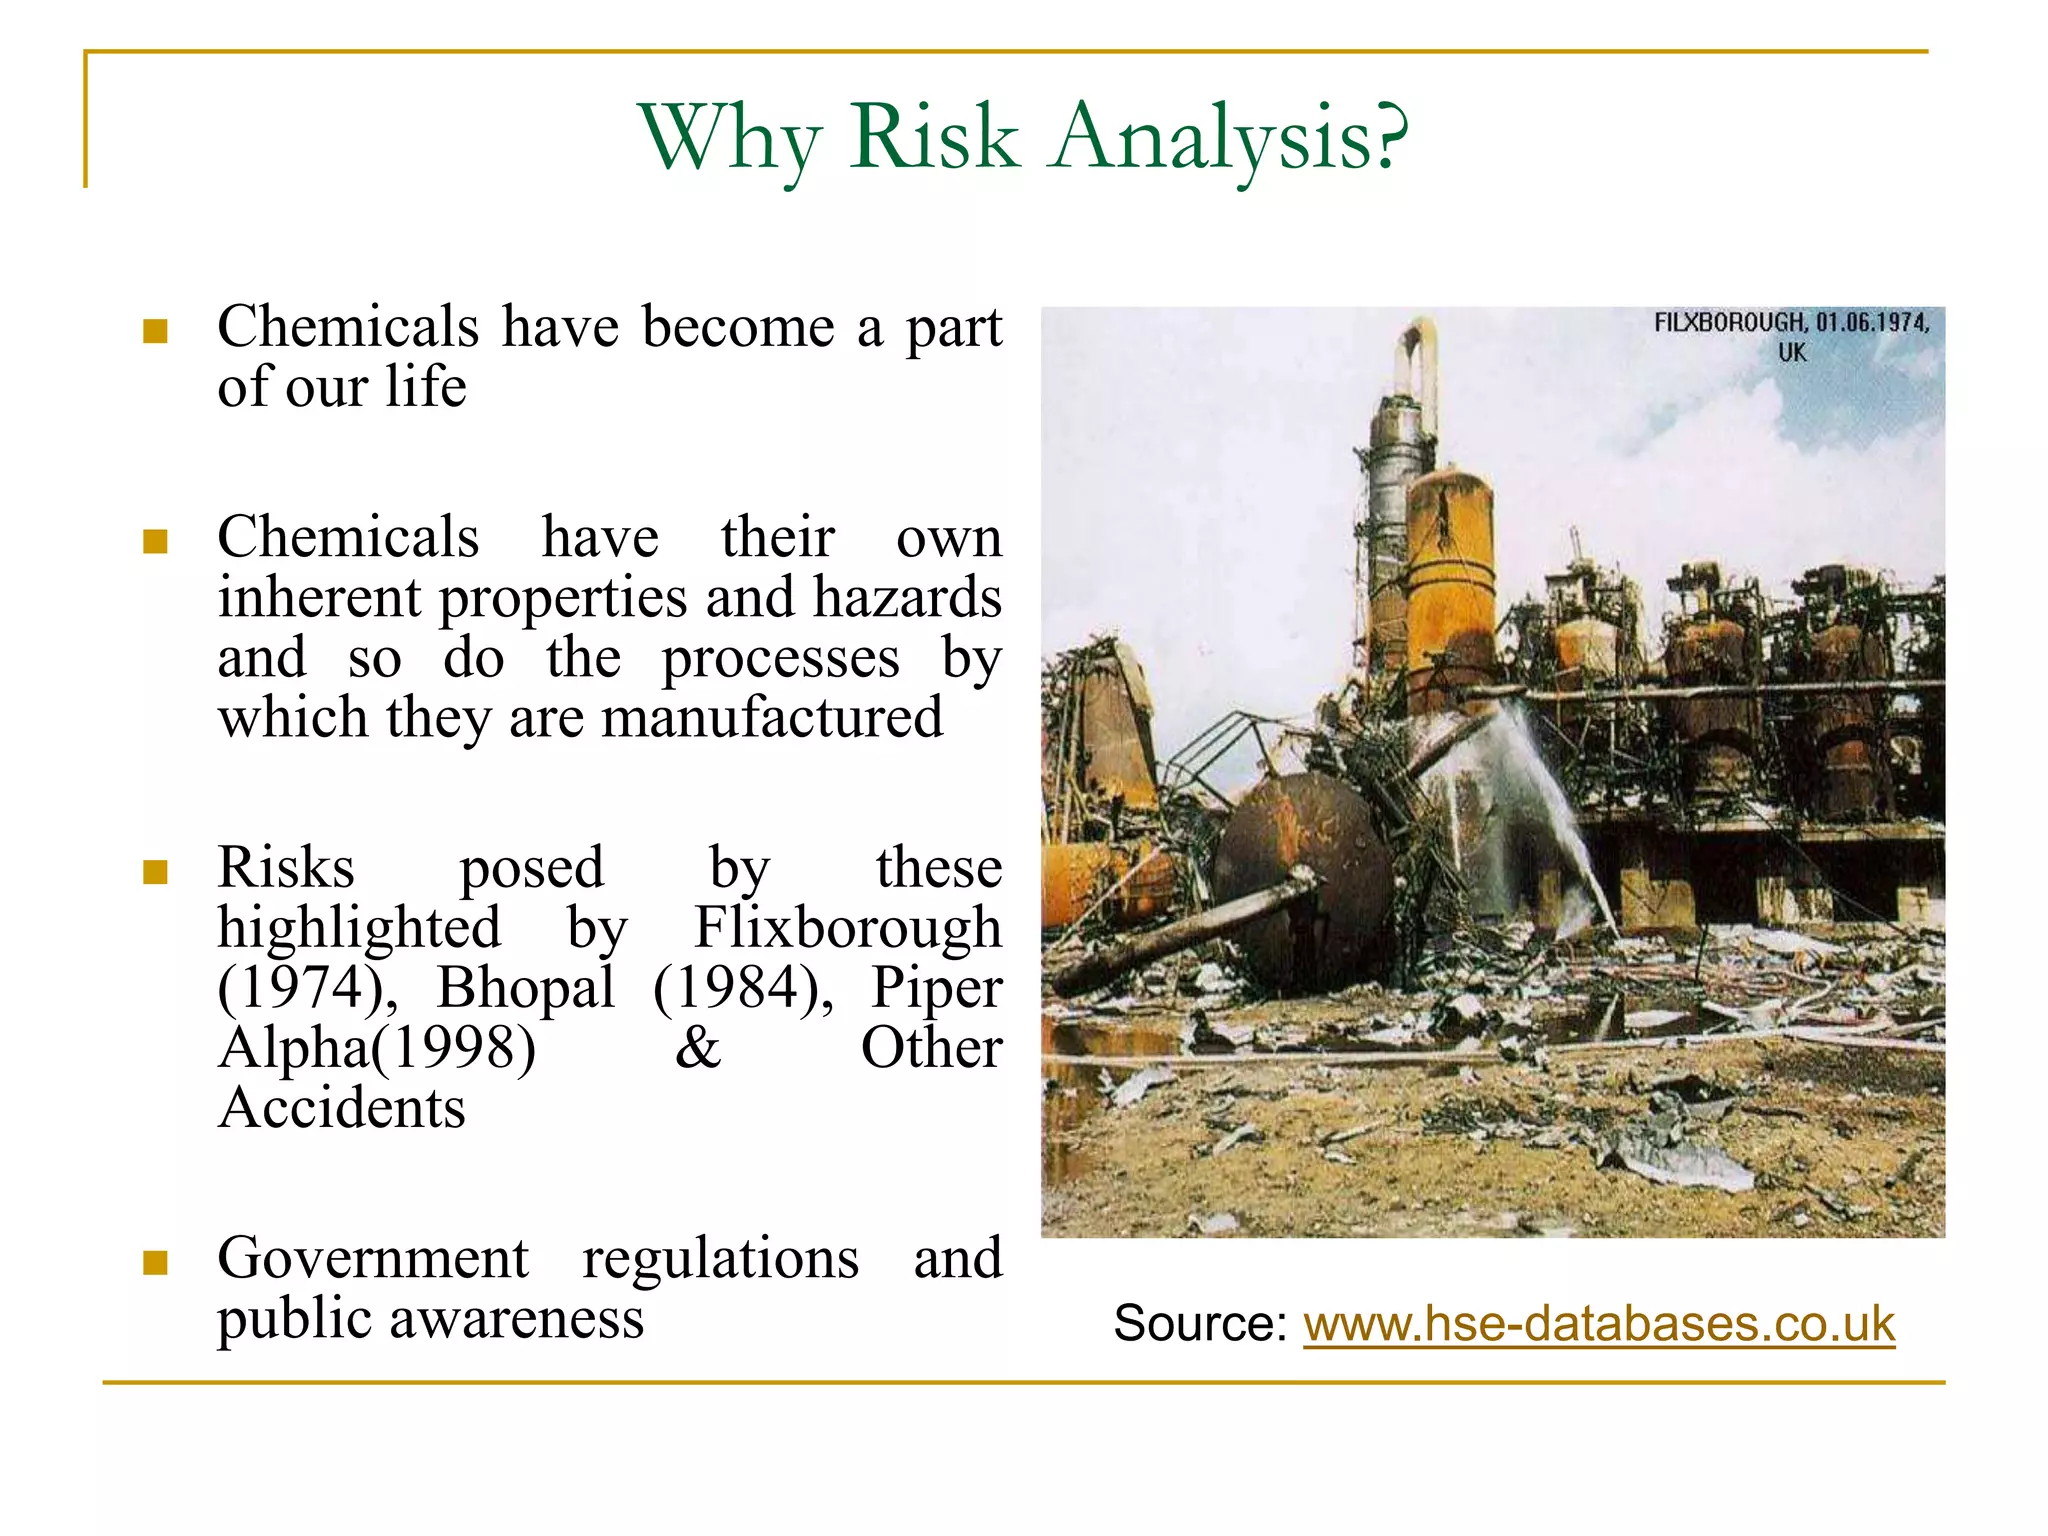
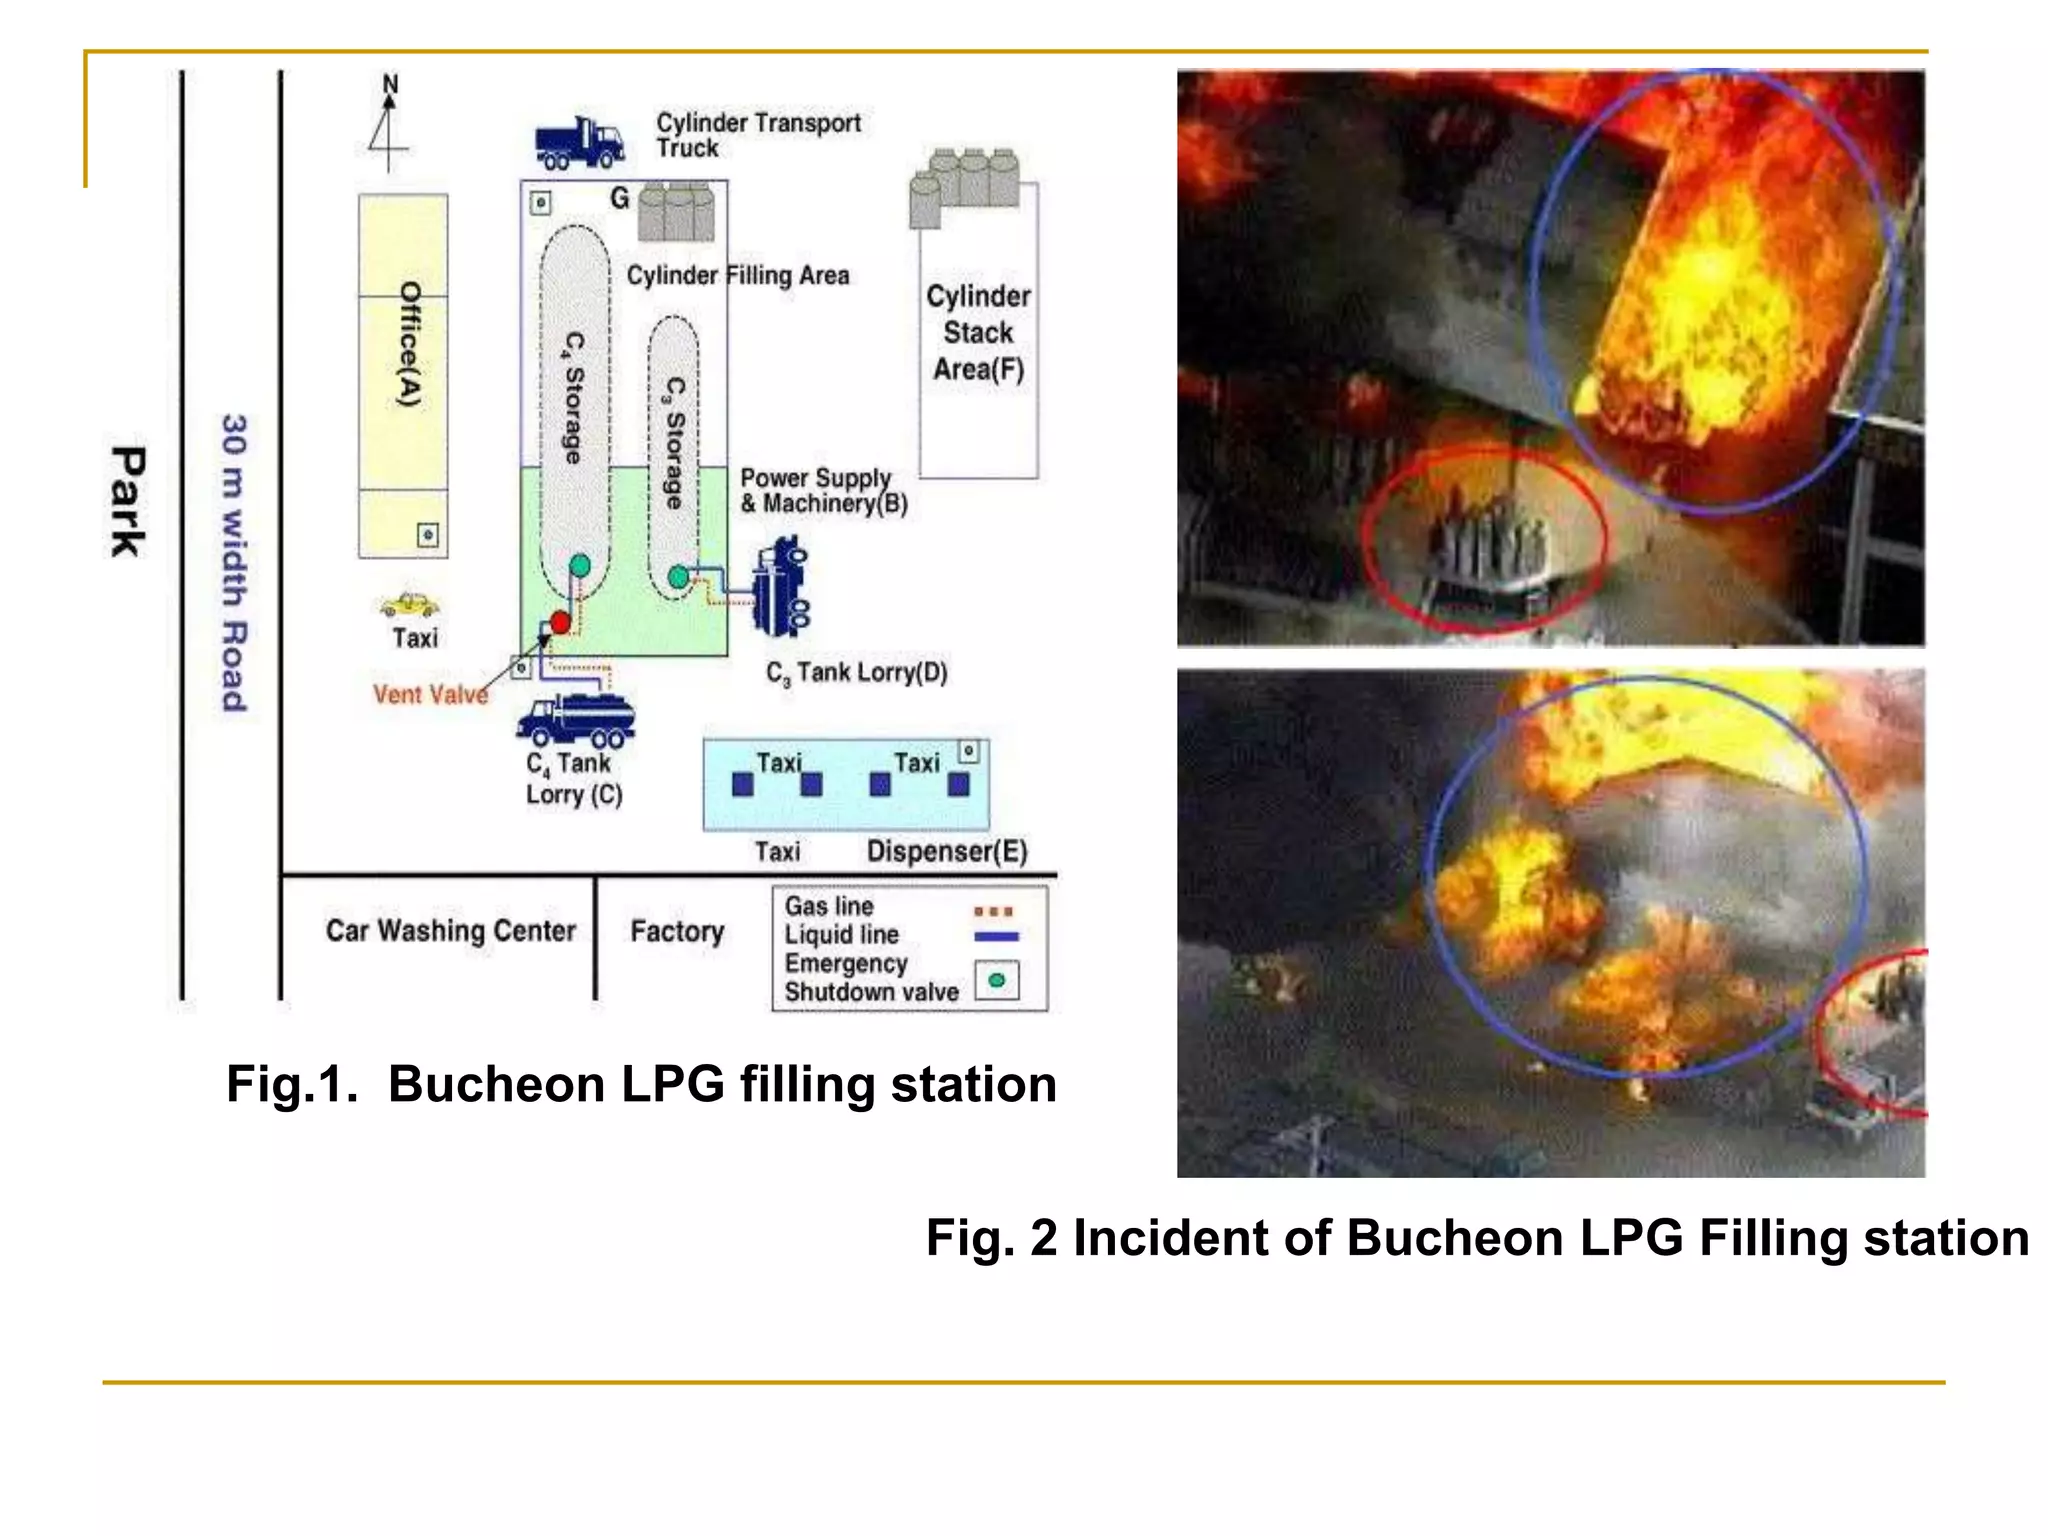
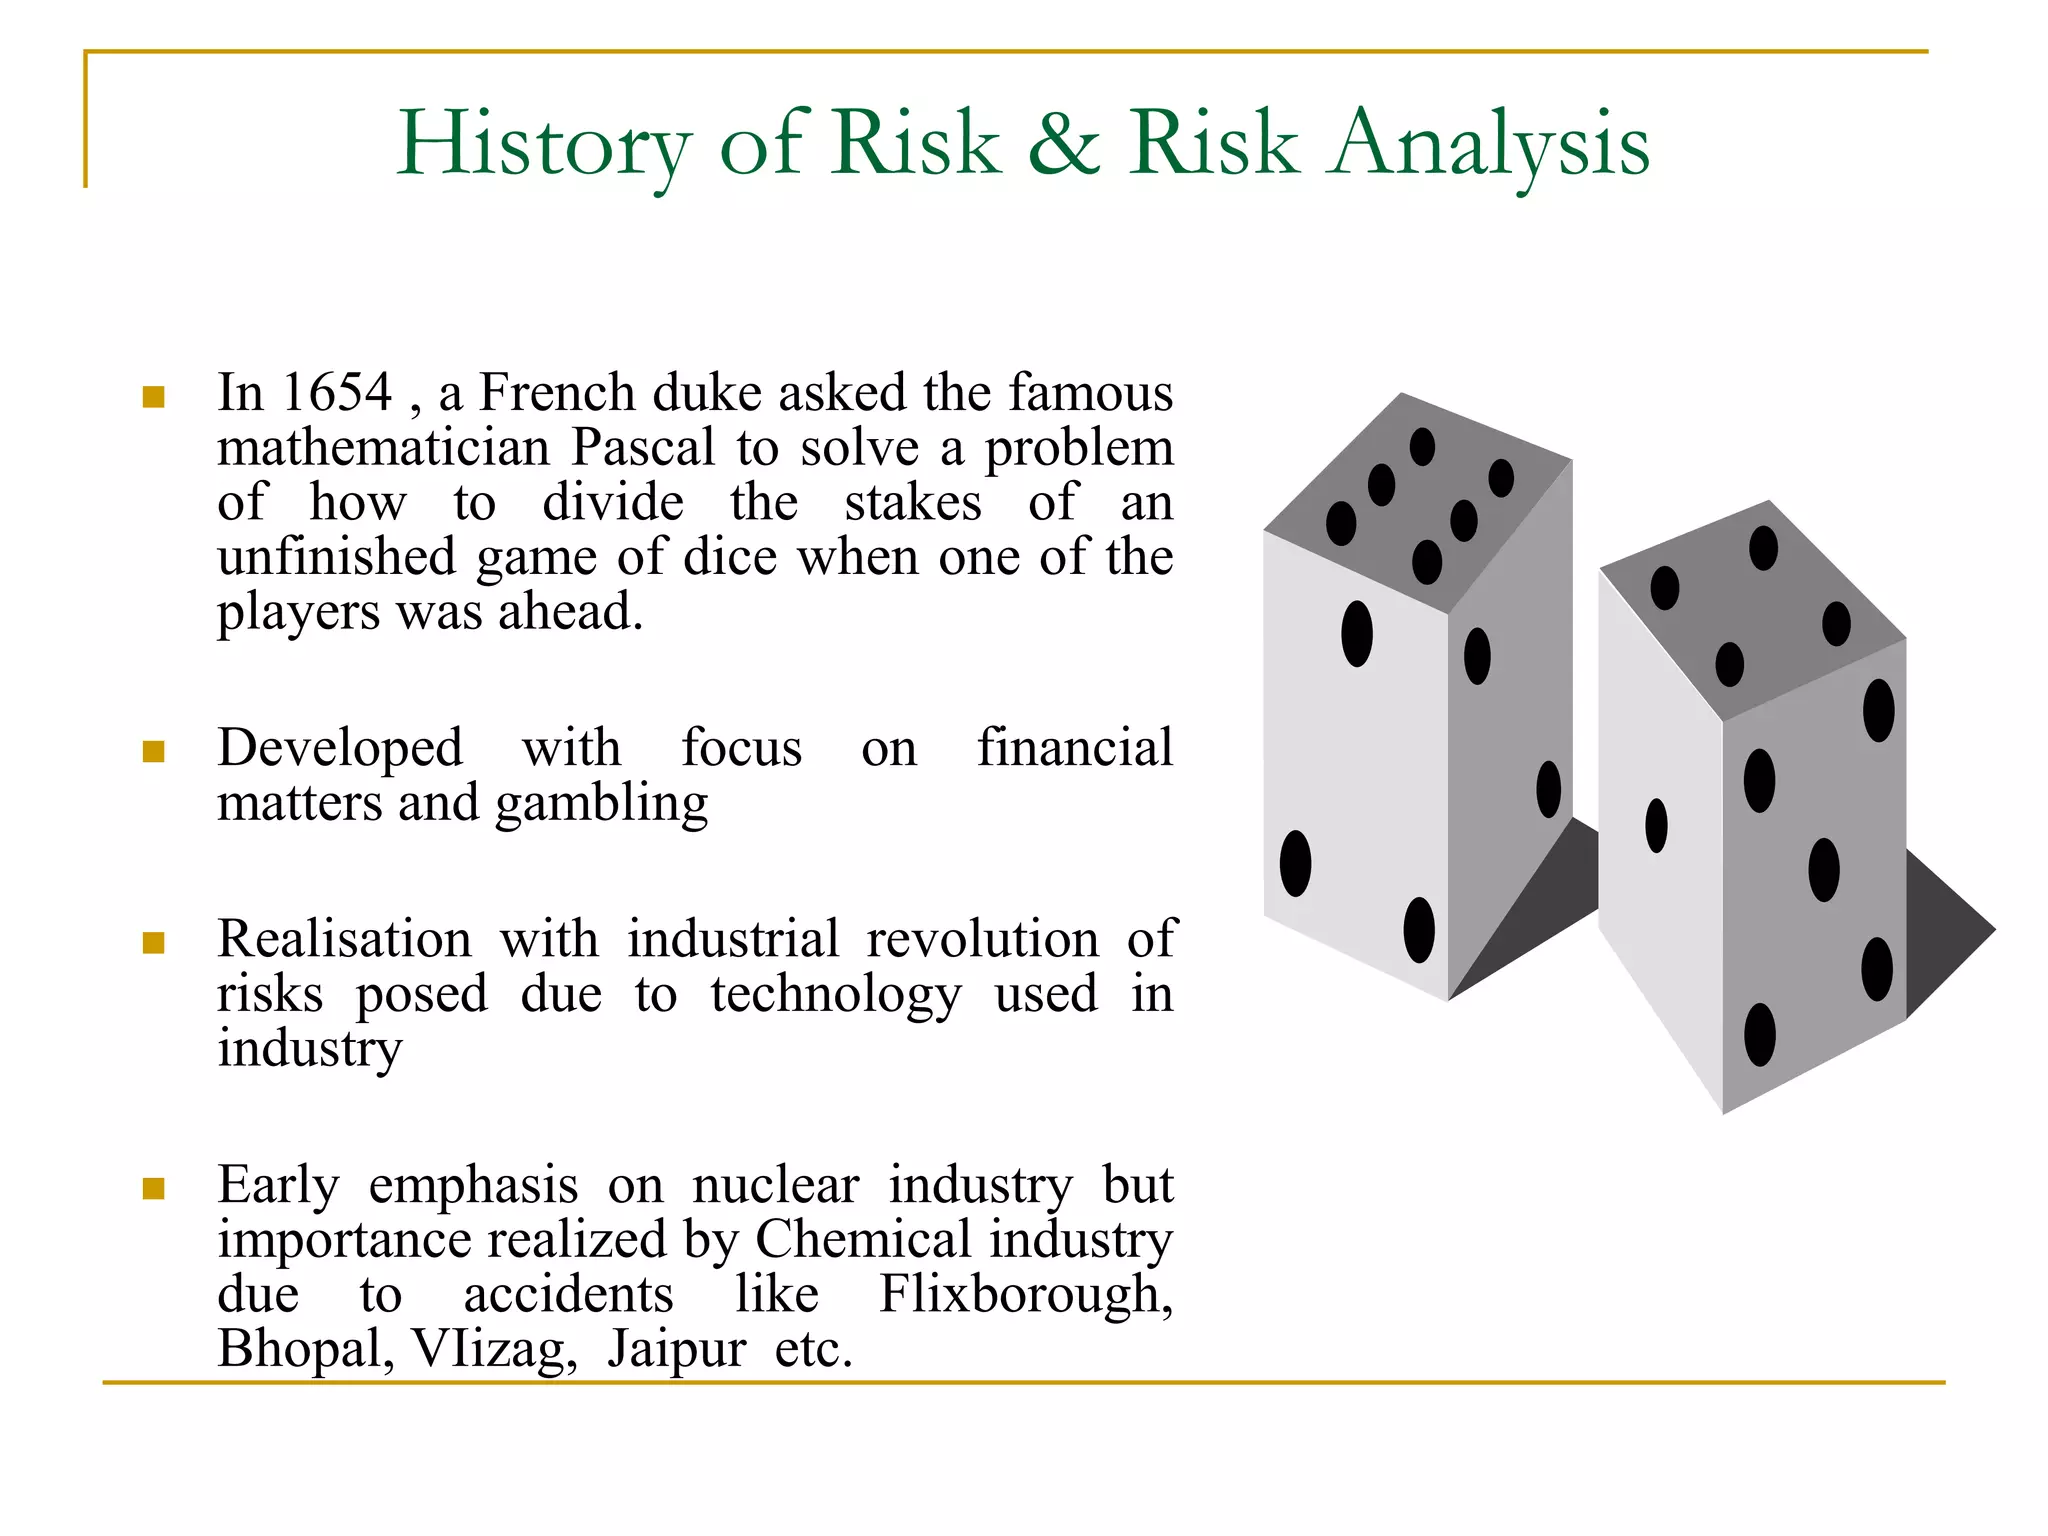
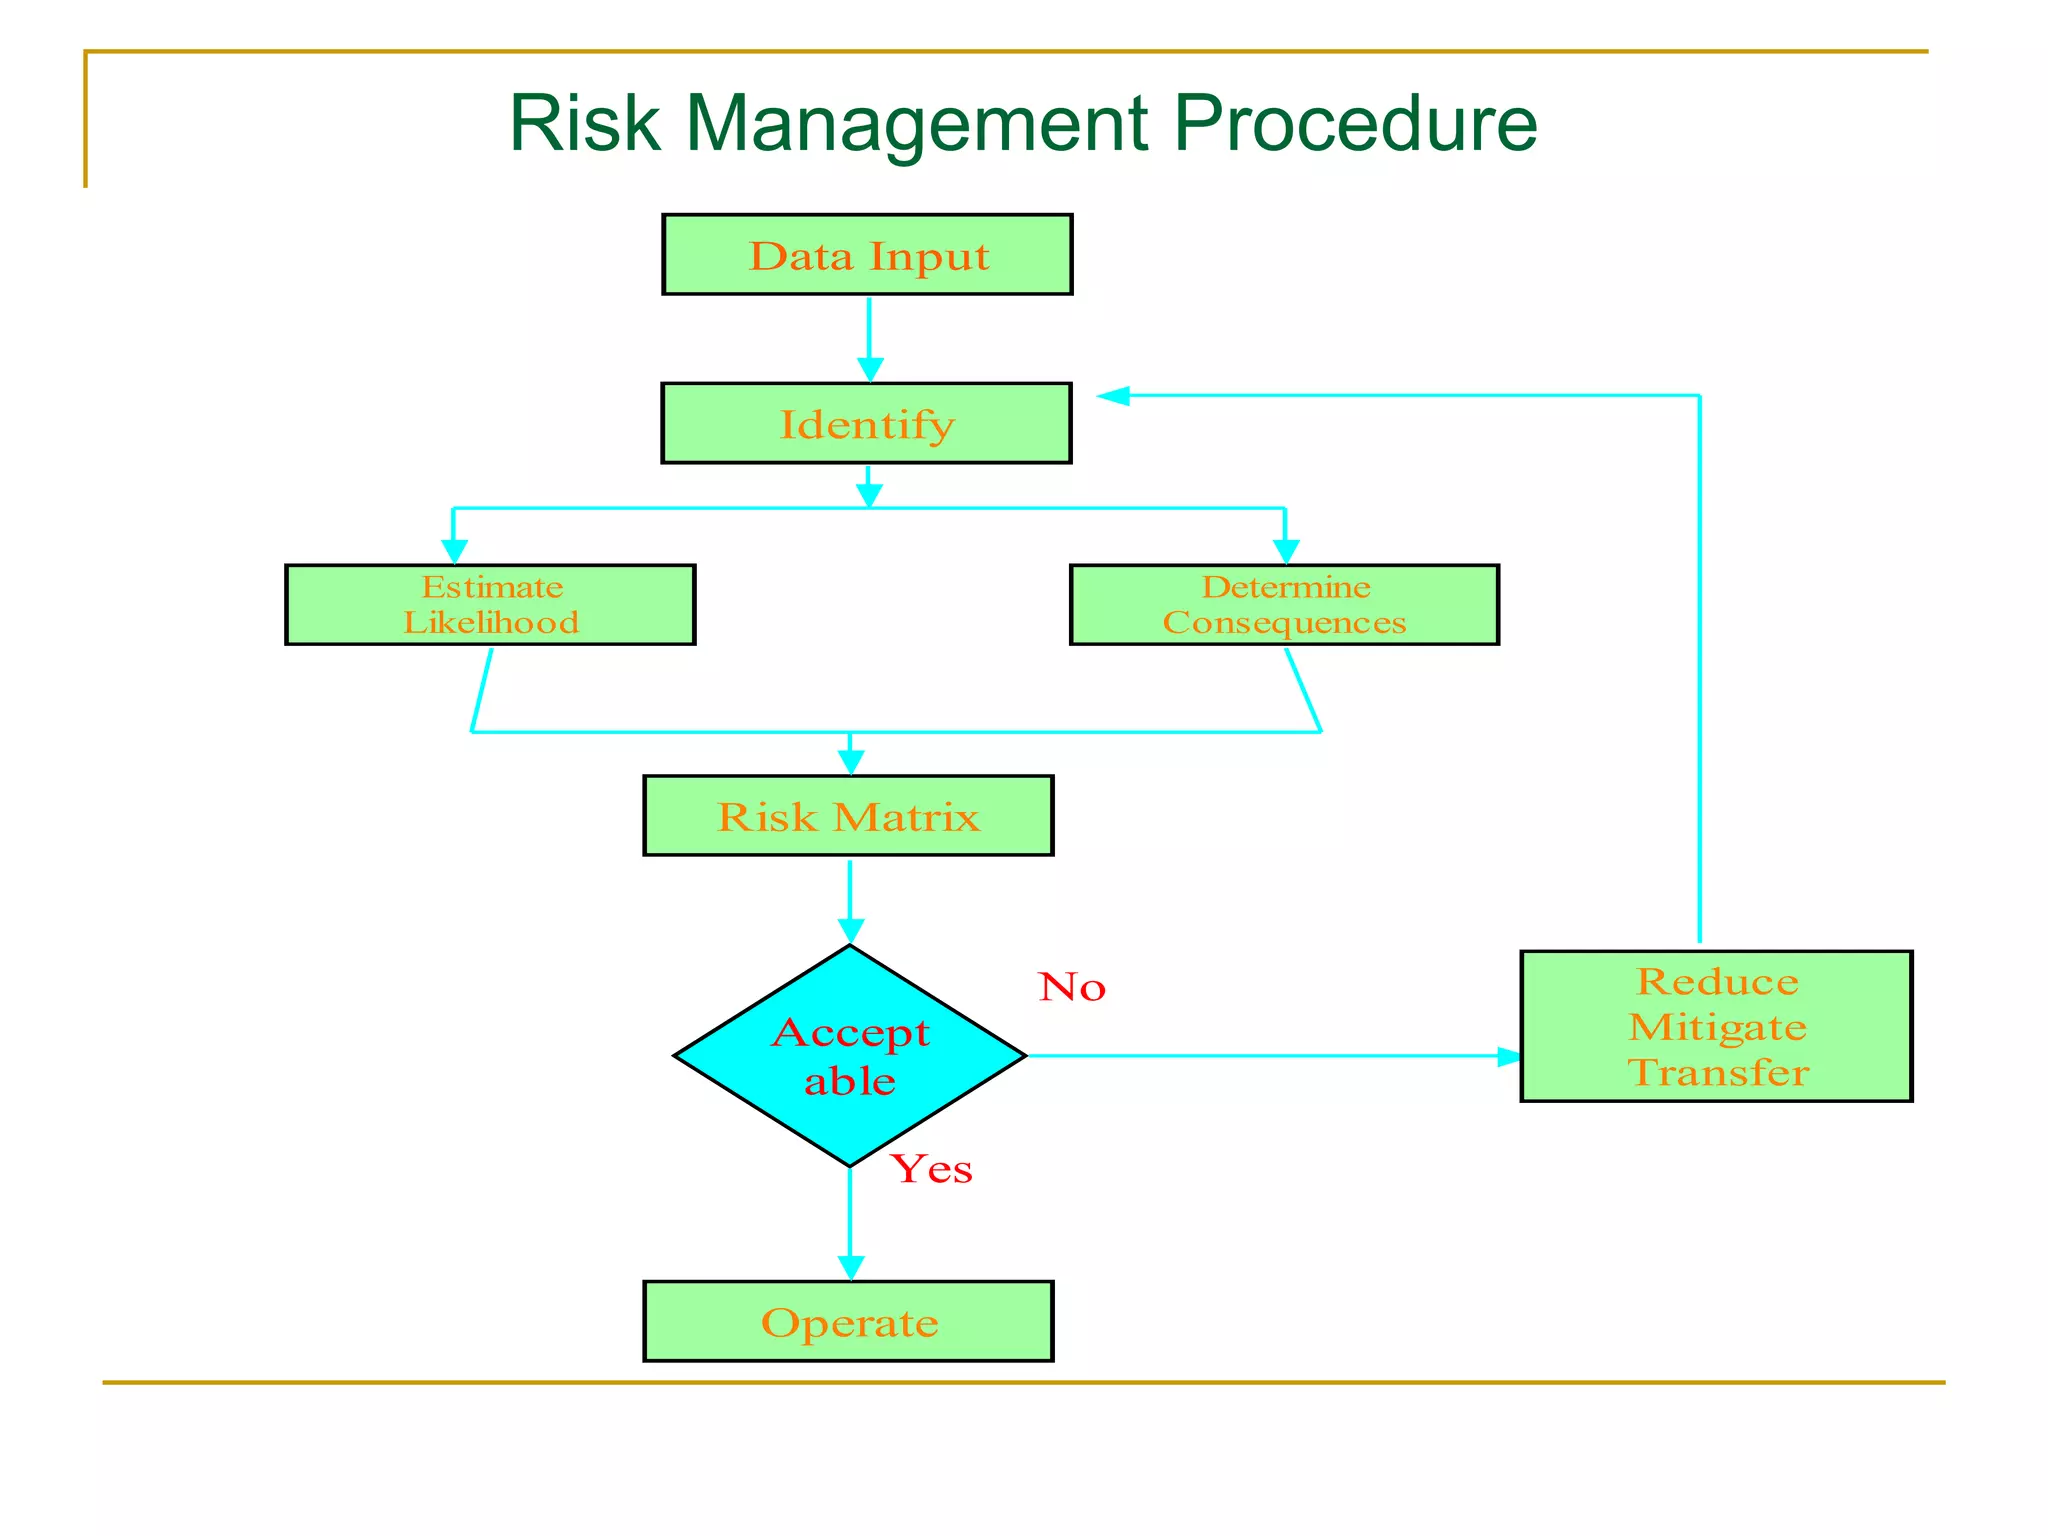
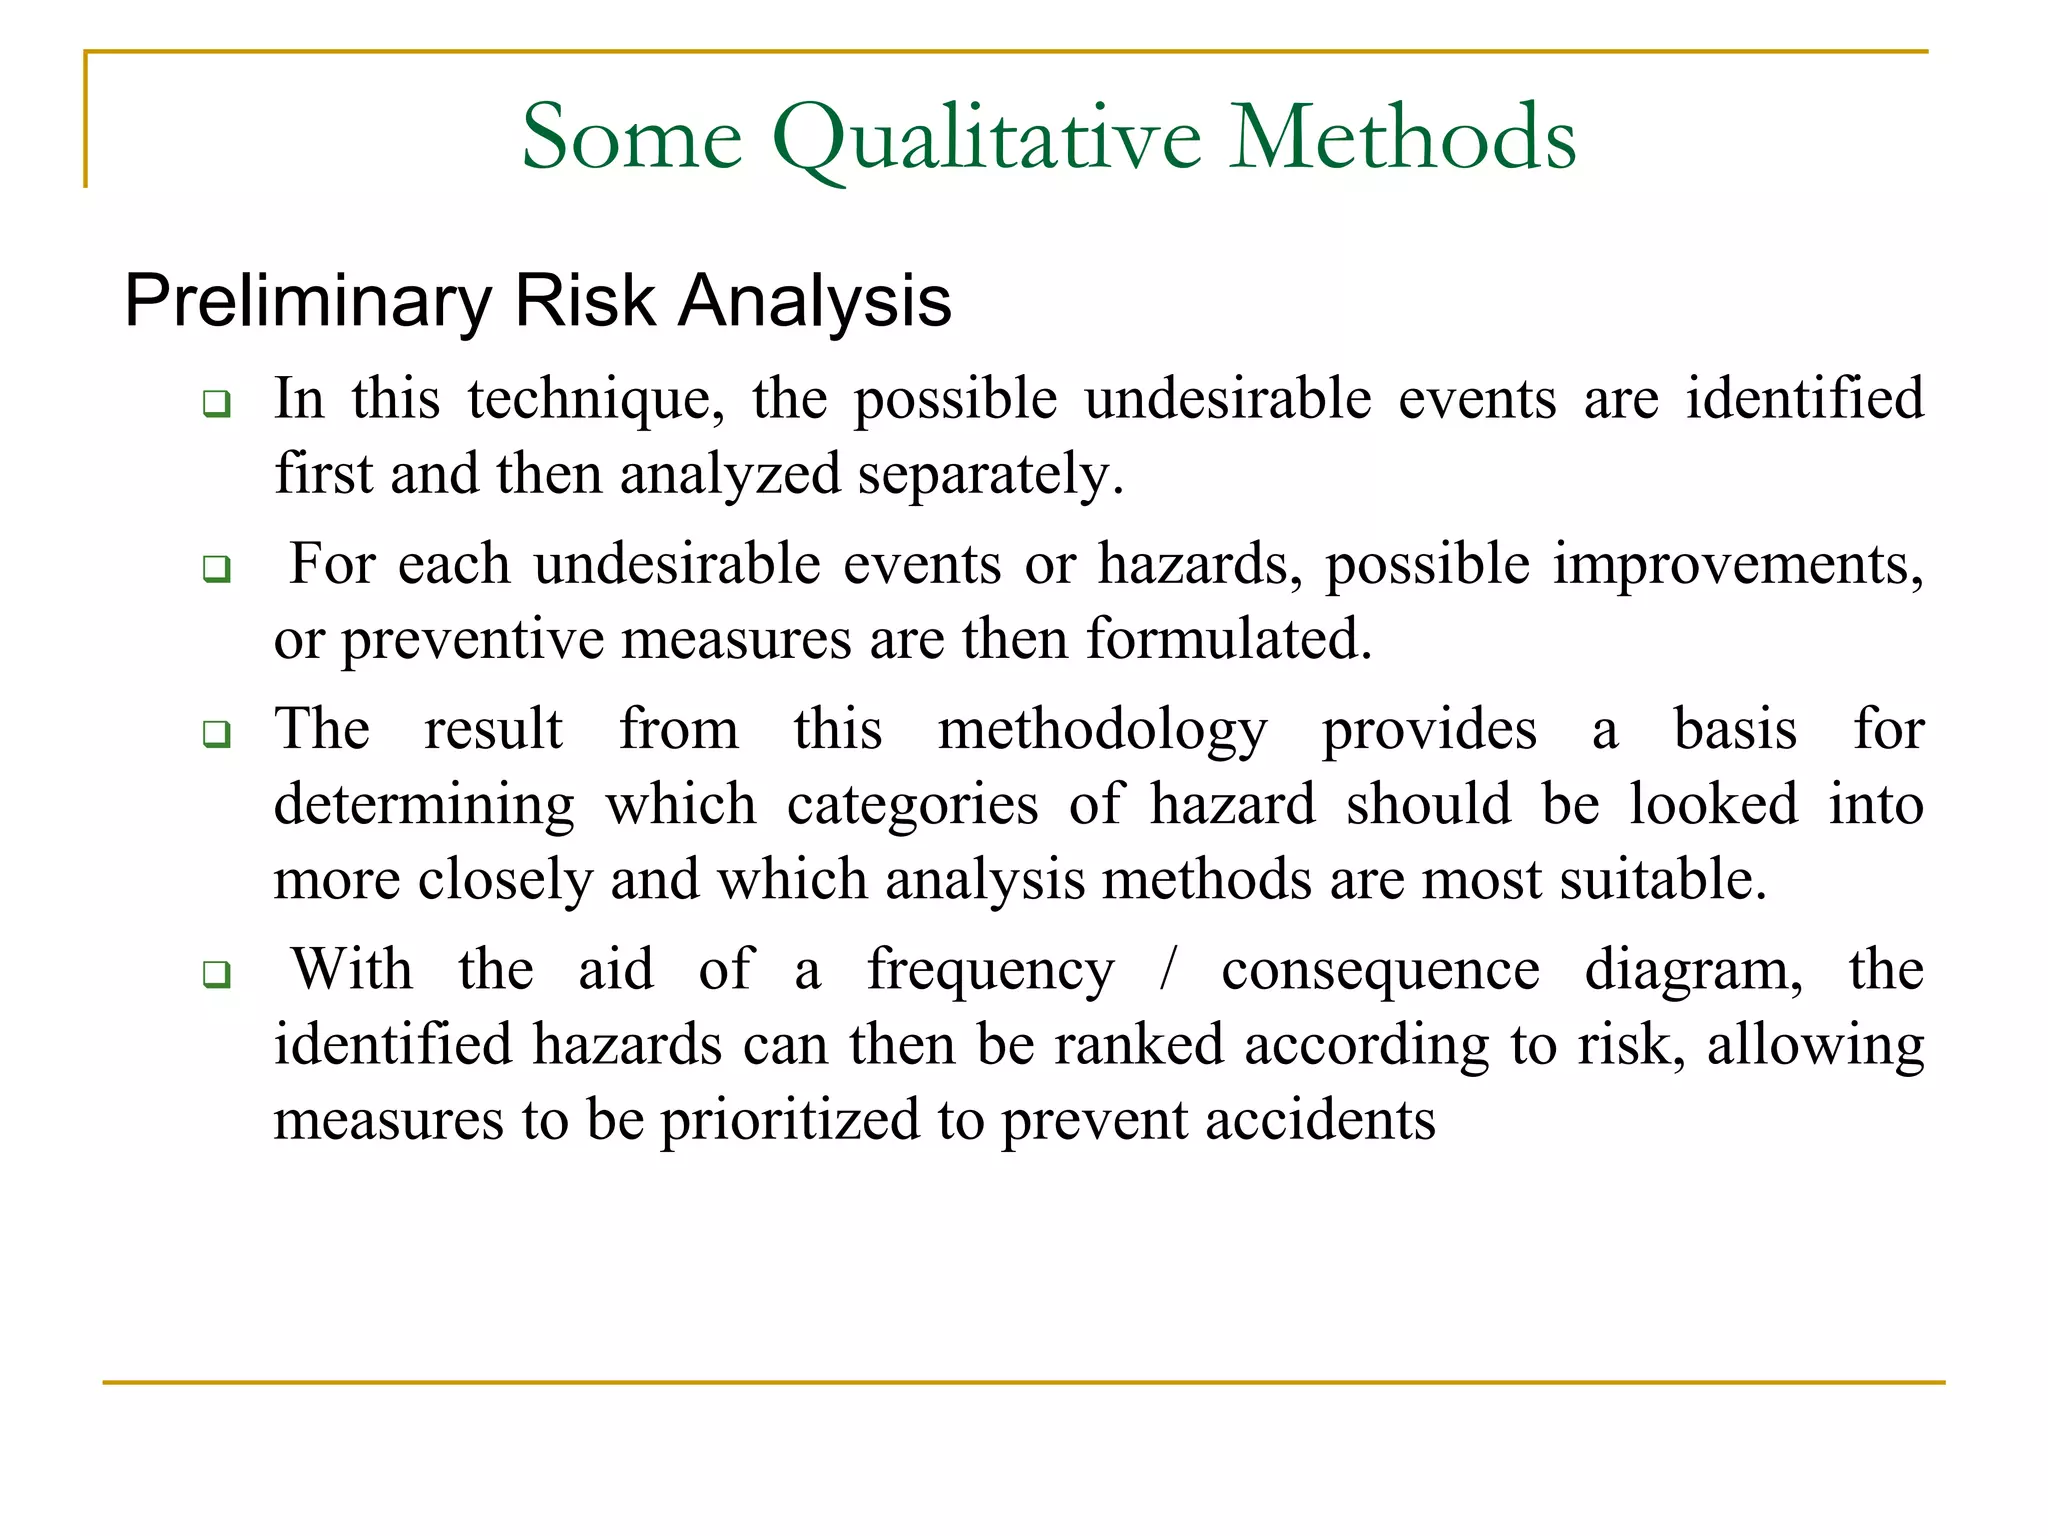
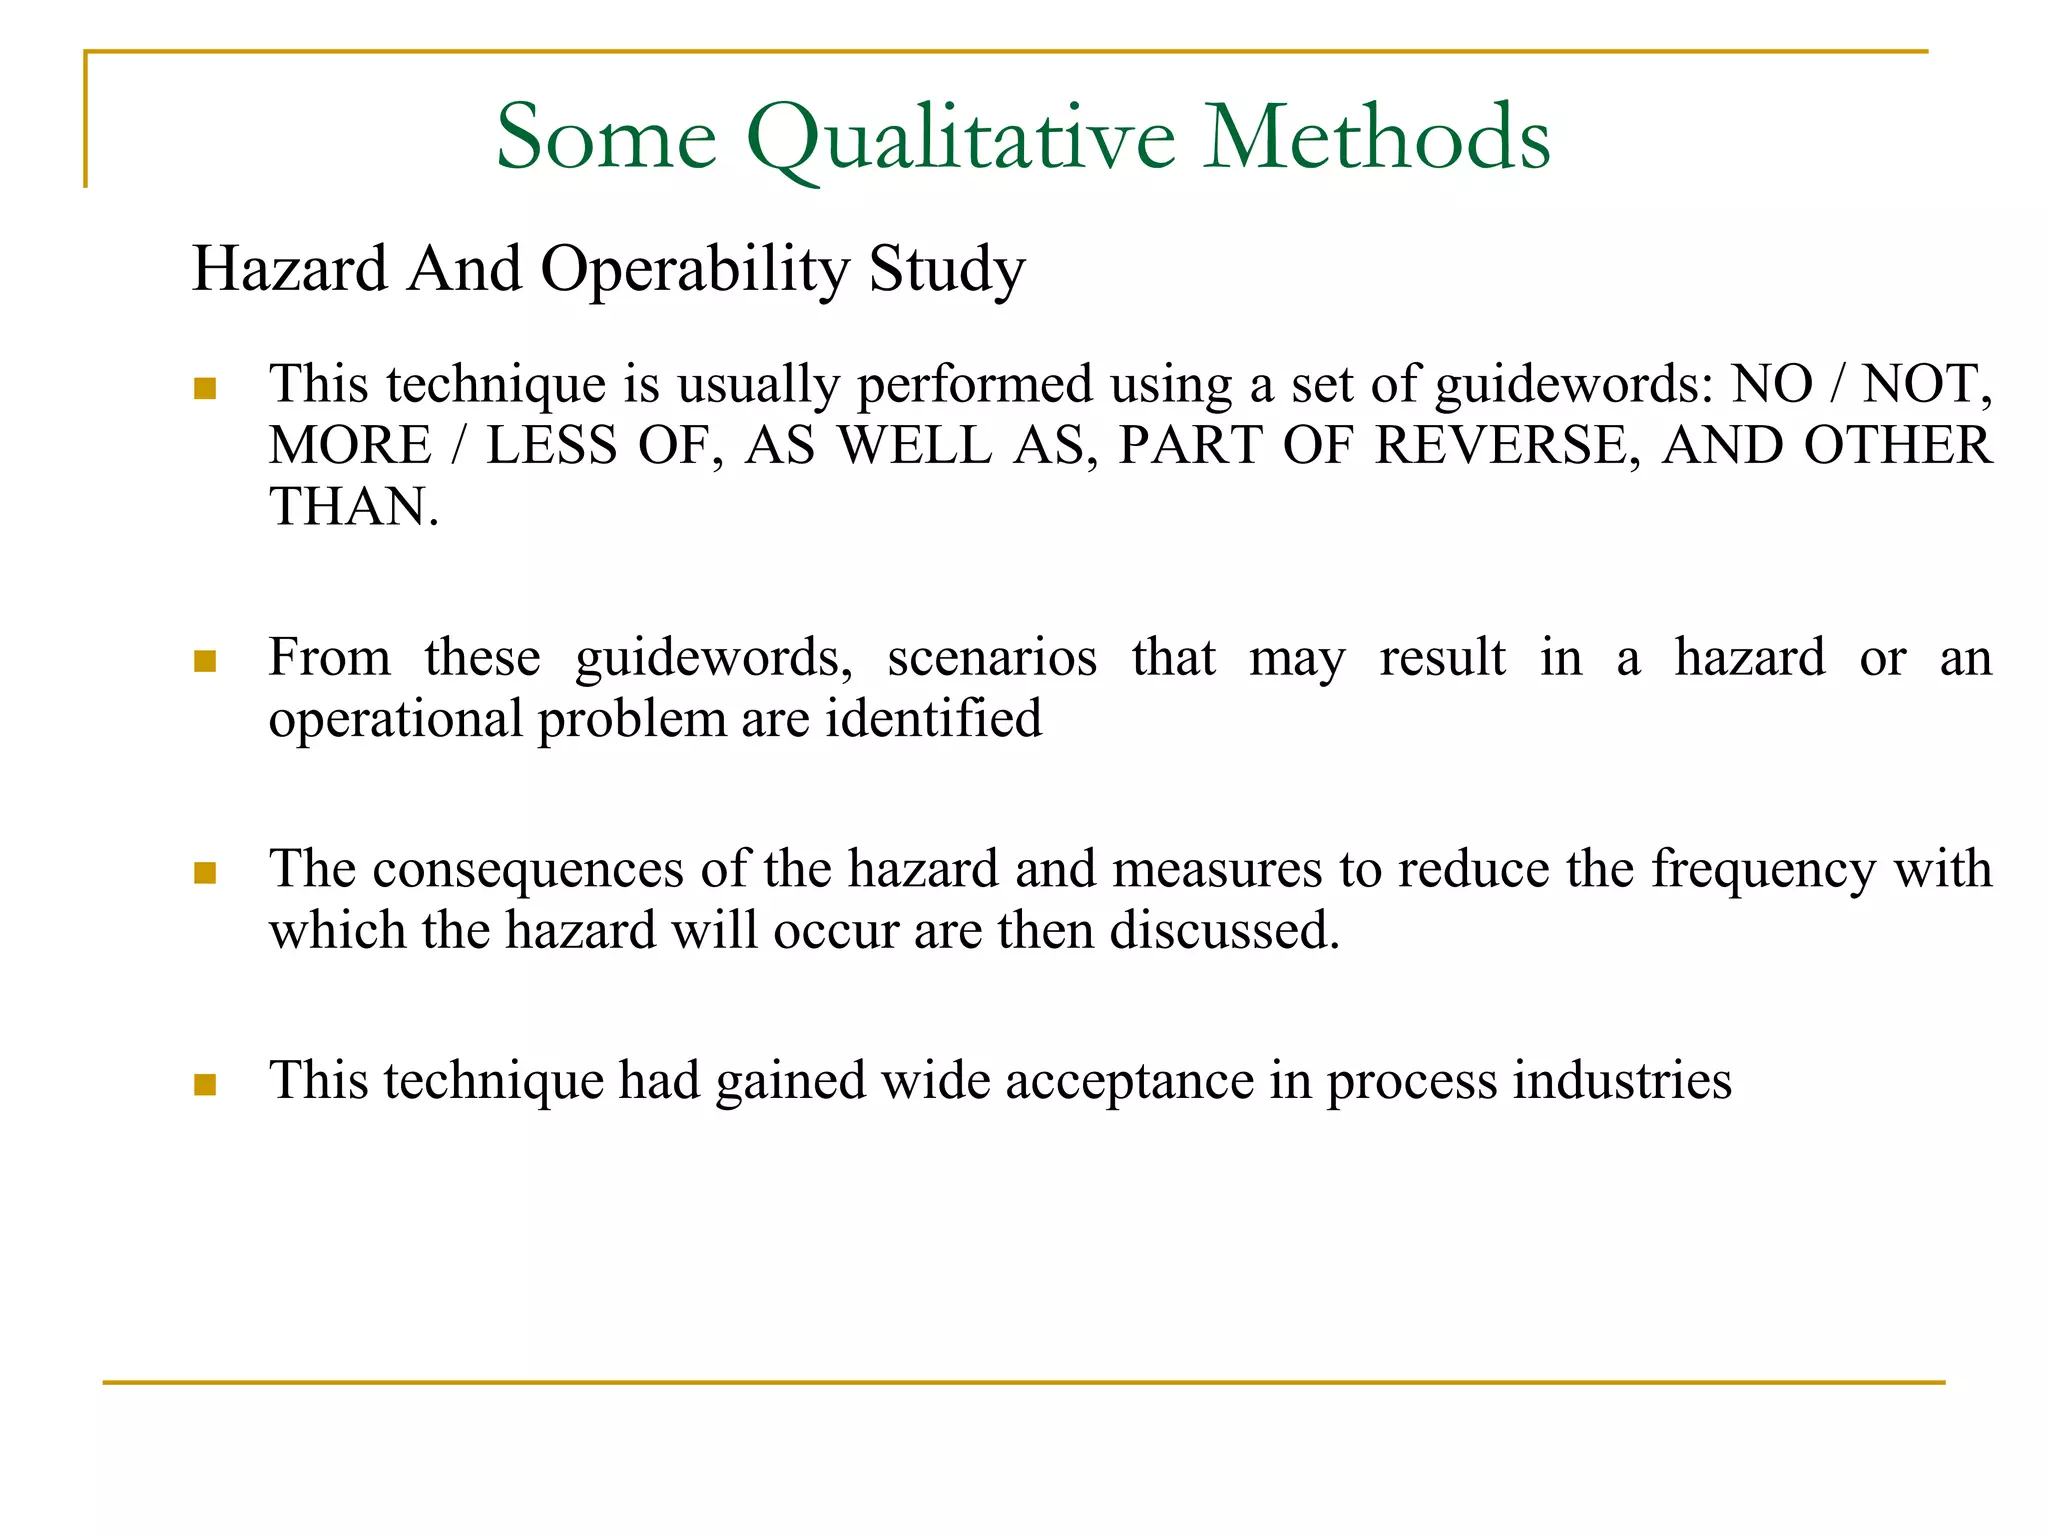
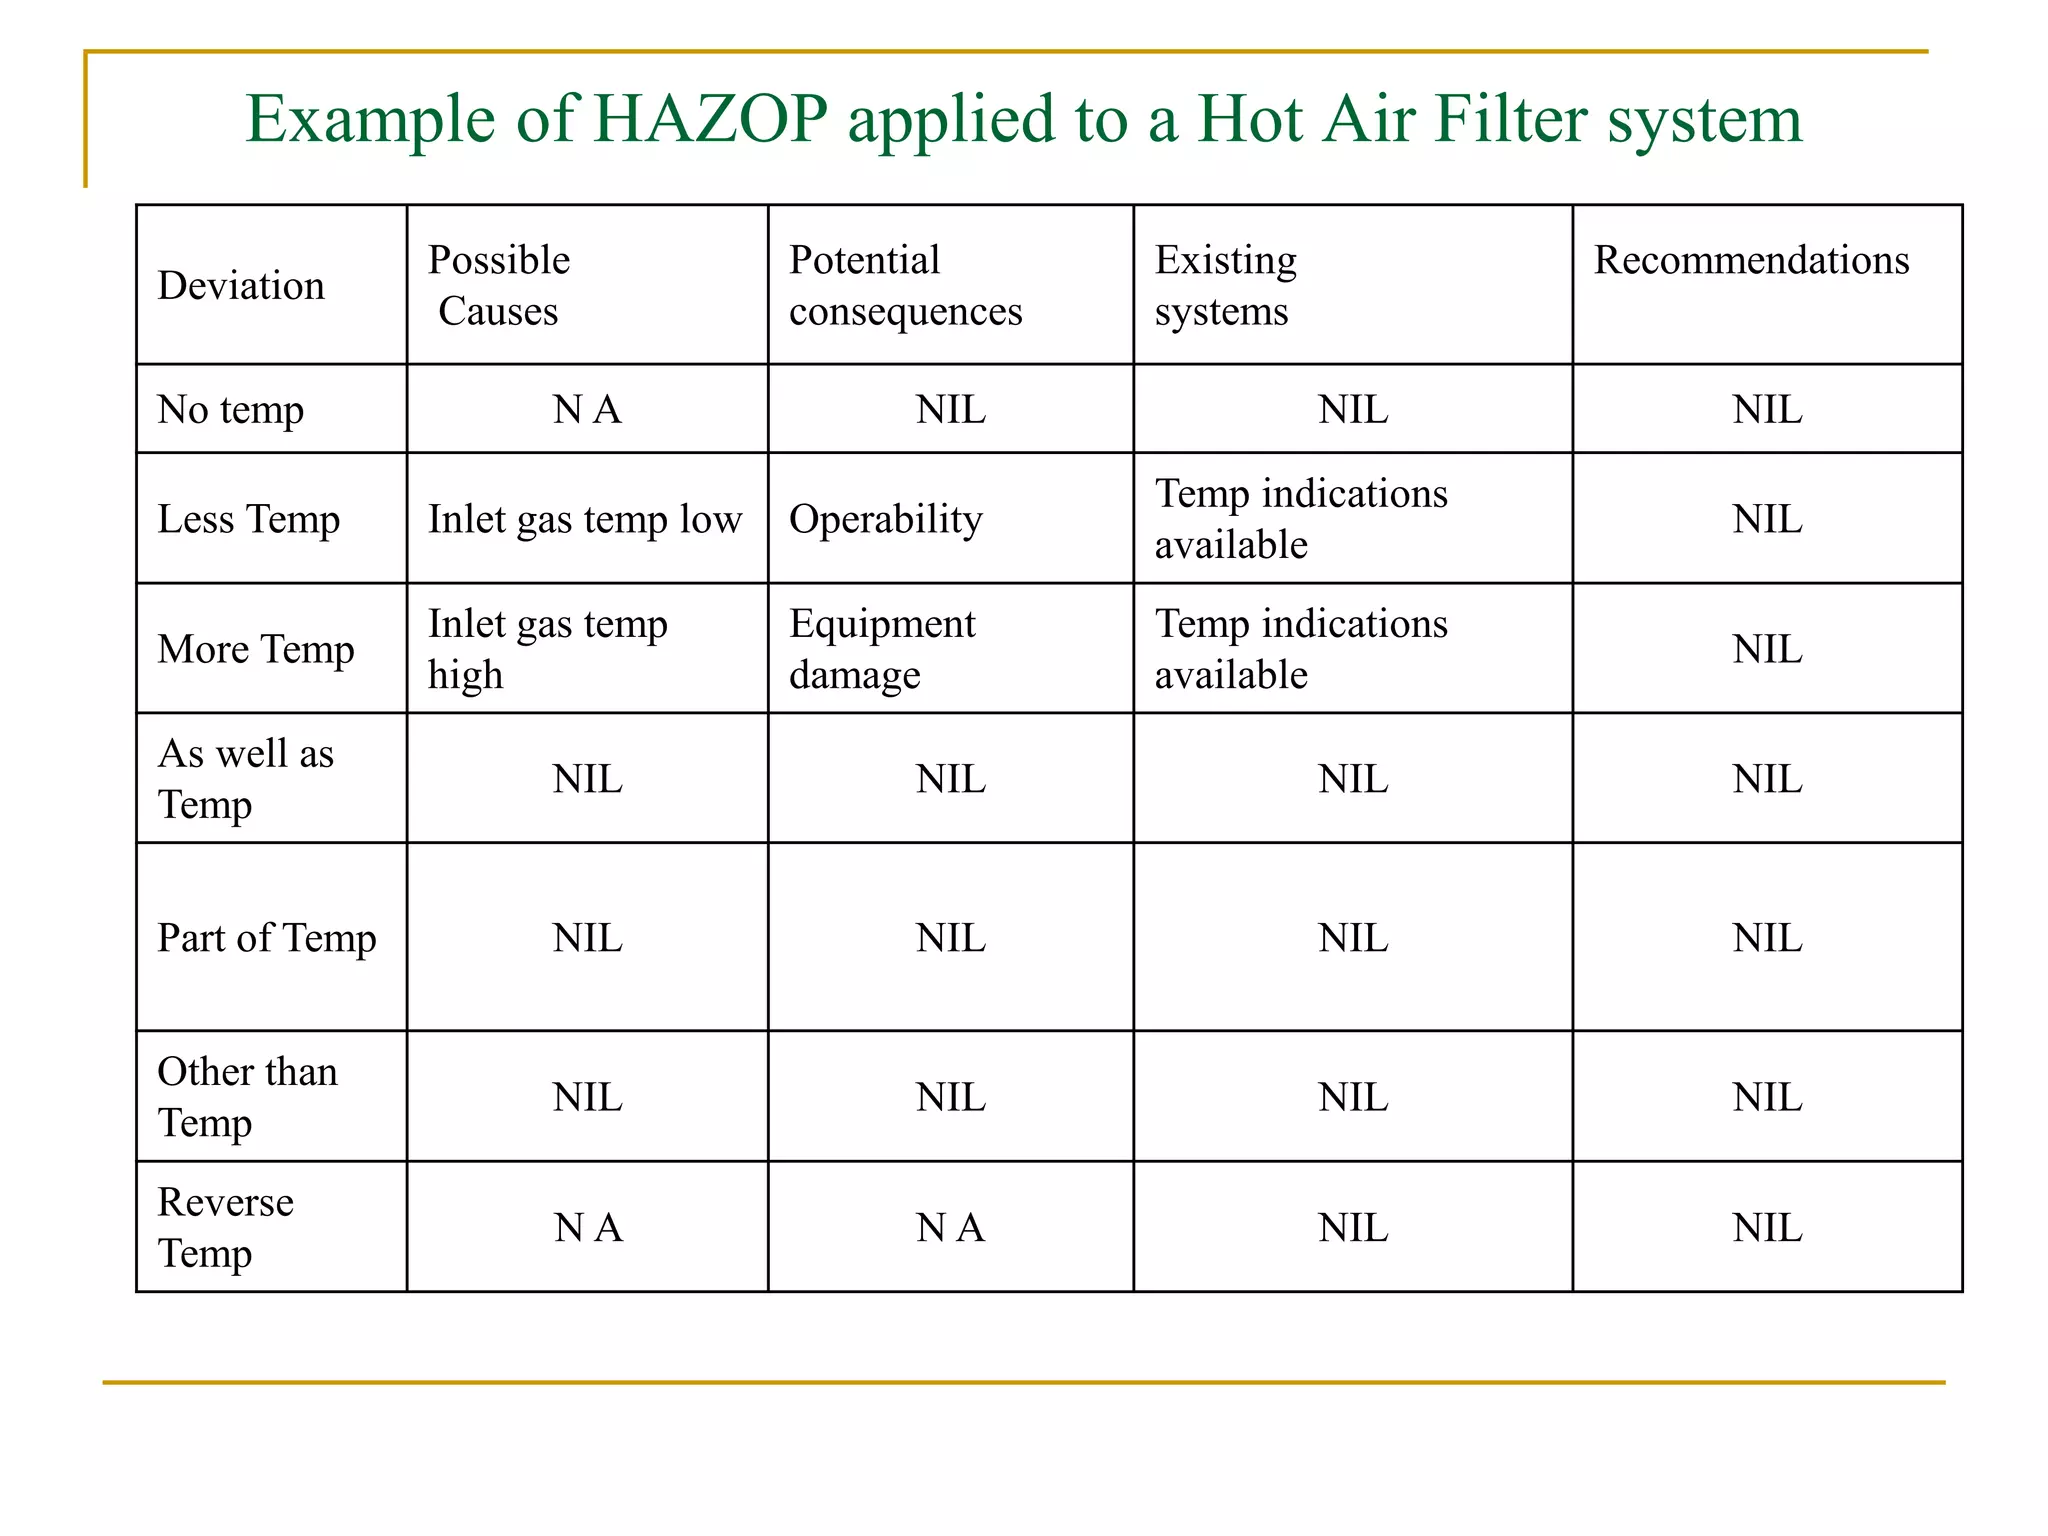
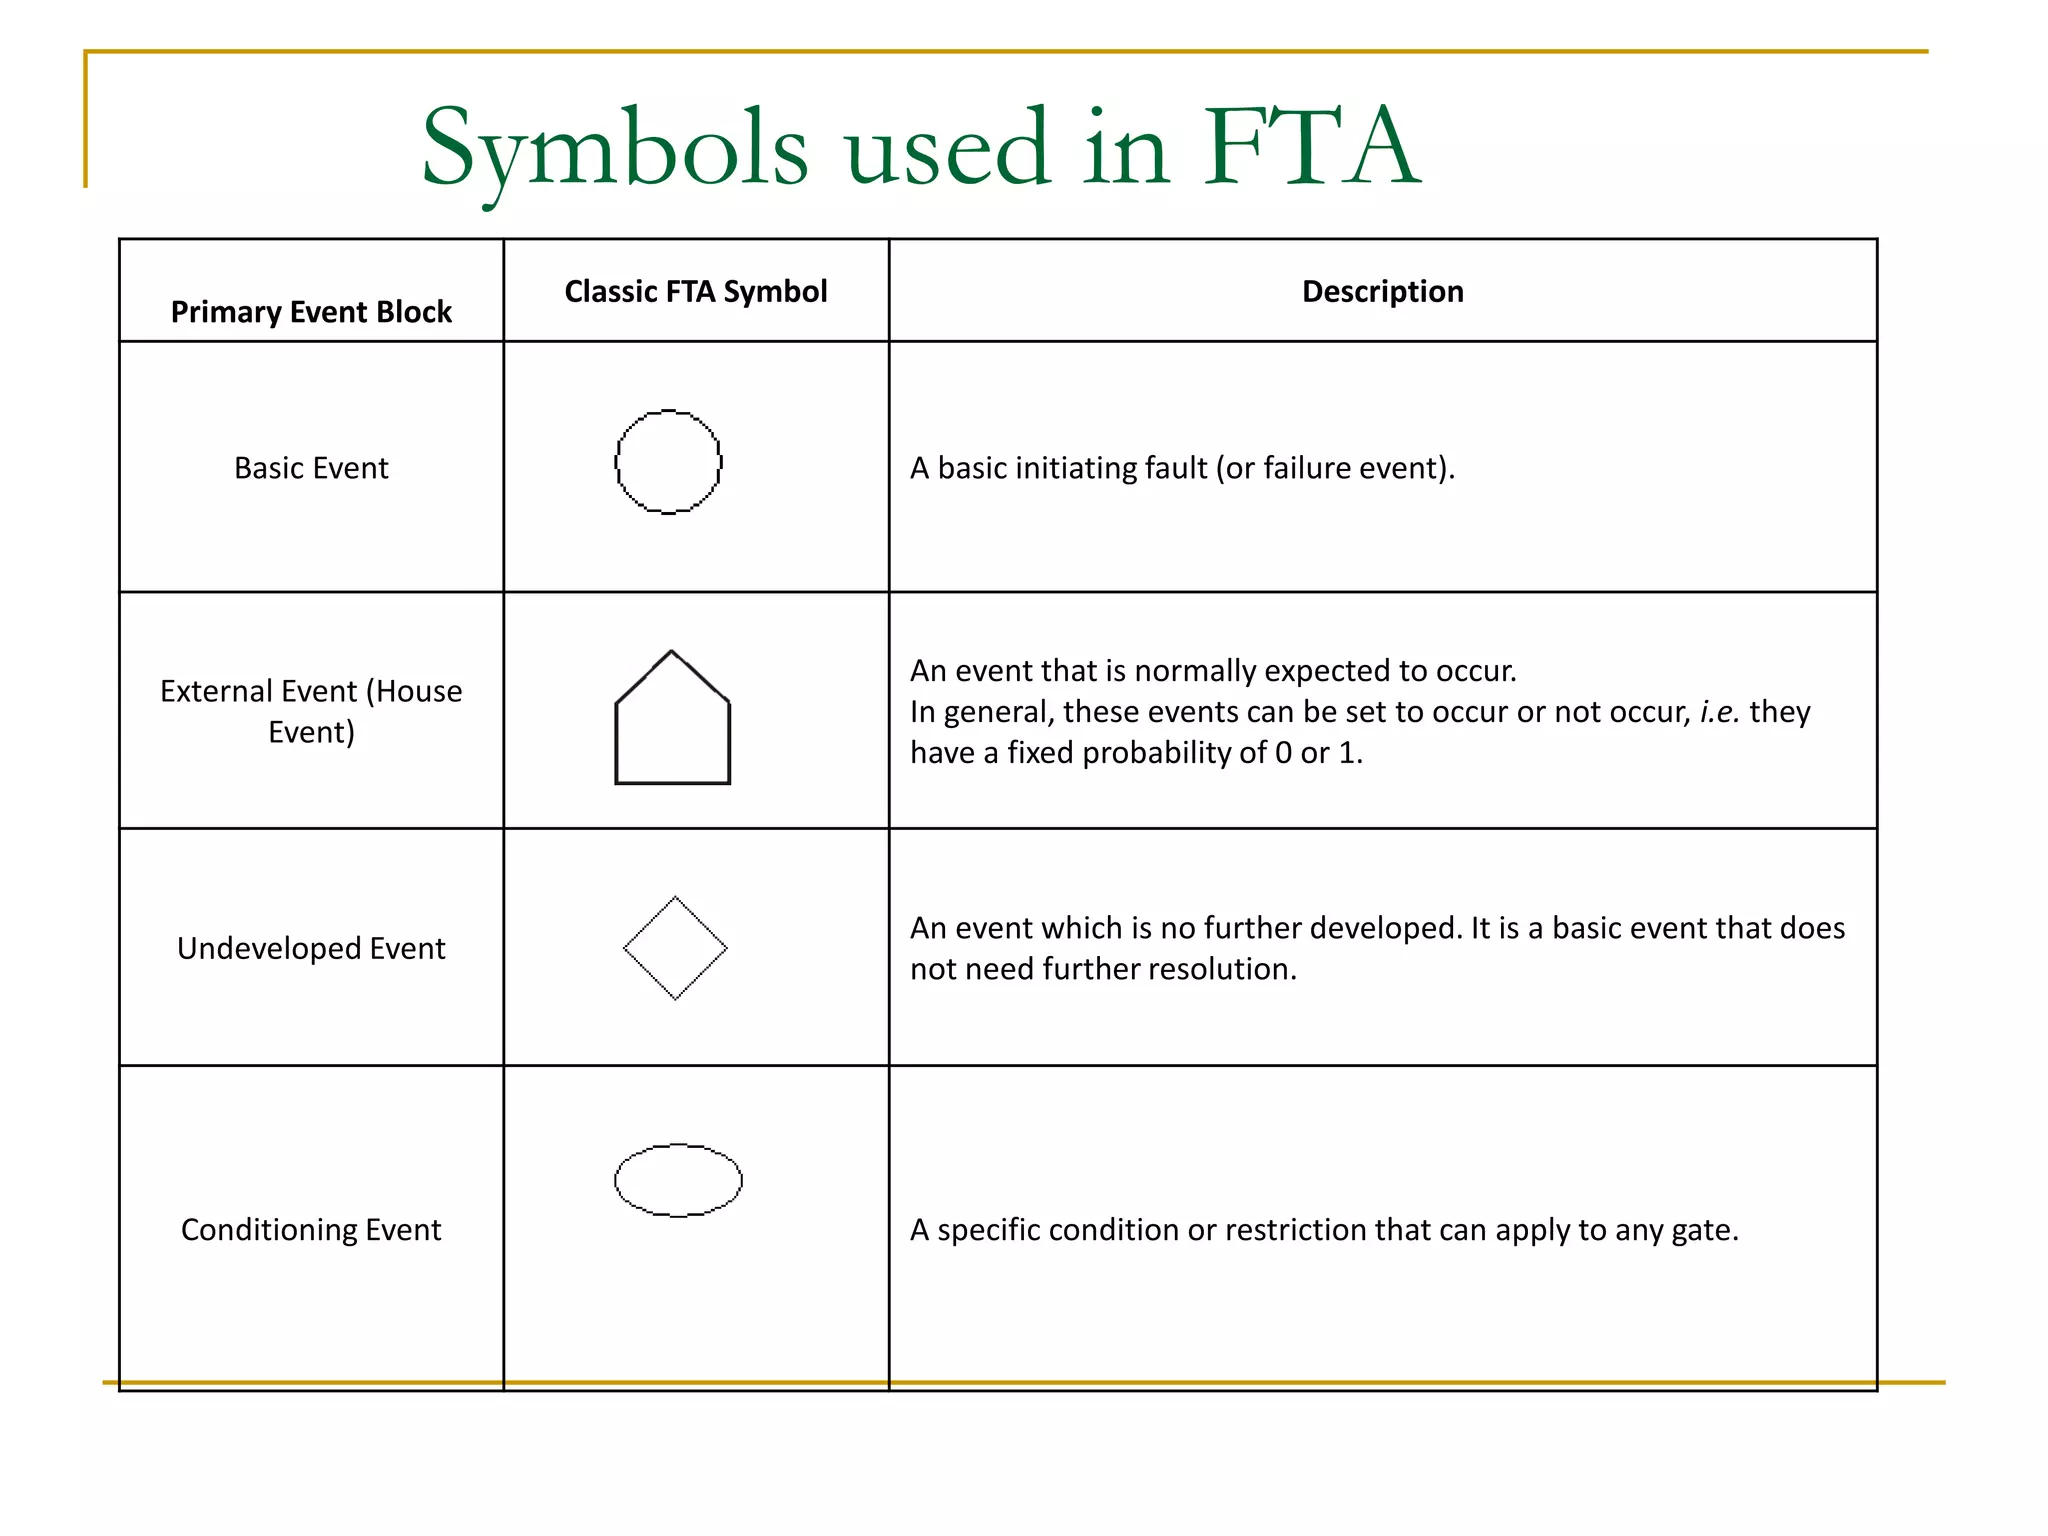
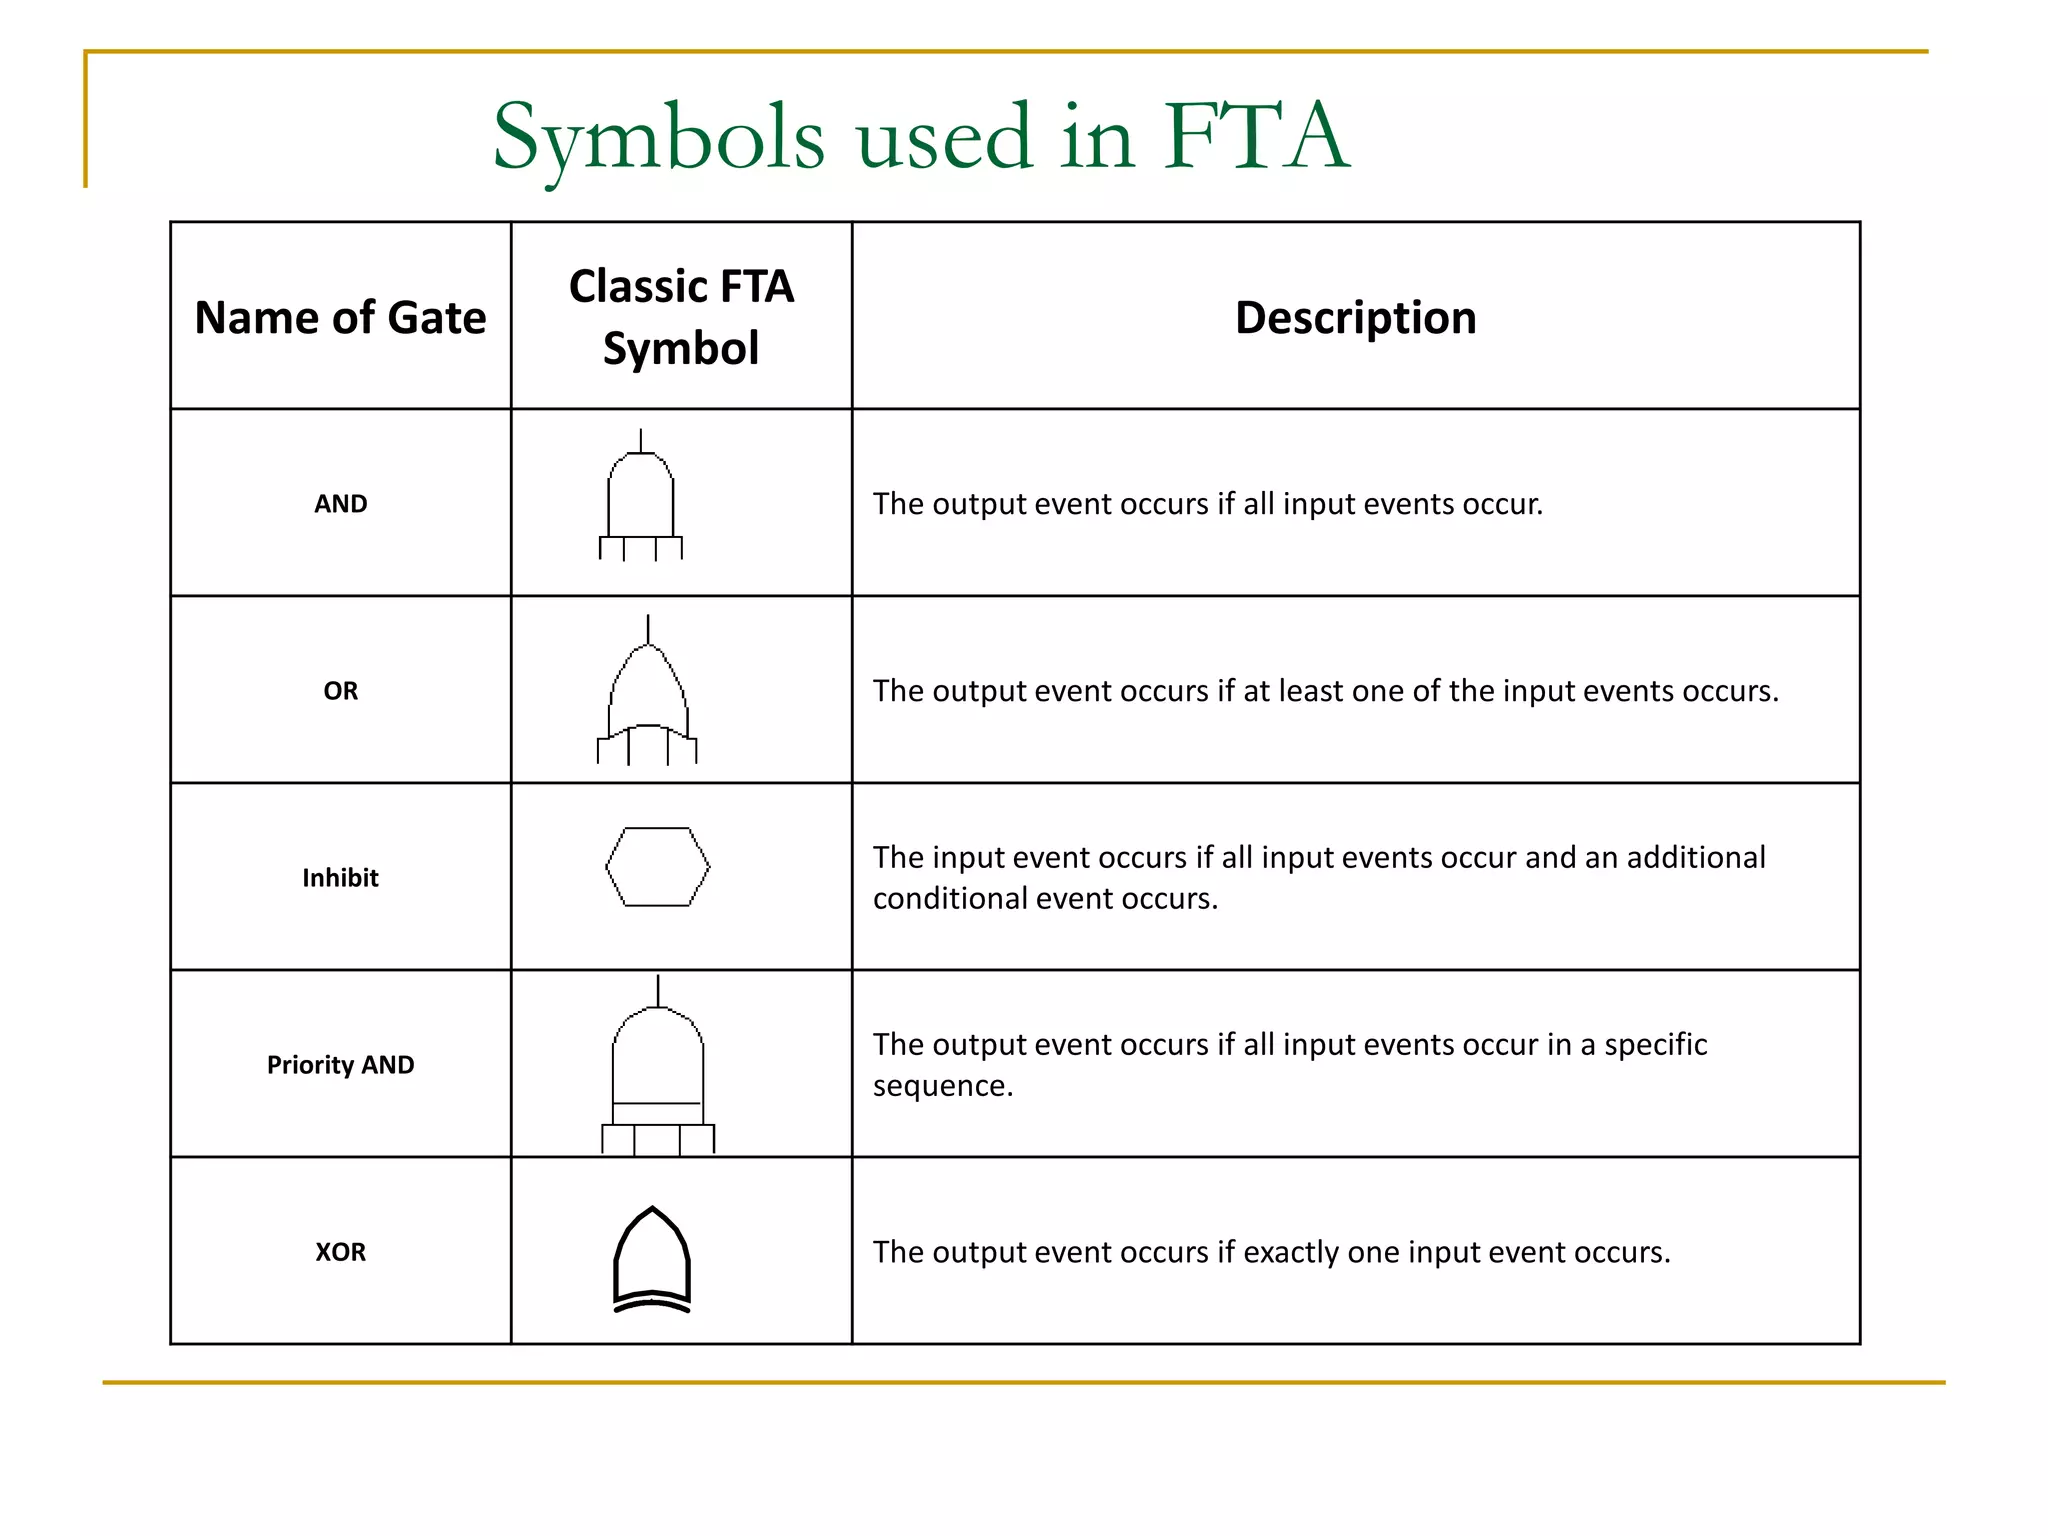
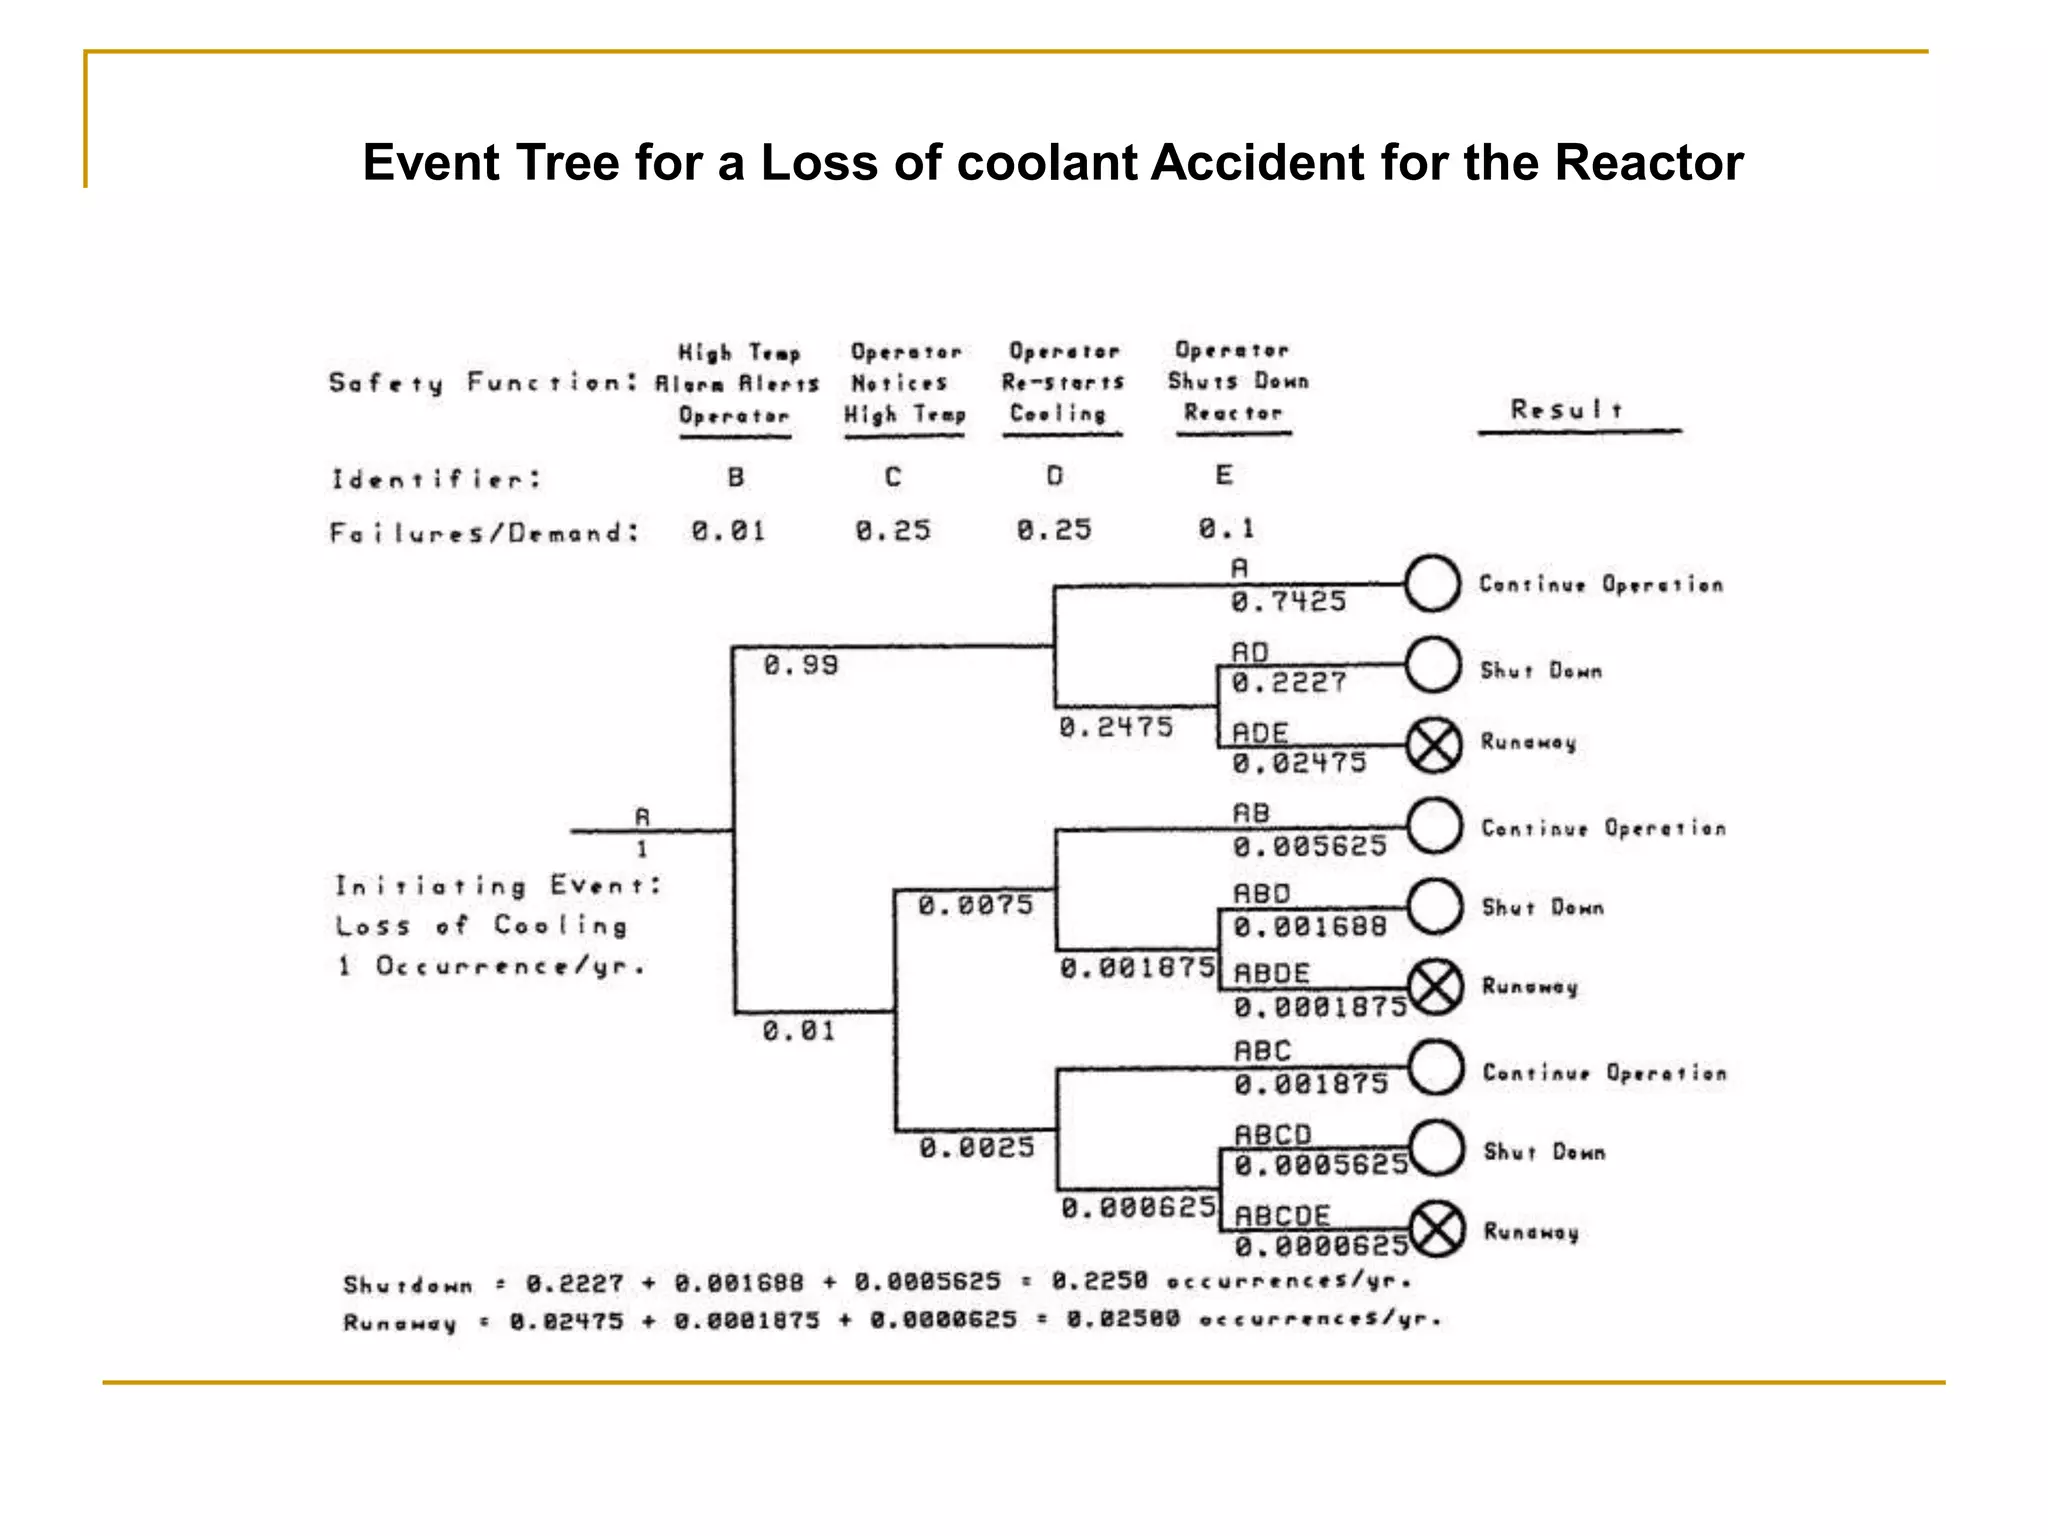
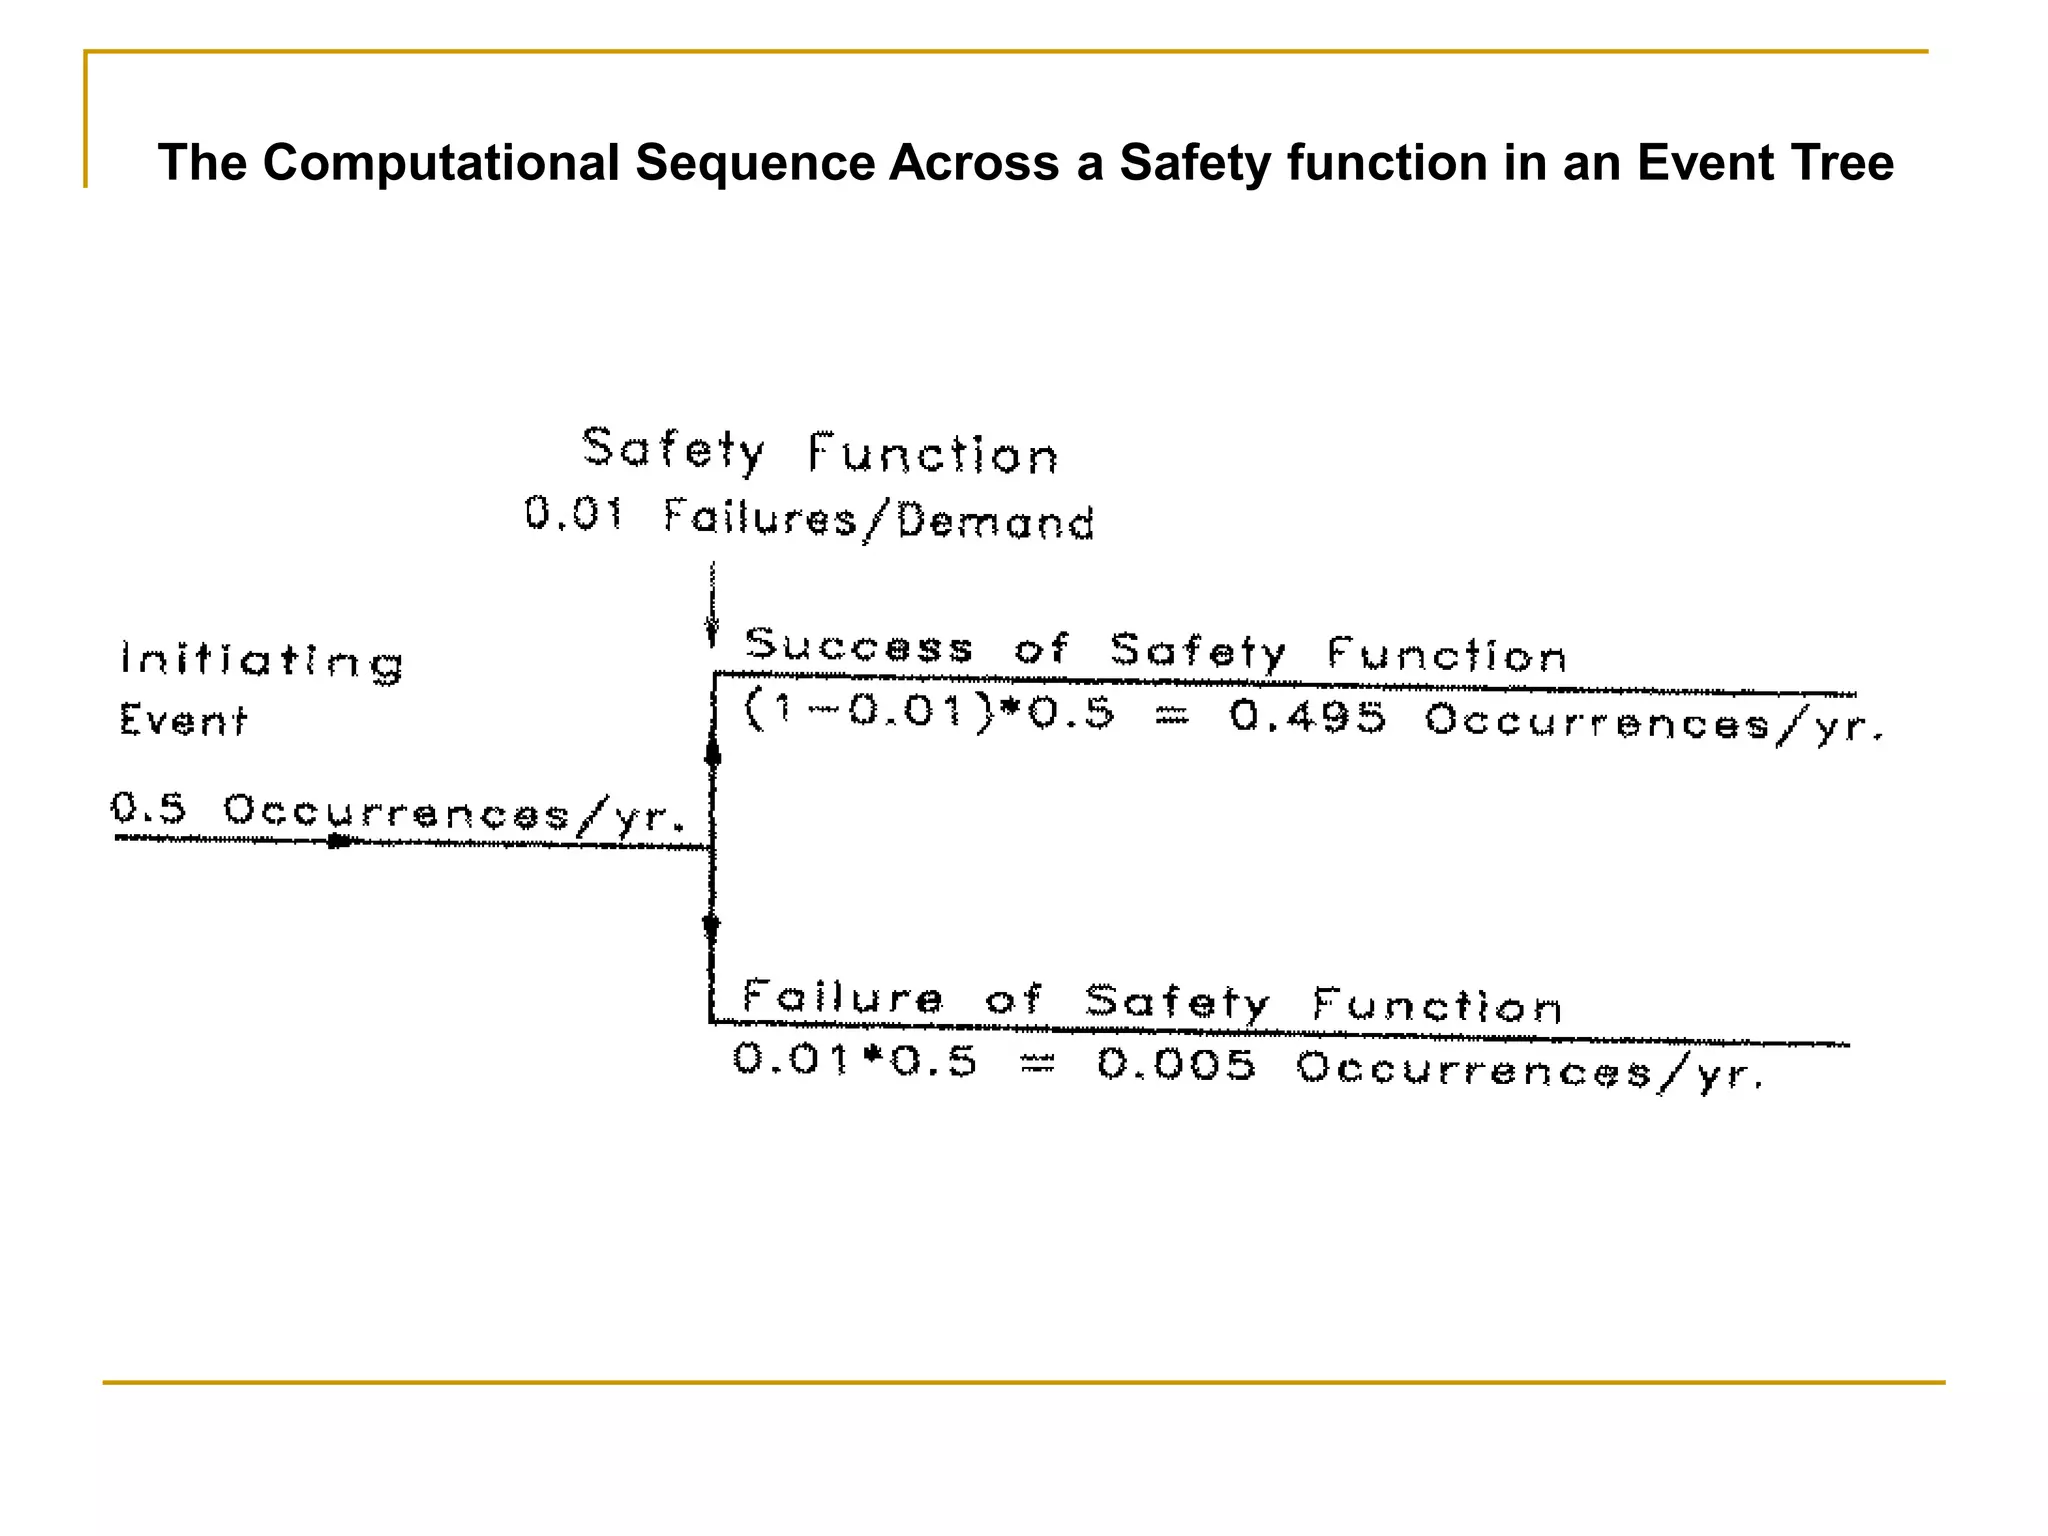
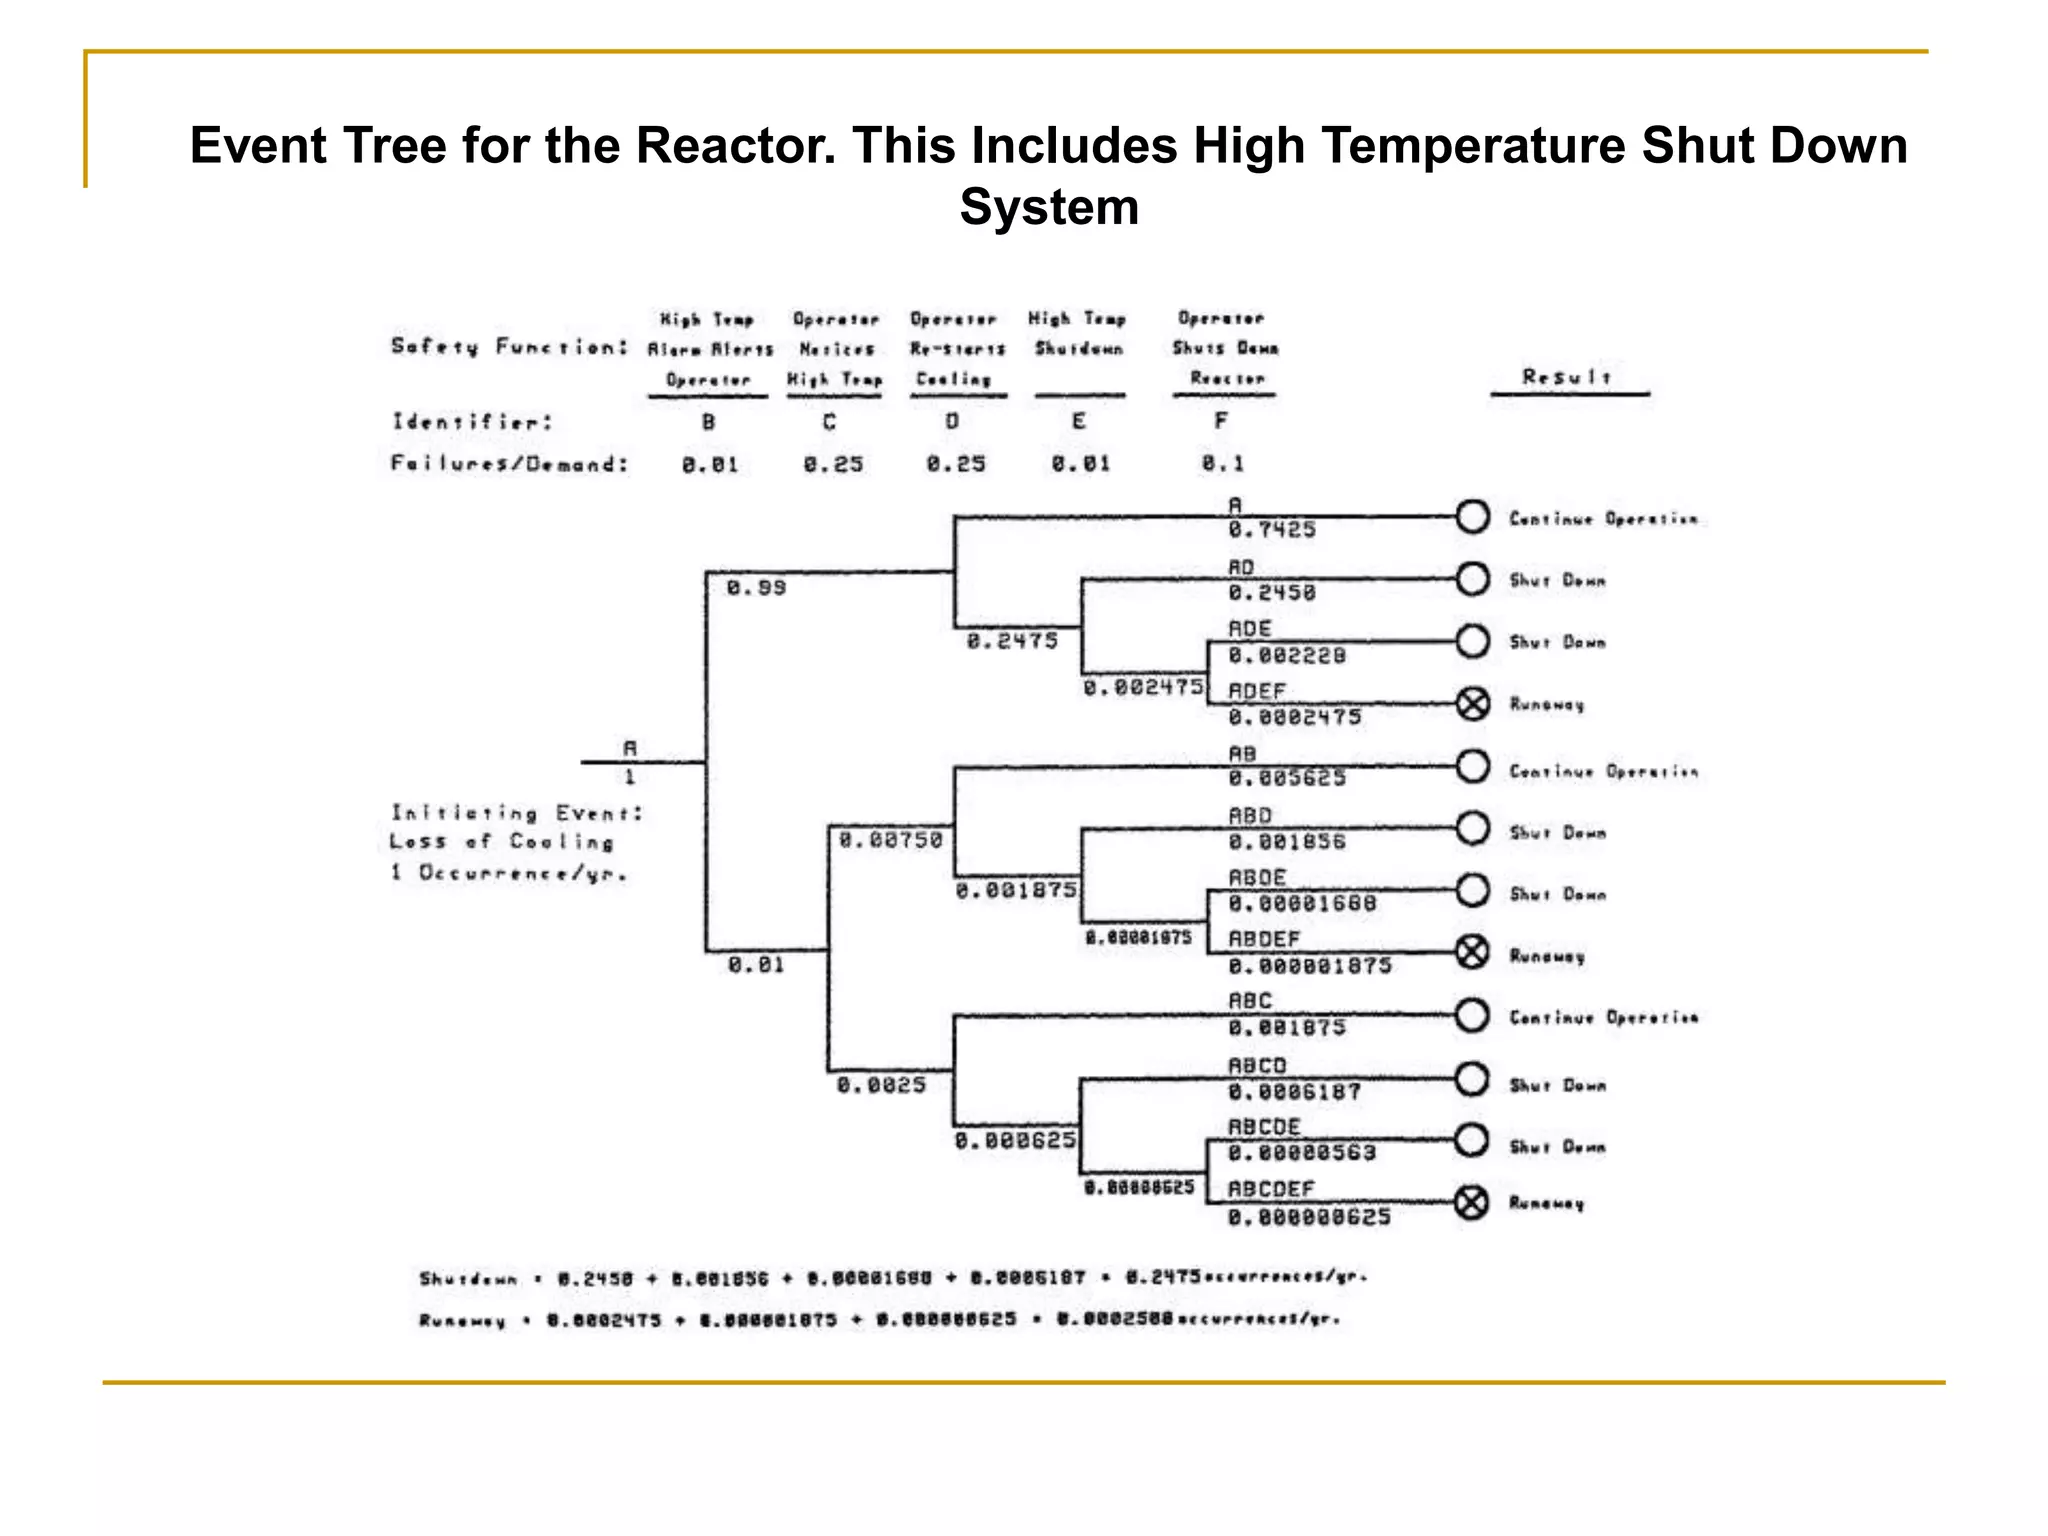
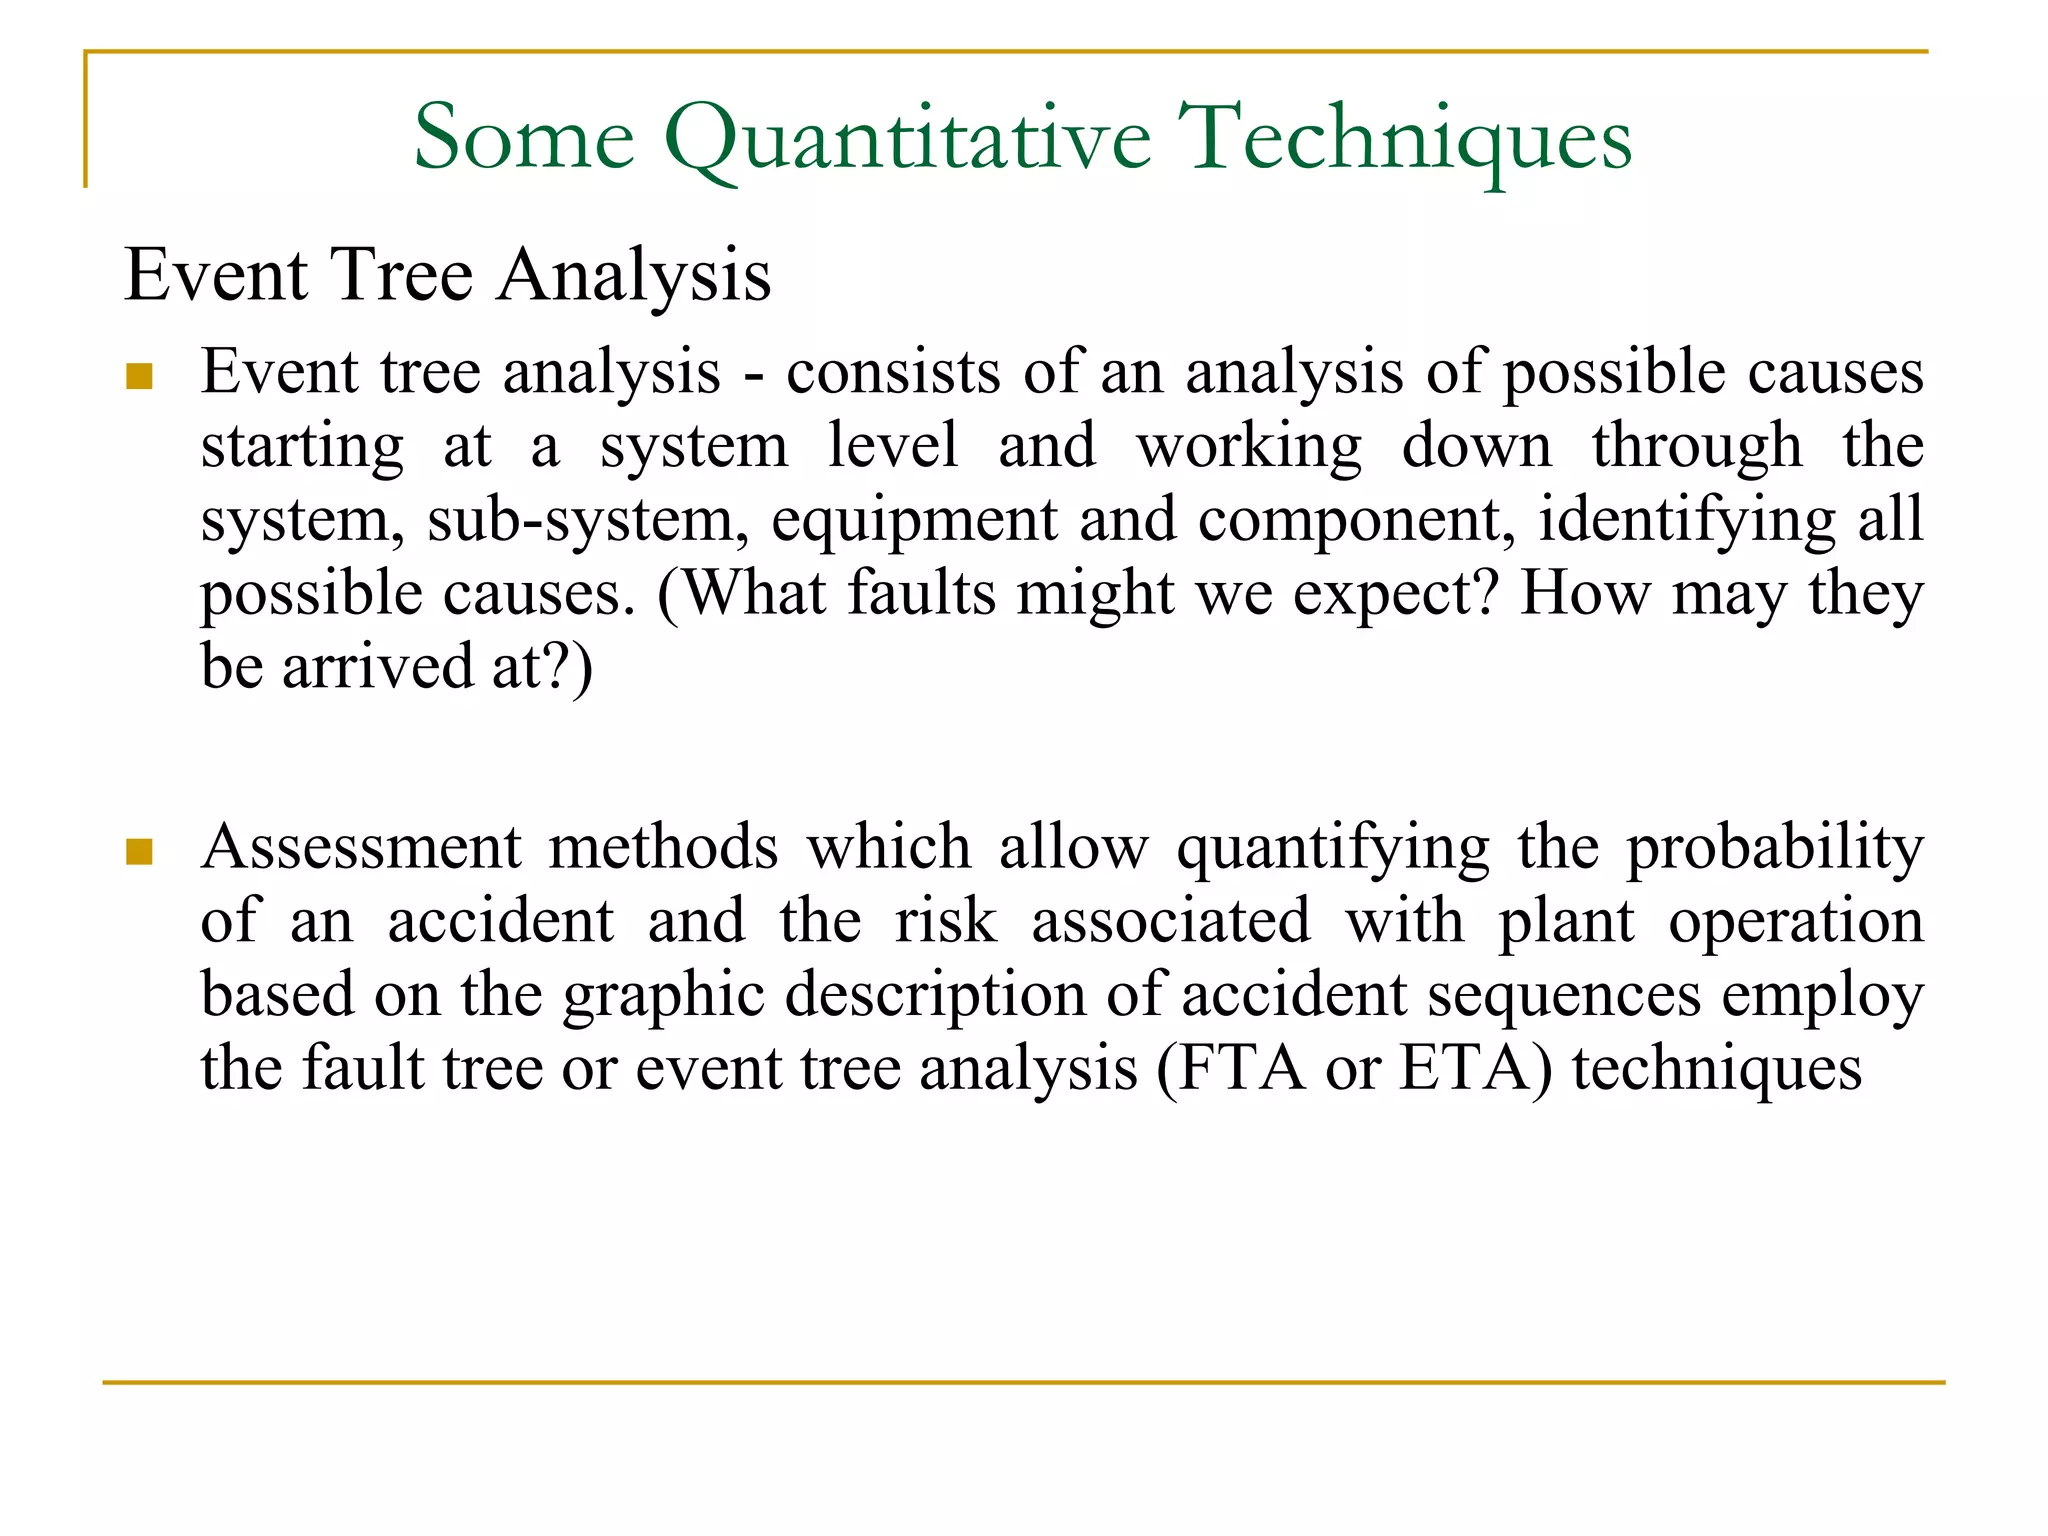
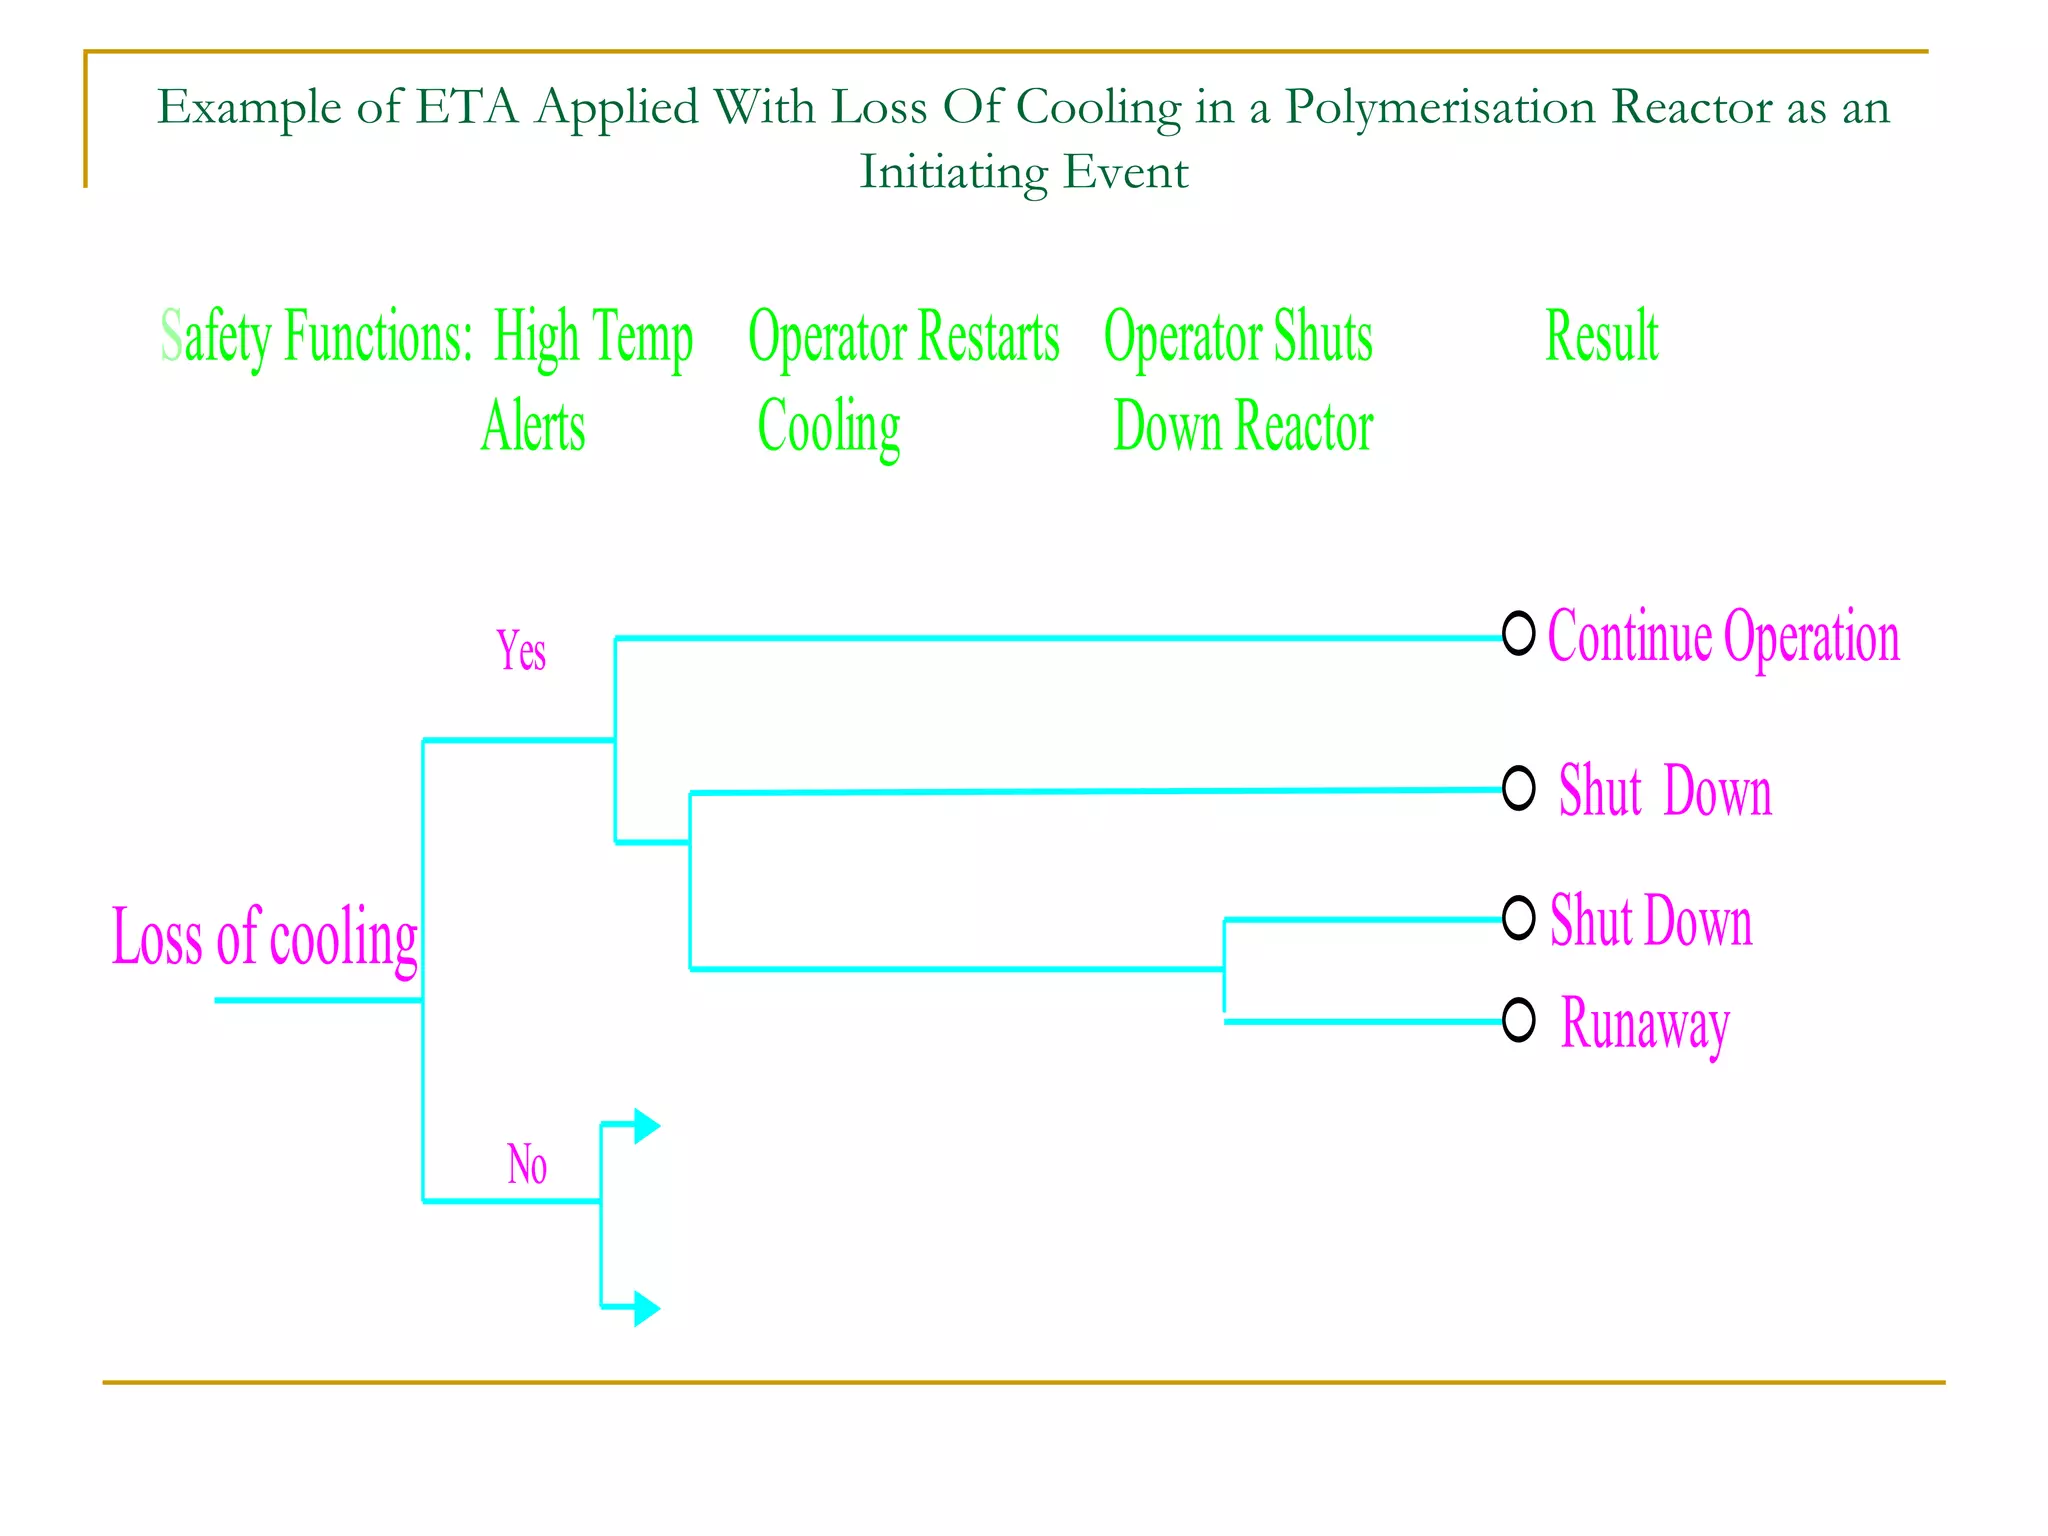
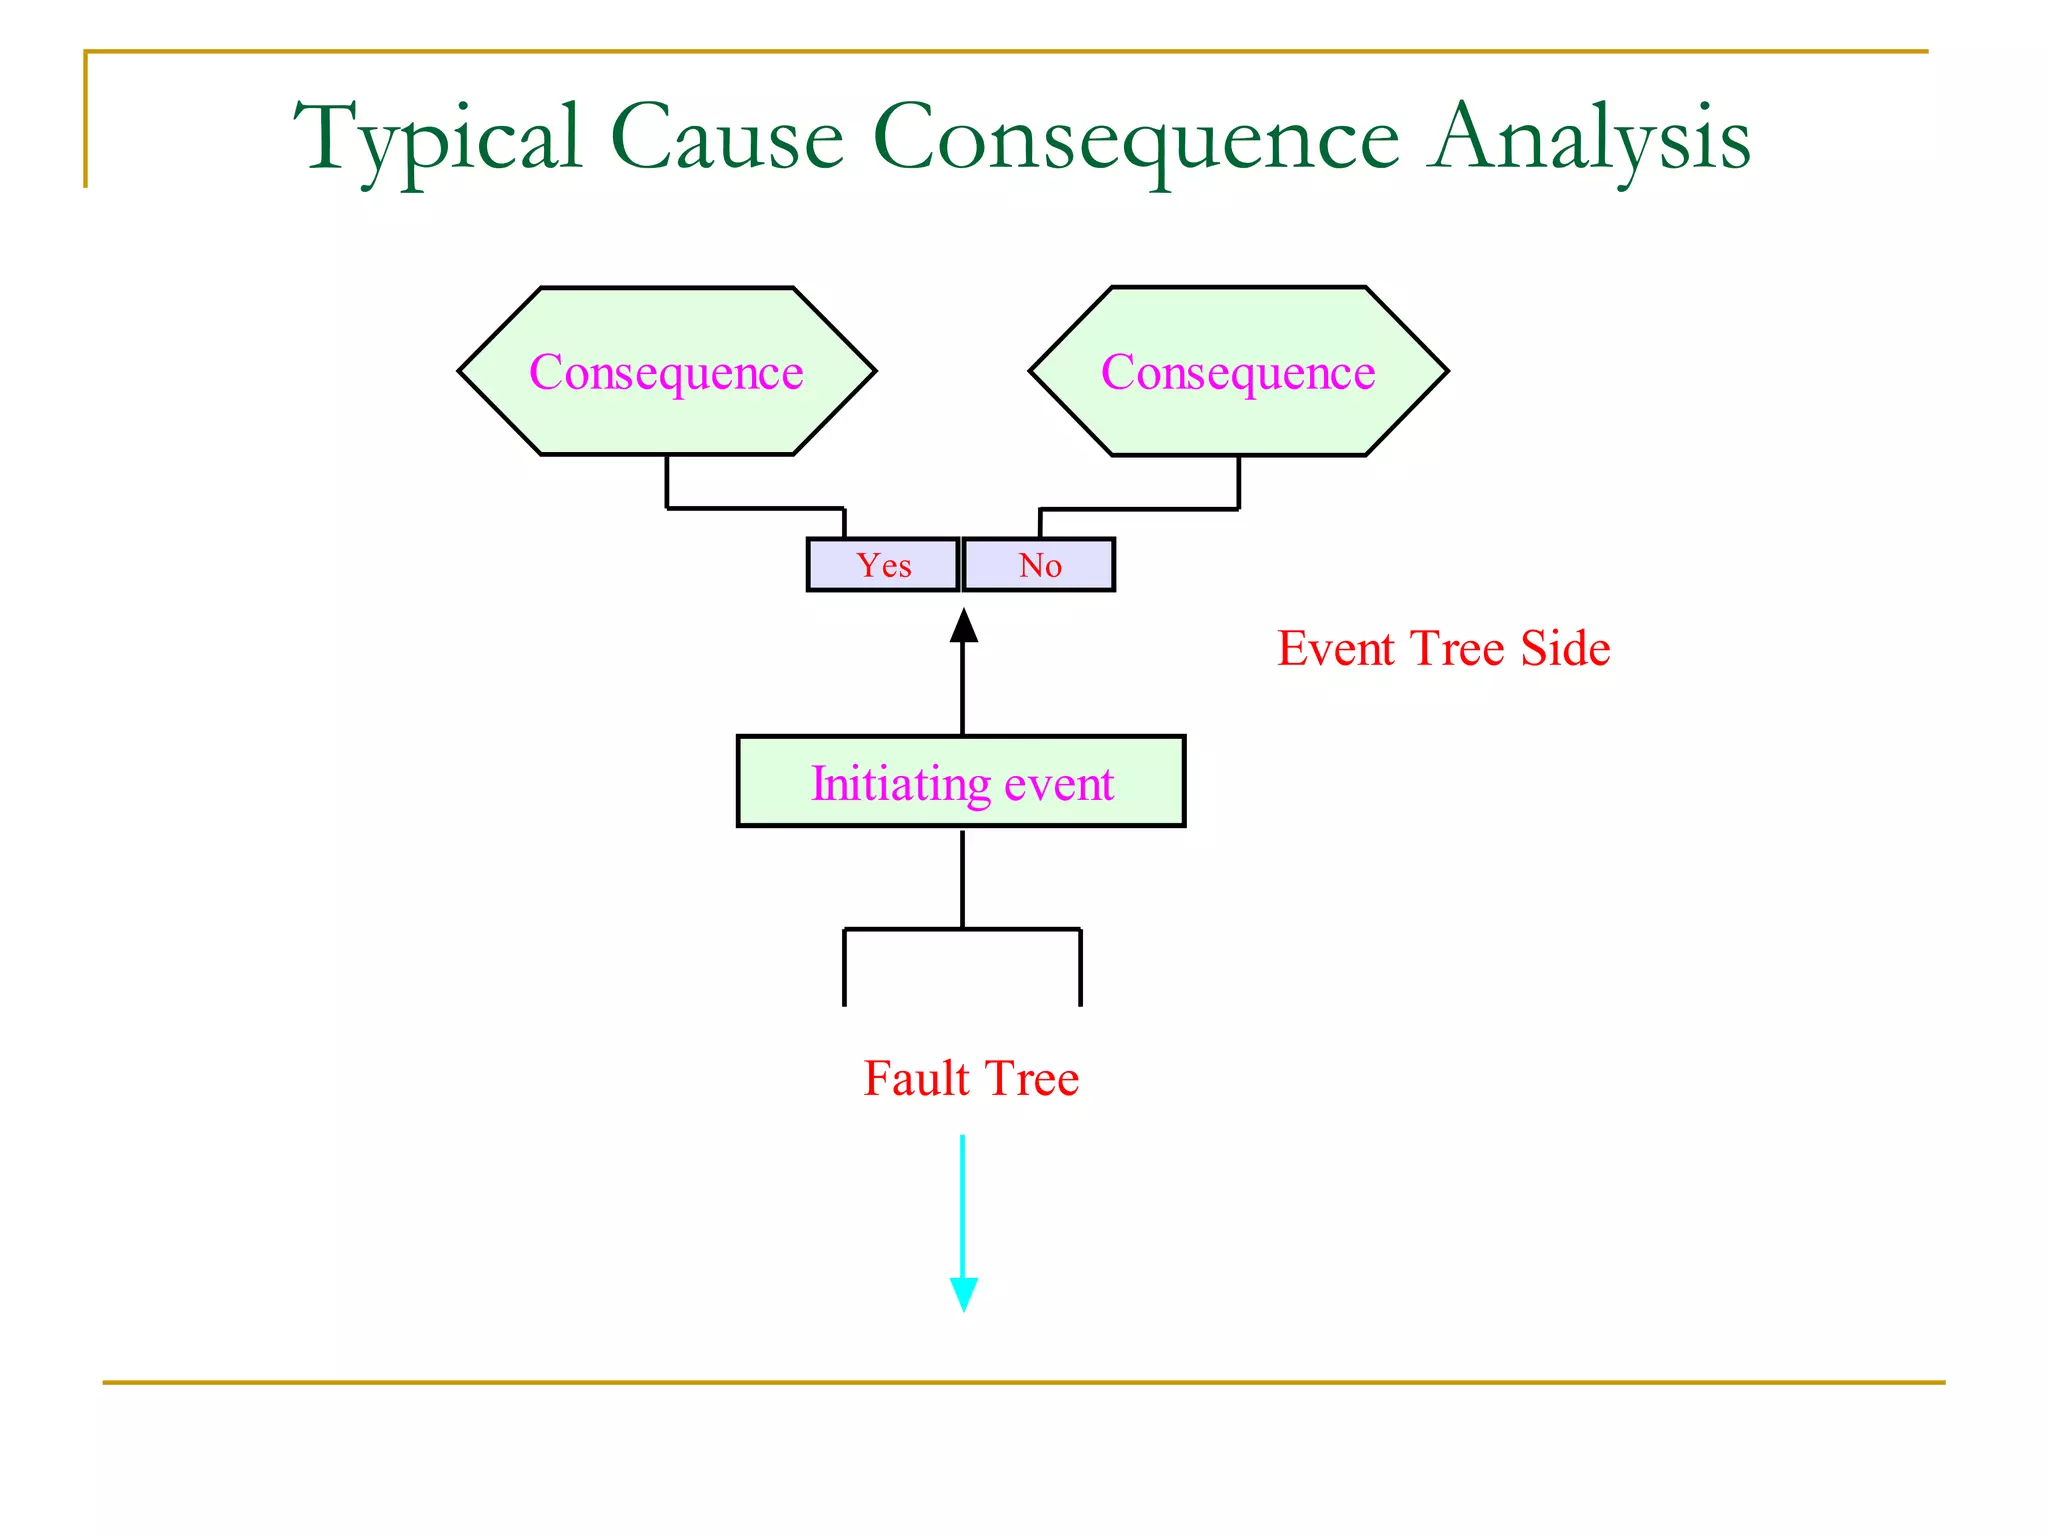


This document provides an overview of risk analysis. It defines key terms like risk, risk analysis, risk assessment, and risk management. It describes various qualitative and quantitative methods used for risk analysis, including hazard and operability studies, fault tree analysis, failure mode and effects analysis. The document discusses the importance of risk analysis for chemical processes and highlights some historical accidents to emphasize this. It also provides examples of applying different risk analysis methods.


