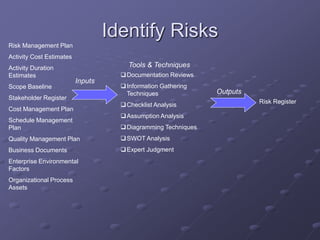
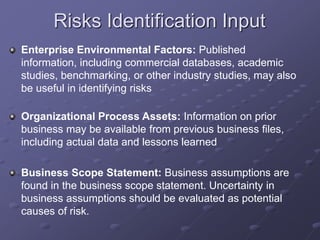
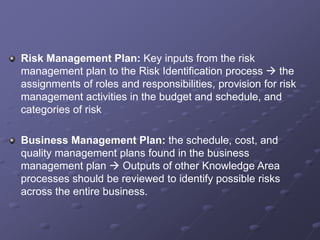
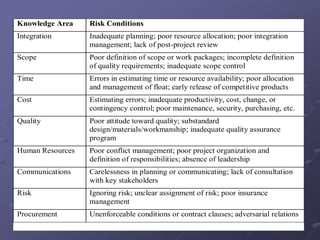
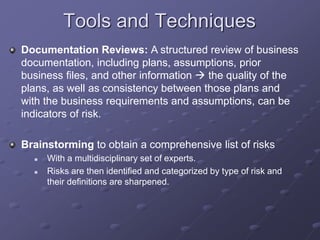
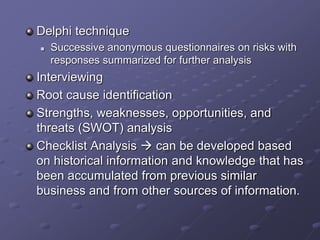
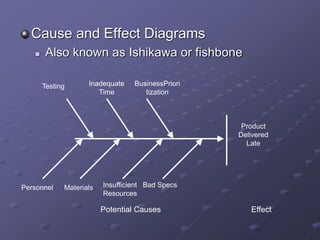
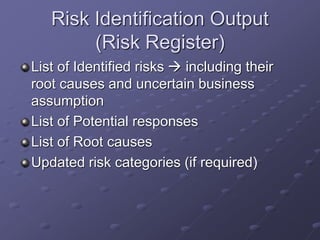
Risks Identification
Risk identification consists of determining which risks are
likely to affect the business and documenting the
characteristics of each
 should be performed on a regular basis
 should address both internal (can be controlled or influenced by
management) and external risks (beyond the control or
influence of the management)
 also concerned with opportunities (positive outcomes) as well as
threats (negative outcomes).
Risk identification may be accomplished by identifying
causes-and-effects (what could happen and what will
ensue) or effects-and-causes (what outcomes are to be
avoided or encouraged and how each might occur).
Identify Risks
Risk Management Plan
Activity Cost Estimates
Activity Duration
Estimates
Scope Baseline
Stakeholder Register
Cost Management Plan
Schedule Management
Plan
Quality Management Plan
Business Documents
Enterprise Environmental
Factors
Organizational Process
Assets
Risk Register
Documentation Reviews
Information Gathering
Techniques
Checklist Analysis
Assumption Analysis
Diagramming Techniques
SWOT Analysis
Expert Judgment
Inputs
Outputs
Tools & Techniques
Risks Identification Input
Enterprise Environmental Factors: Published
information, including commercial databases, academic
studies, benchmarking, or other industry studies, may also
be useful in identifying risks
Organizational Process Assets: Information on prior
business may be available from previous business files,
including actual data and lessons learned
Business Scope Statement: Business assumptions are
found in the business scope statement. Uncertainty in
business assumptions should be evaluated as potential
causes of risk.
Risk Management Plan: Key inputs from the risk
management plan to the Risk Identification process  the
assignments of roles and responsibilities, provision for risk
management activities in the budget and schedule, and
categories of risk
Business Management Plan: the schedule, cost, and
quality management plans found in the business
management plan  Outputs of other Knowledge Area
processes should be reviewed to identify possible risks
across the entire business.
Knowledge Area Risk Conditions
Integration Inadequate planning; poor resource allocation; poor integration
management; lack of post-project review
Scope Poor definition of scope or work packages; incomplete definition
of quality requirements; inadequate scope control
Time Errors in estimating time or resource availability; poor allocation
and management of float; early release of competitive products
Cost Estimating errors; inadequate productivity, cost, change, or
contingency control; poor maintenance, security, purchasing, etc.
Quality Poor attitude toward quality; substandard
design/materials/workmanship; inadequate quality assurance
program
Human Resources Poor conflict management; poor project organization and
definition of responsibilities; absence of leadership
Communications Carelessness in planning or communicating; lack of consultation
with key stakeholders
Risk Ignoring risk; unclear assignment of risk; poor insurance
management
Procurement Unenforceable conditions or contract clauses; adversarial relations
Tools and Techniques
Documentation Reviews: A structured review of business
documentation, including plans, assumptions, prior
business files, and other information  the quality of the
plans, as well as consistency between those plans and
with the business requirements and assumptions, can be
indicators of risk.
Brainstorming to obtain a comprehensive list of risks
 With a multidisciplinary set of experts.
 Risks are then identified and categorized by type of risk and
their definitions are sharpened.
Delphi technique
 Successive anonymous questionnaires on risks with
responses summarized for further analysis
Interviewing
Root cause identification
Strengths, weaknesses, opportunities, and
threats (SWOT) analysis
Checklist Analysis  can be developed based
on historical information and knowledge that has
been accumulated from previous similar
business and from other sources of information.
Cause and Effect Diagrams
 Also known as Ishikawa or fishbone
Product
Delivered
Late
Bad Specs
Insufficient
Resources
Inadequate
Time
BusinessPriori
tization
Testing
Materials
Potential Causes Effect
Personnel
Risk Identification Output
(Risk Register)
List of Identified risks  including their
root causes and uncertain business
assumption
List of Potential responses
List of Root causes
Updated risk categories (if required)
Perform Qualitative Risk
Analysis
Risk Register
Risk Management
Plan
Business Scope
Statement
Organizational
Process Assets
Risk Register
Updates
Risk probability and impact
statement
Probability and impact matrix
Risk data quality assessment
Risk categorization
Risk urgency assessment
Expert Judgement
Inputs
Outputs
Tools & Techniques
Input of Qualitative Risk Analysis
Organizational Process Assets: Data about risks on past
and the lessons learned knowledge base
Business Scope Statement
Risk Management Plan  include roles and
responsibilities for conducting risk management, budgets,
and schedule activities for risk management, risk
categories, definition of probability and impact, the
probability and impact matrix, and revised stakeholders’
risk tolerances (also enterprise environmental factors)
Risk register
Methodologies
Probability and Impact Matrix
 Based on Failure Modes and Effects
Analysis (FMEA)
 From 1950’s analysis of military systems
Define Probability Scale & Impact Scale
Likelihood Class
Likelihood of Occurrence
(events/year)
Not Likely (NL)
<0.01% chance of
occurrence
Low (L)
0.01 - 0.1% chance of
occurrence
Moderate (M)
0.1 - 1% chance of
occurrence
High (H)
1 - 10% chance of
occurrence
Expected (E) >10% chance of occurrence
Probability Scale
Consequence Health and Safety
Extreme
Fatality or multiple fatalities
expected
High
Severe injury or disability likely; or
some potential for fatality
Moderate
Lost time or injury likely; or some
potential for serious injuries; or
small risk of fatality
Low
First aid required; or small risk of
serious injury
Negligible No concern
Impact Scale
Probability and Impact Plots
Rate each
risk on
scales
then plot
on matrix
Develop
mitigation
technique
for risks
above
tolerance
Output of Qualitative Risk Analysis
(Risk Register Update)
Relative ranking or priority list of risks  Risks may be
listed by priority separately for cost, time, scope, and
quality since organizations may value one objective over
another.
Risks grouped by categories.
 can reveal common root causes of risk areas requiring particular
attention.
 improve the effectiveness of risk responses.
List of risks requiring response in the near-term
List of risks for additional analysis and response
Risk Register

Risk Identification.ppt

  • 1.
    Risks Identification Risk identificationconsists of determining which risks are likely to affect the business and documenting the characteristics of each  should be performed on a regular basis  should address both internal (can be controlled or influenced by management) and external risks (beyond the control or influence of the management)  also concerned with opportunities (positive outcomes) as well as threats (negative outcomes). Risk identification may be accomplished by identifying causes-and-effects (what could happen and what will ensue) or effects-and-causes (what outcomes are to be avoided or encouraged and how each might occur).
  • 2.
    Identify Risks Risk ManagementPlan Activity Cost Estimates Activity Duration Estimates Scope Baseline Stakeholder Register Cost Management Plan Schedule Management Plan Quality Management Plan Business Documents Enterprise Environmental Factors Organizational Process Assets Risk Register Documentation Reviews Information Gathering Techniques Checklist Analysis Assumption Analysis Diagramming Techniques SWOT Analysis Expert Judgment Inputs Outputs Tools & Techniques
  • 3.
    Risks Identification Input EnterpriseEnvironmental Factors: Published information, including commercial databases, academic studies, benchmarking, or other industry studies, may also be useful in identifying risks Organizational Process Assets: Information on prior business may be available from previous business files, including actual data and lessons learned Business Scope Statement: Business assumptions are found in the business scope statement. Uncertainty in business assumptions should be evaluated as potential causes of risk.
  • 4.
    Risk Management Plan:Key inputs from the risk management plan to the Risk Identification process  the assignments of roles and responsibilities, provision for risk management activities in the budget and schedule, and categories of risk Business Management Plan: the schedule, cost, and quality management plans found in the business management plan  Outputs of other Knowledge Area processes should be reviewed to identify possible risks across the entire business.
  • 5.
    Knowledge Area RiskConditions Integration Inadequate planning; poor resource allocation; poor integration management; lack of post-project review Scope Poor definition of scope or work packages; incomplete definition of quality requirements; inadequate scope control Time Errors in estimating time or resource availability; poor allocation and management of float; early release of competitive products Cost Estimating errors; inadequate productivity, cost, change, or contingency control; poor maintenance, security, purchasing, etc. Quality Poor attitude toward quality; substandard design/materials/workmanship; inadequate quality assurance program Human Resources Poor conflict management; poor project organization and definition of responsibilities; absence of leadership Communications Carelessness in planning or communicating; lack of consultation with key stakeholders Risk Ignoring risk; unclear assignment of risk; poor insurance management Procurement Unenforceable conditions or contract clauses; adversarial relations
  • 6.
    Tools and Techniques DocumentationReviews: A structured review of business documentation, including plans, assumptions, prior business files, and other information  the quality of the plans, as well as consistency between those plans and with the business requirements and assumptions, can be indicators of risk. Brainstorming to obtain a comprehensive list of risks  With a multidisciplinary set of experts.  Risks are then identified and categorized by type of risk and their definitions are sharpened.
  • 7.
    Delphi technique  Successiveanonymous questionnaires on risks with responses summarized for further analysis Interviewing Root cause identification Strengths, weaknesses, opportunities, and threats (SWOT) analysis Checklist Analysis  can be developed based on historical information and knowledge that has been accumulated from previous similar business and from other sources of information.
  • 8.
    Cause and EffectDiagrams  Also known as Ishikawa or fishbone Product Delivered Late Bad Specs Insufficient Resources Inadequate Time BusinessPriori tization Testing Materials Potential Causes Effect Personnel
  • 9.
    Risk Identification Output (RiskRegister) List of Identified risks  including their root causes and uncertain business assumption List of Potential responses List of Root causes Updated risk categories (if required)
  • 10.
    Perform Qualitative Risk Analysis RiskRegister Risk Management Plan Business Scope Statement Organizational Process Assets Risk Register Updates Risk probability and impact statement Probability and impact matrix Risk data quality assessment Risk categorization Risk urgency assessment Expert Judgement Inputs Outputs Tools & Techniques
  • 11.
    Input of QualitativeRisk Analysis Organizational Process Assets: Data about risks on past and the lessons learned knowledge base Business Scope Statement Risk Management Plan  include roles and responsibilities for conducting risk management, budgets, and schedule activities for risk management, risk categories, definition of probability and impact, the probability and impact matrix, and revised stakeholders’ risk tolerances (also enterprise environmental factors) Risk register
  • 12.
    Methodologies Probability and ImpactMatrix  Based on Failure Modes and Effects Analysis (FMEA)  From 1950’s analysis of military systems
  • 13.
    Define Probability Scale& Impact Scale Likelihood Class Likelihood of Occurrence (events/year) Not Likely (NL) <0.01% chance of occurrence Low (L) 0.01 - 0.1% chance of occurrence Moderate (M) 0.1 - 1% chance of occurrence High (H) 1 - 10% chance of occurrence Expected (E) >10% chance of occurrence Probability Scale Consequence Health and Safety Extreme Fatality or multiple fatalities expected High Severe injury or disability likely; or some potential for fatality Moderate Lost time or injury likely; or some potential for serious injuries; or small risk of fatality Low First aid required; or small risk of serious injury Negligible No concern Impact Scale
  • 14.
    Probability and ImpactPlots Rate each risk on scales then plot on matrix Develop mitigation technique for risks above tolerance
  • 15.
    Output of QualitativeRisk Analysis (Risk Register Update) Relative ranking or priority list of risks  Risks may be listed by priority separately for cost, time, scope, and quality since organizations may value one objective over another. Risks grouped by categories.  can reveal common root causes of risk areas requiring particular attention.  improve the effectiveness of risk responses. List of risks requiring response in the near-term List of risks for additional analysis and response
  • 16.