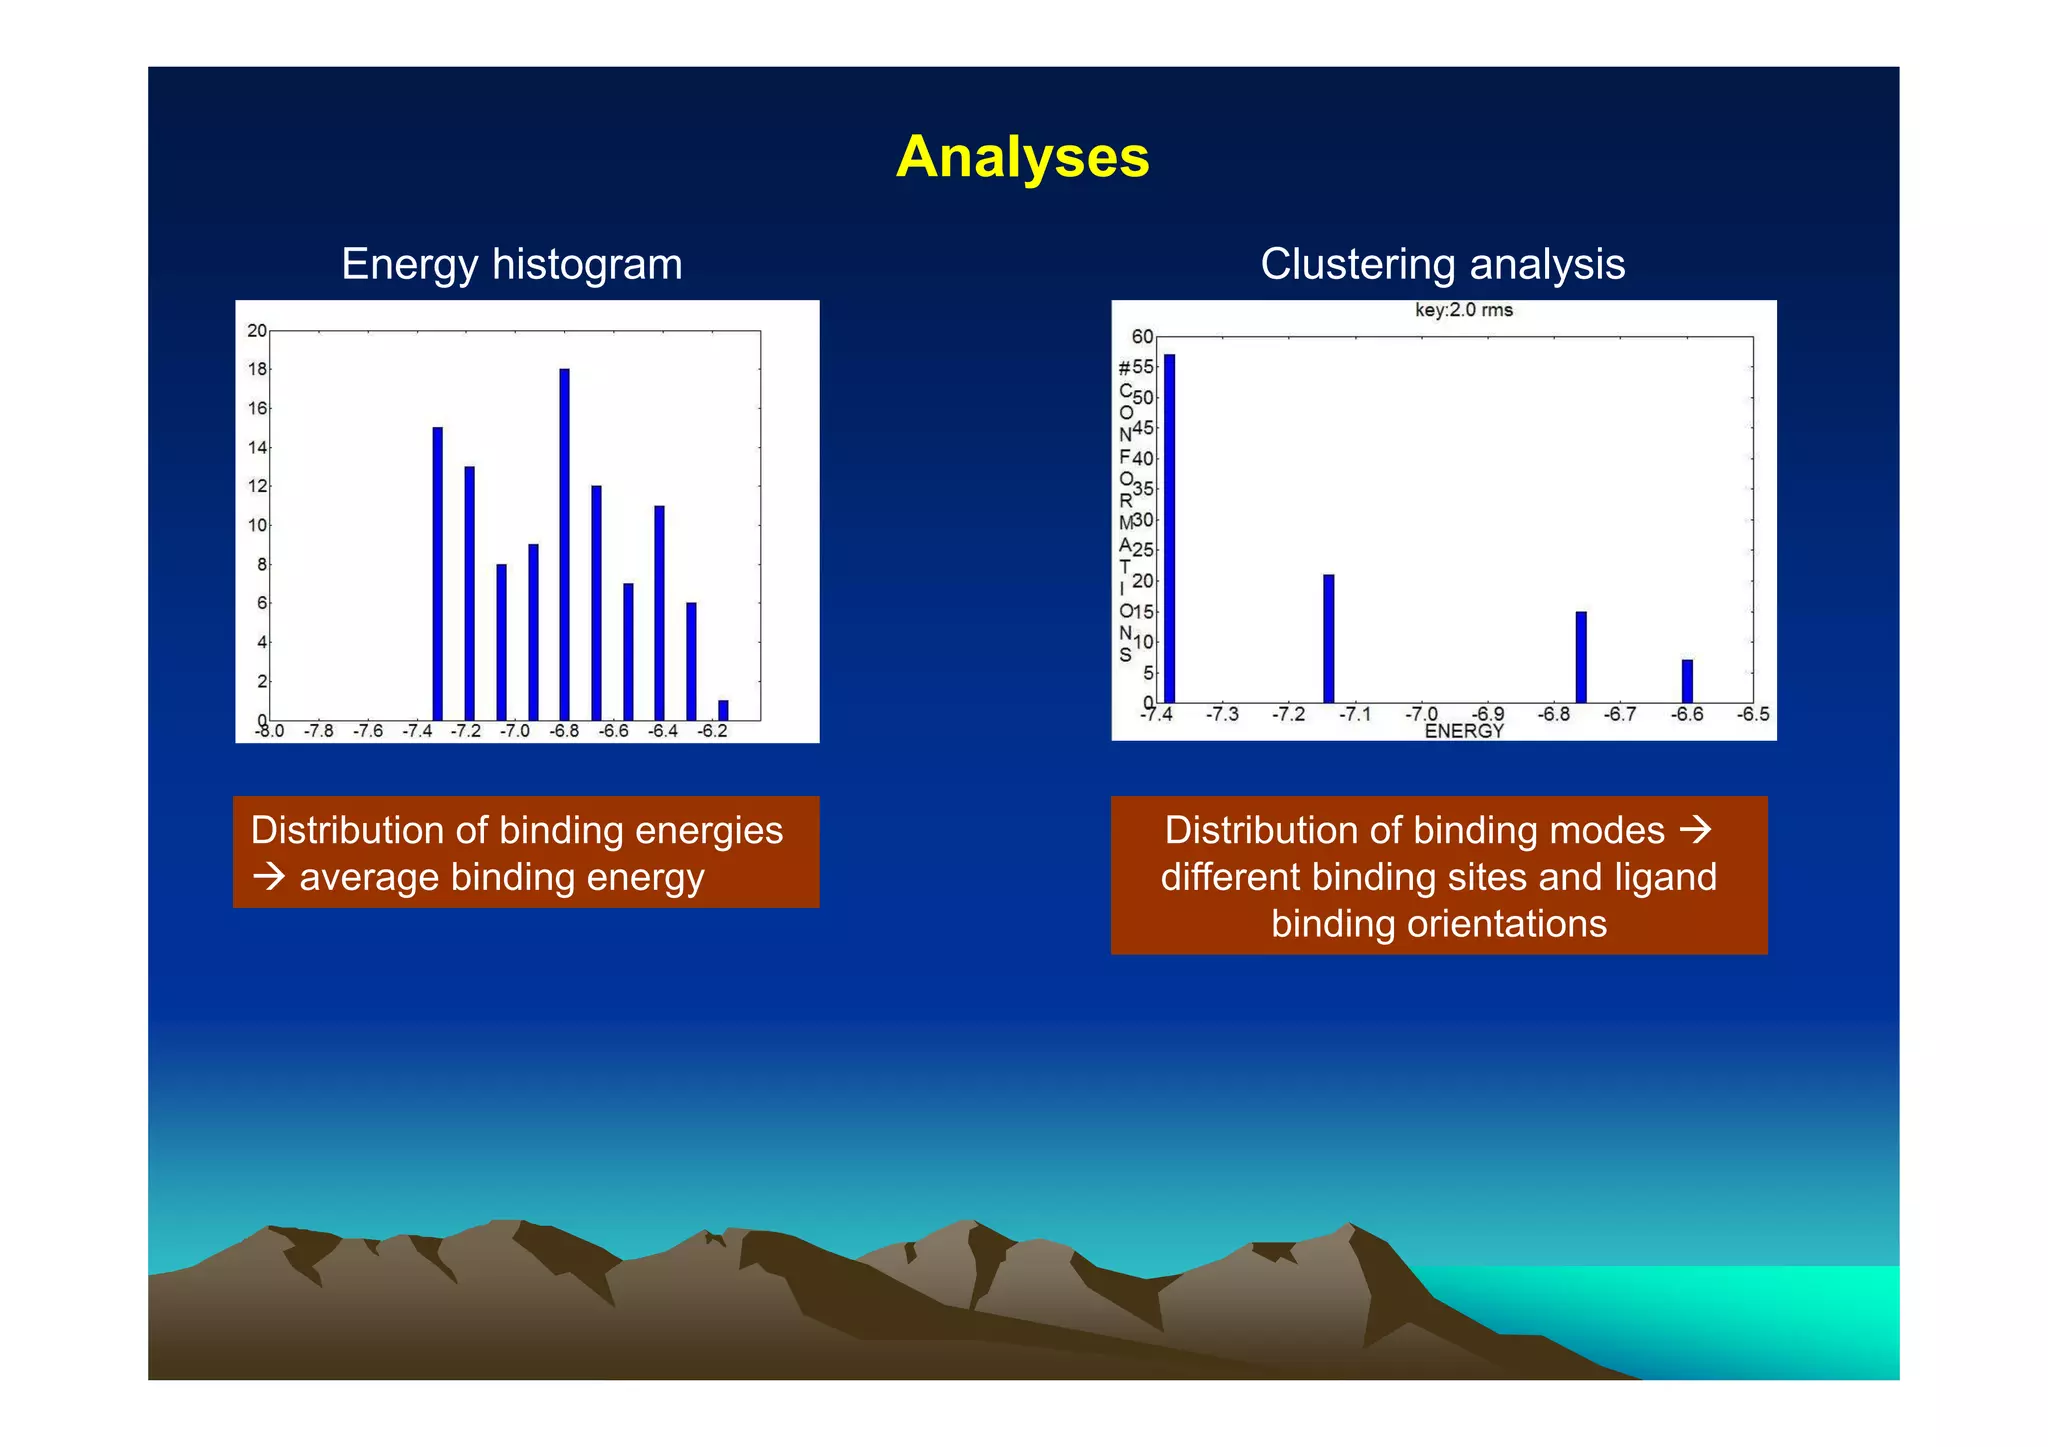
Download as PDF, PPTX
![Binding Affinity
Association equilibrium constant
[ RL ]s
Ka =
[ R ]s [ L ]s
b
∆Gg
+
∆Gsolv ( R )
∆Gsolv ( L )
Free energy of binding:
b
∆Gs = ∆H − T ∆S = − RT ln K a
Enthalpy Entropy
+
From the thermodynamic cycle:
b
b
∆Gs = ∆Gg + ∆Gsolv ( RL ) − {∆Gsolv ( R ) + ∆Gsolv ( L )}
b
∆Gs
∆Gsolv ( RL )](https://image.slidesharecdn.com/structurebasedcomputer-aideddrugdesign-131024112119-phpapp01/75/Structure-based-computer-aided-drug-design-9-2048.jpg)
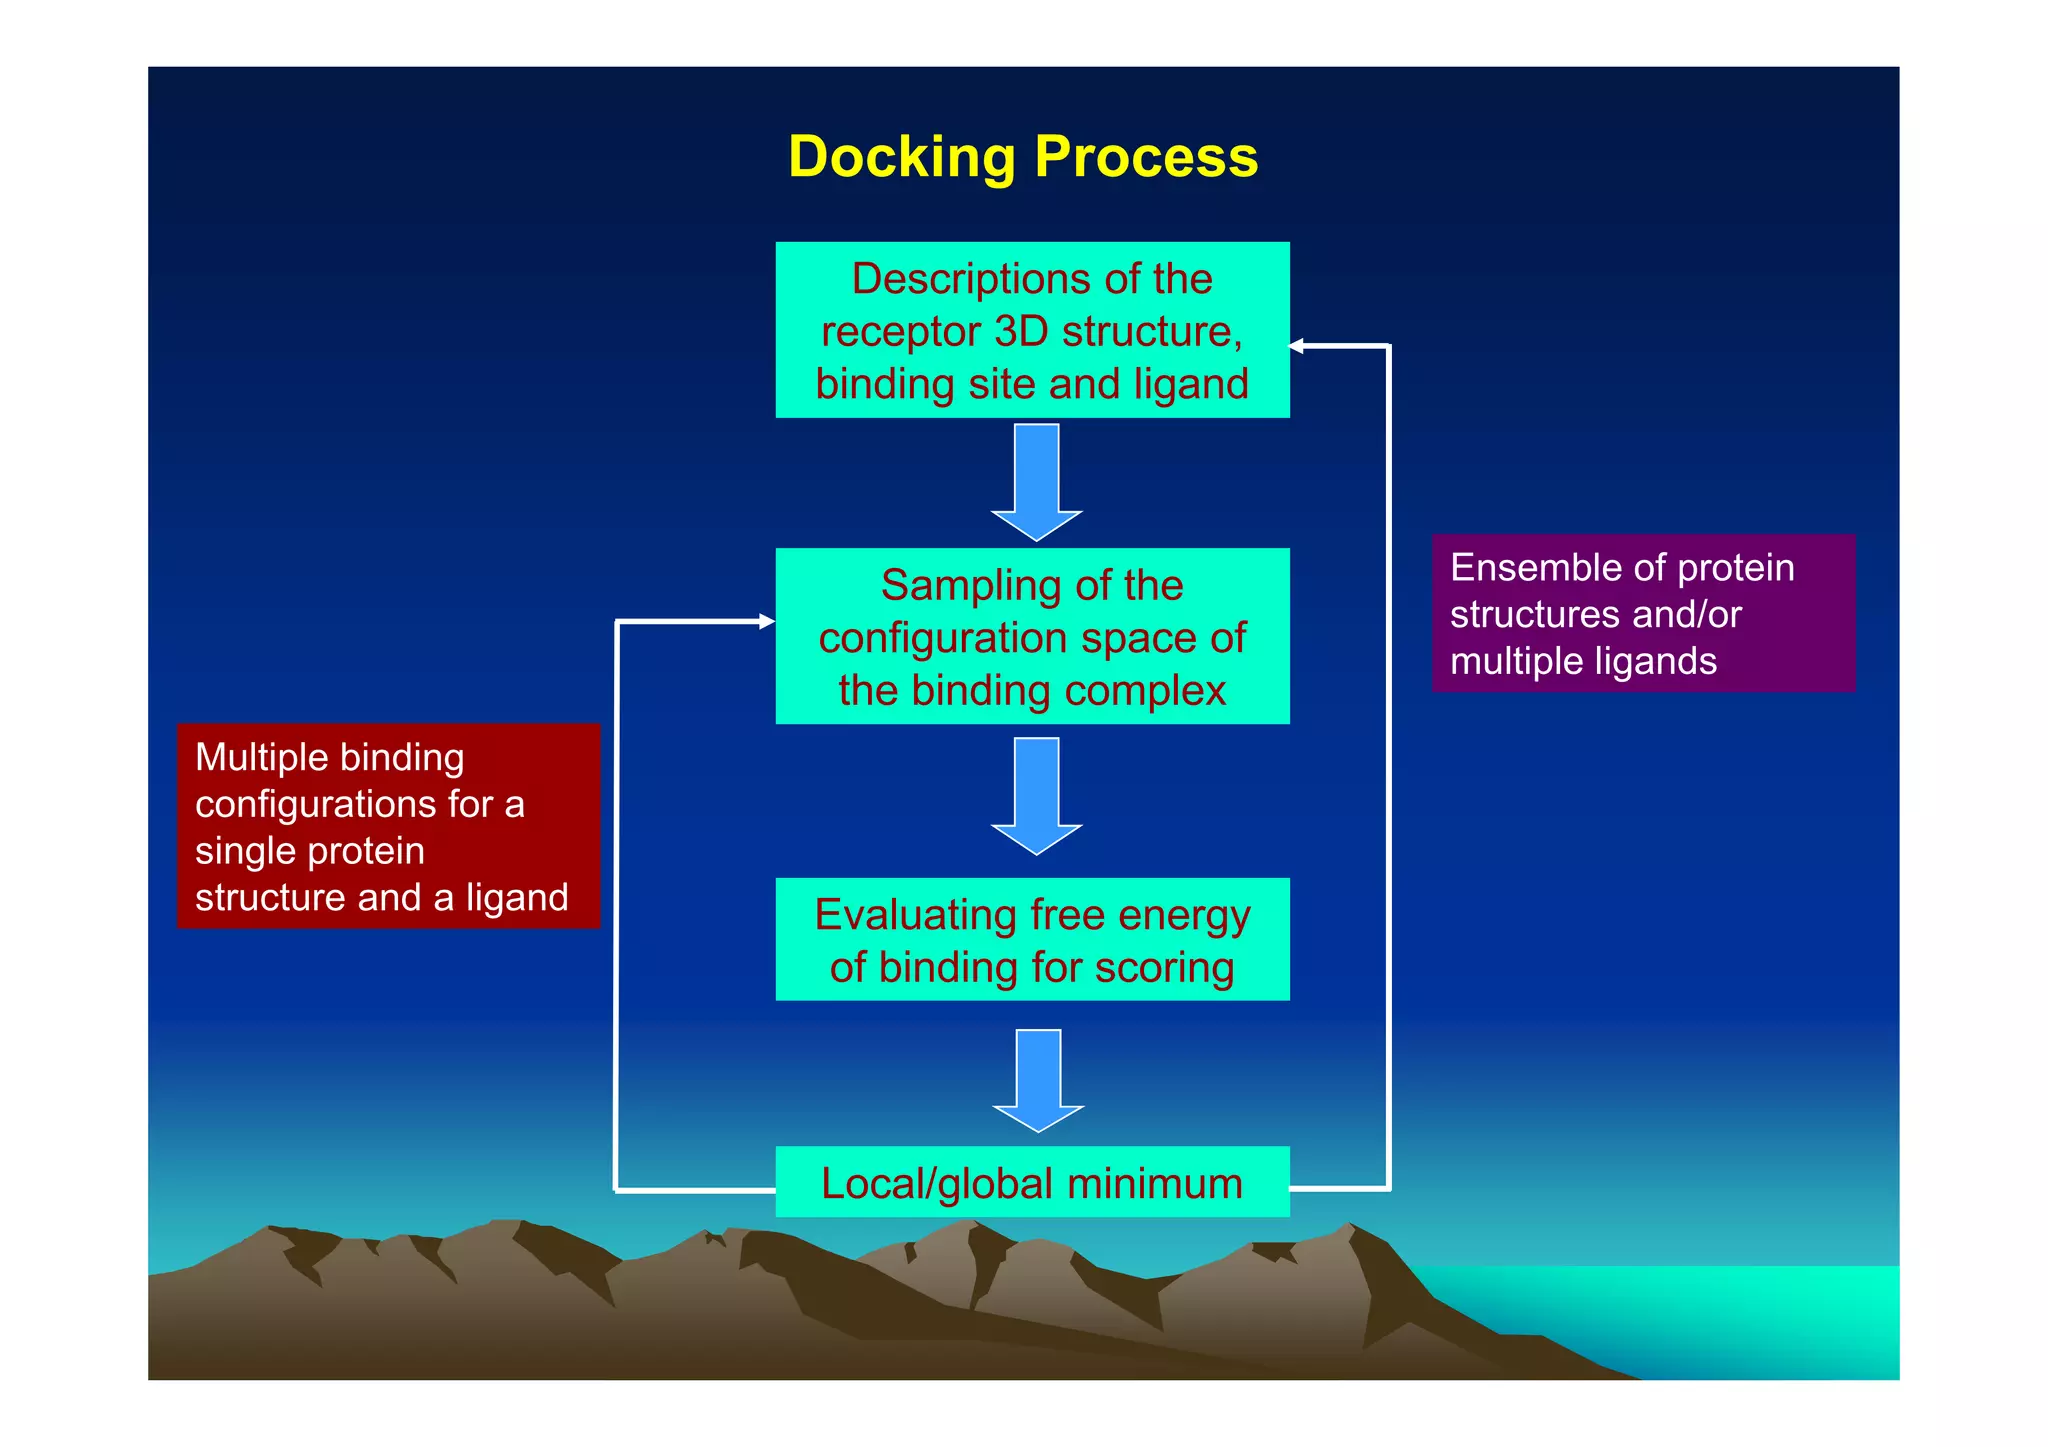
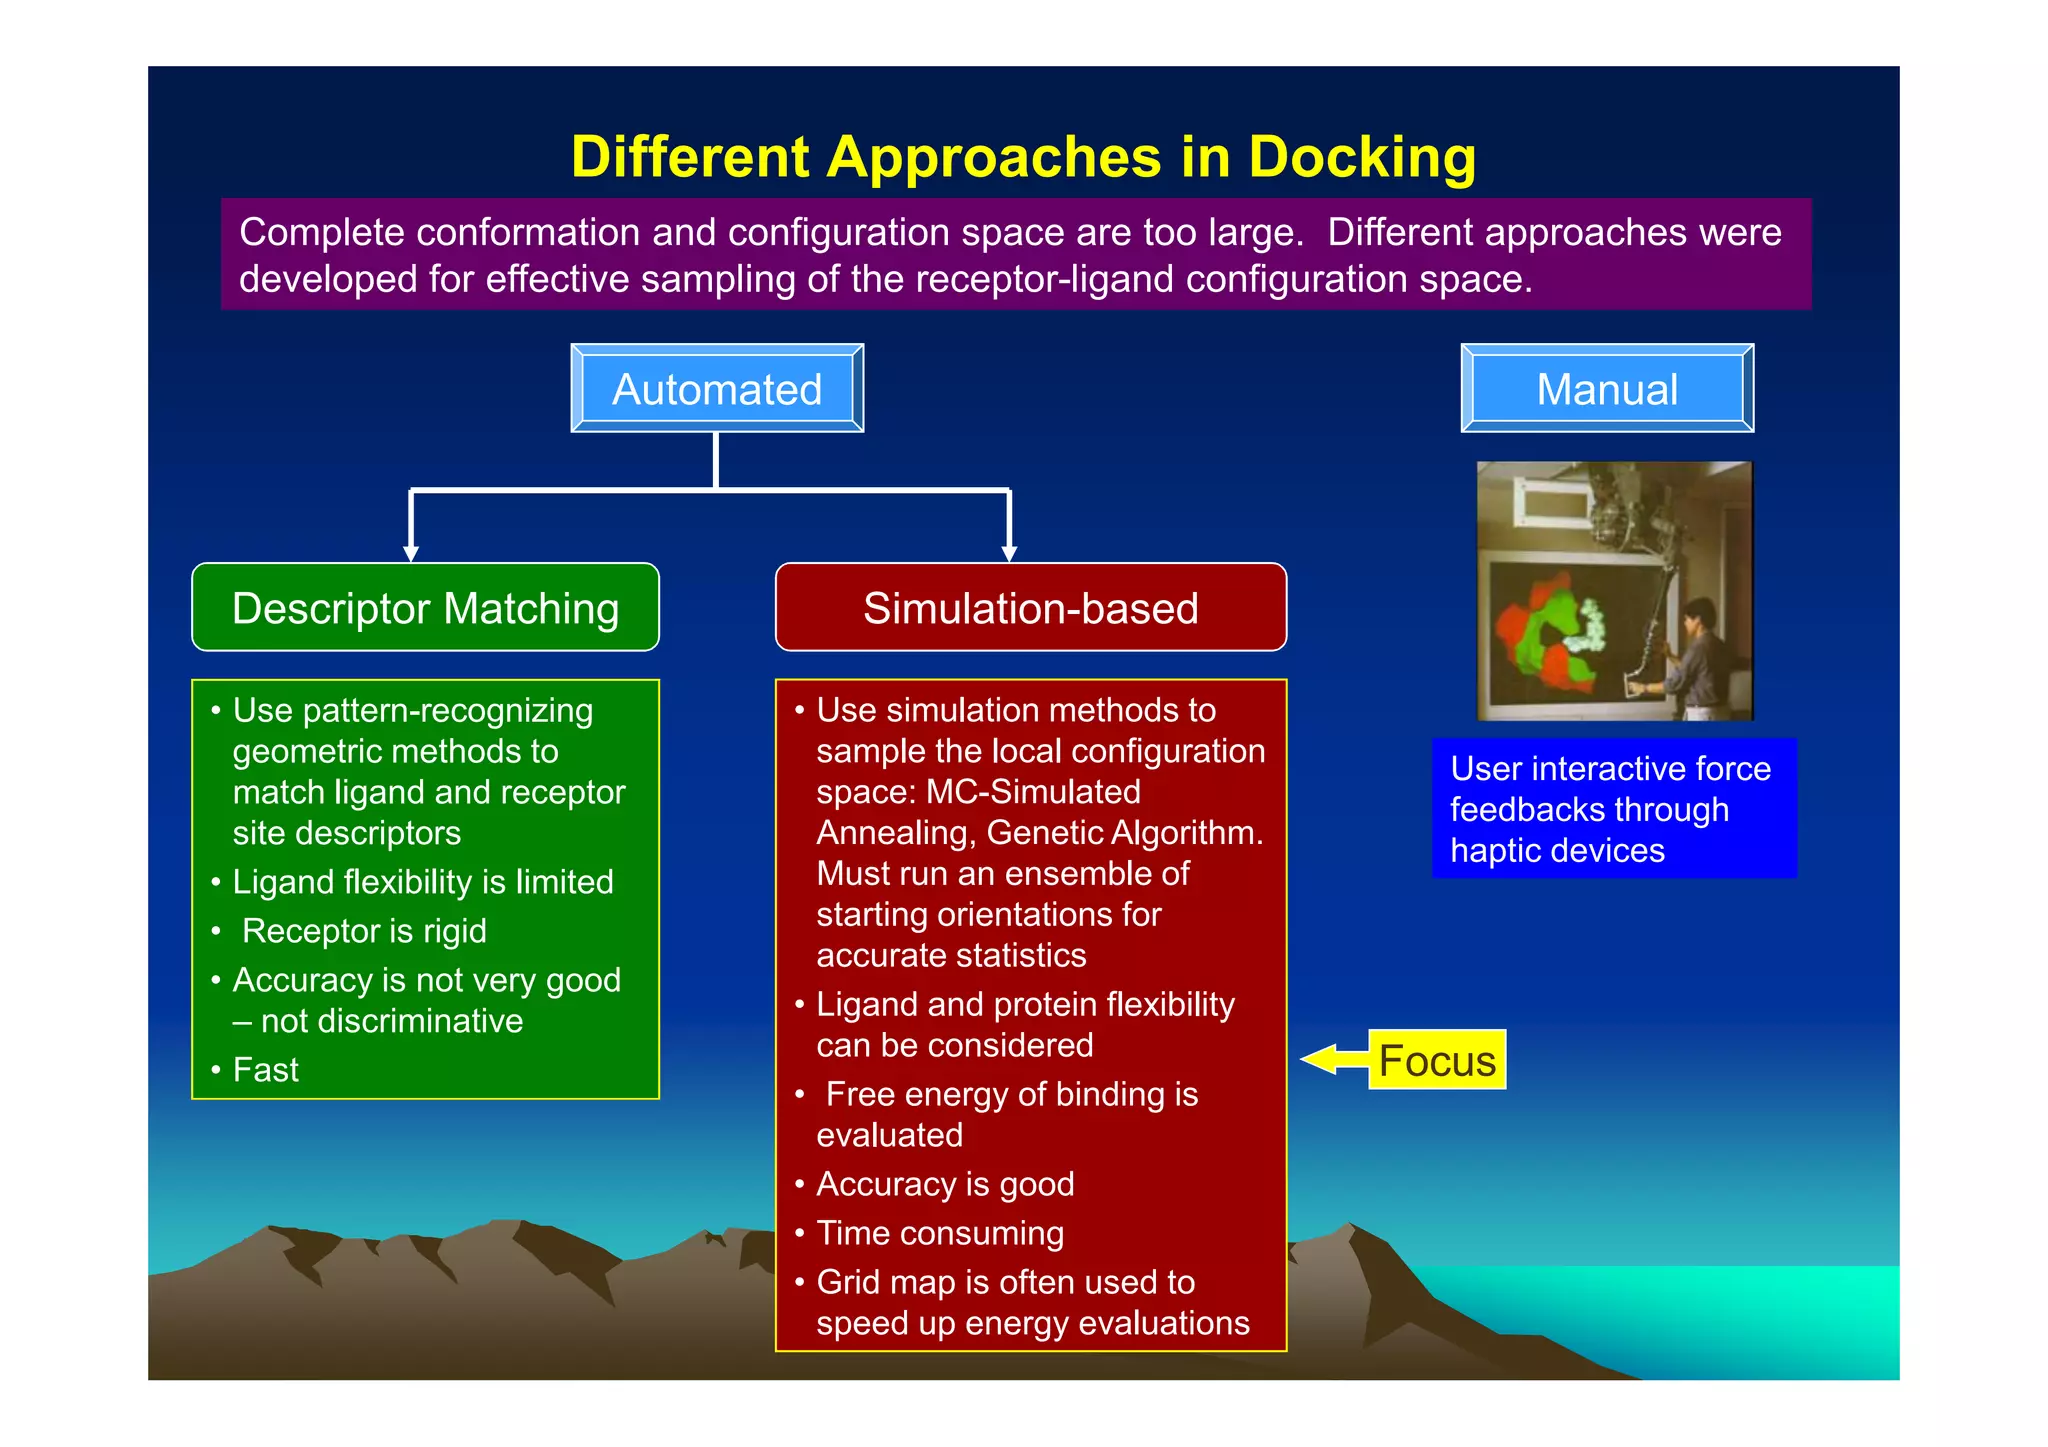
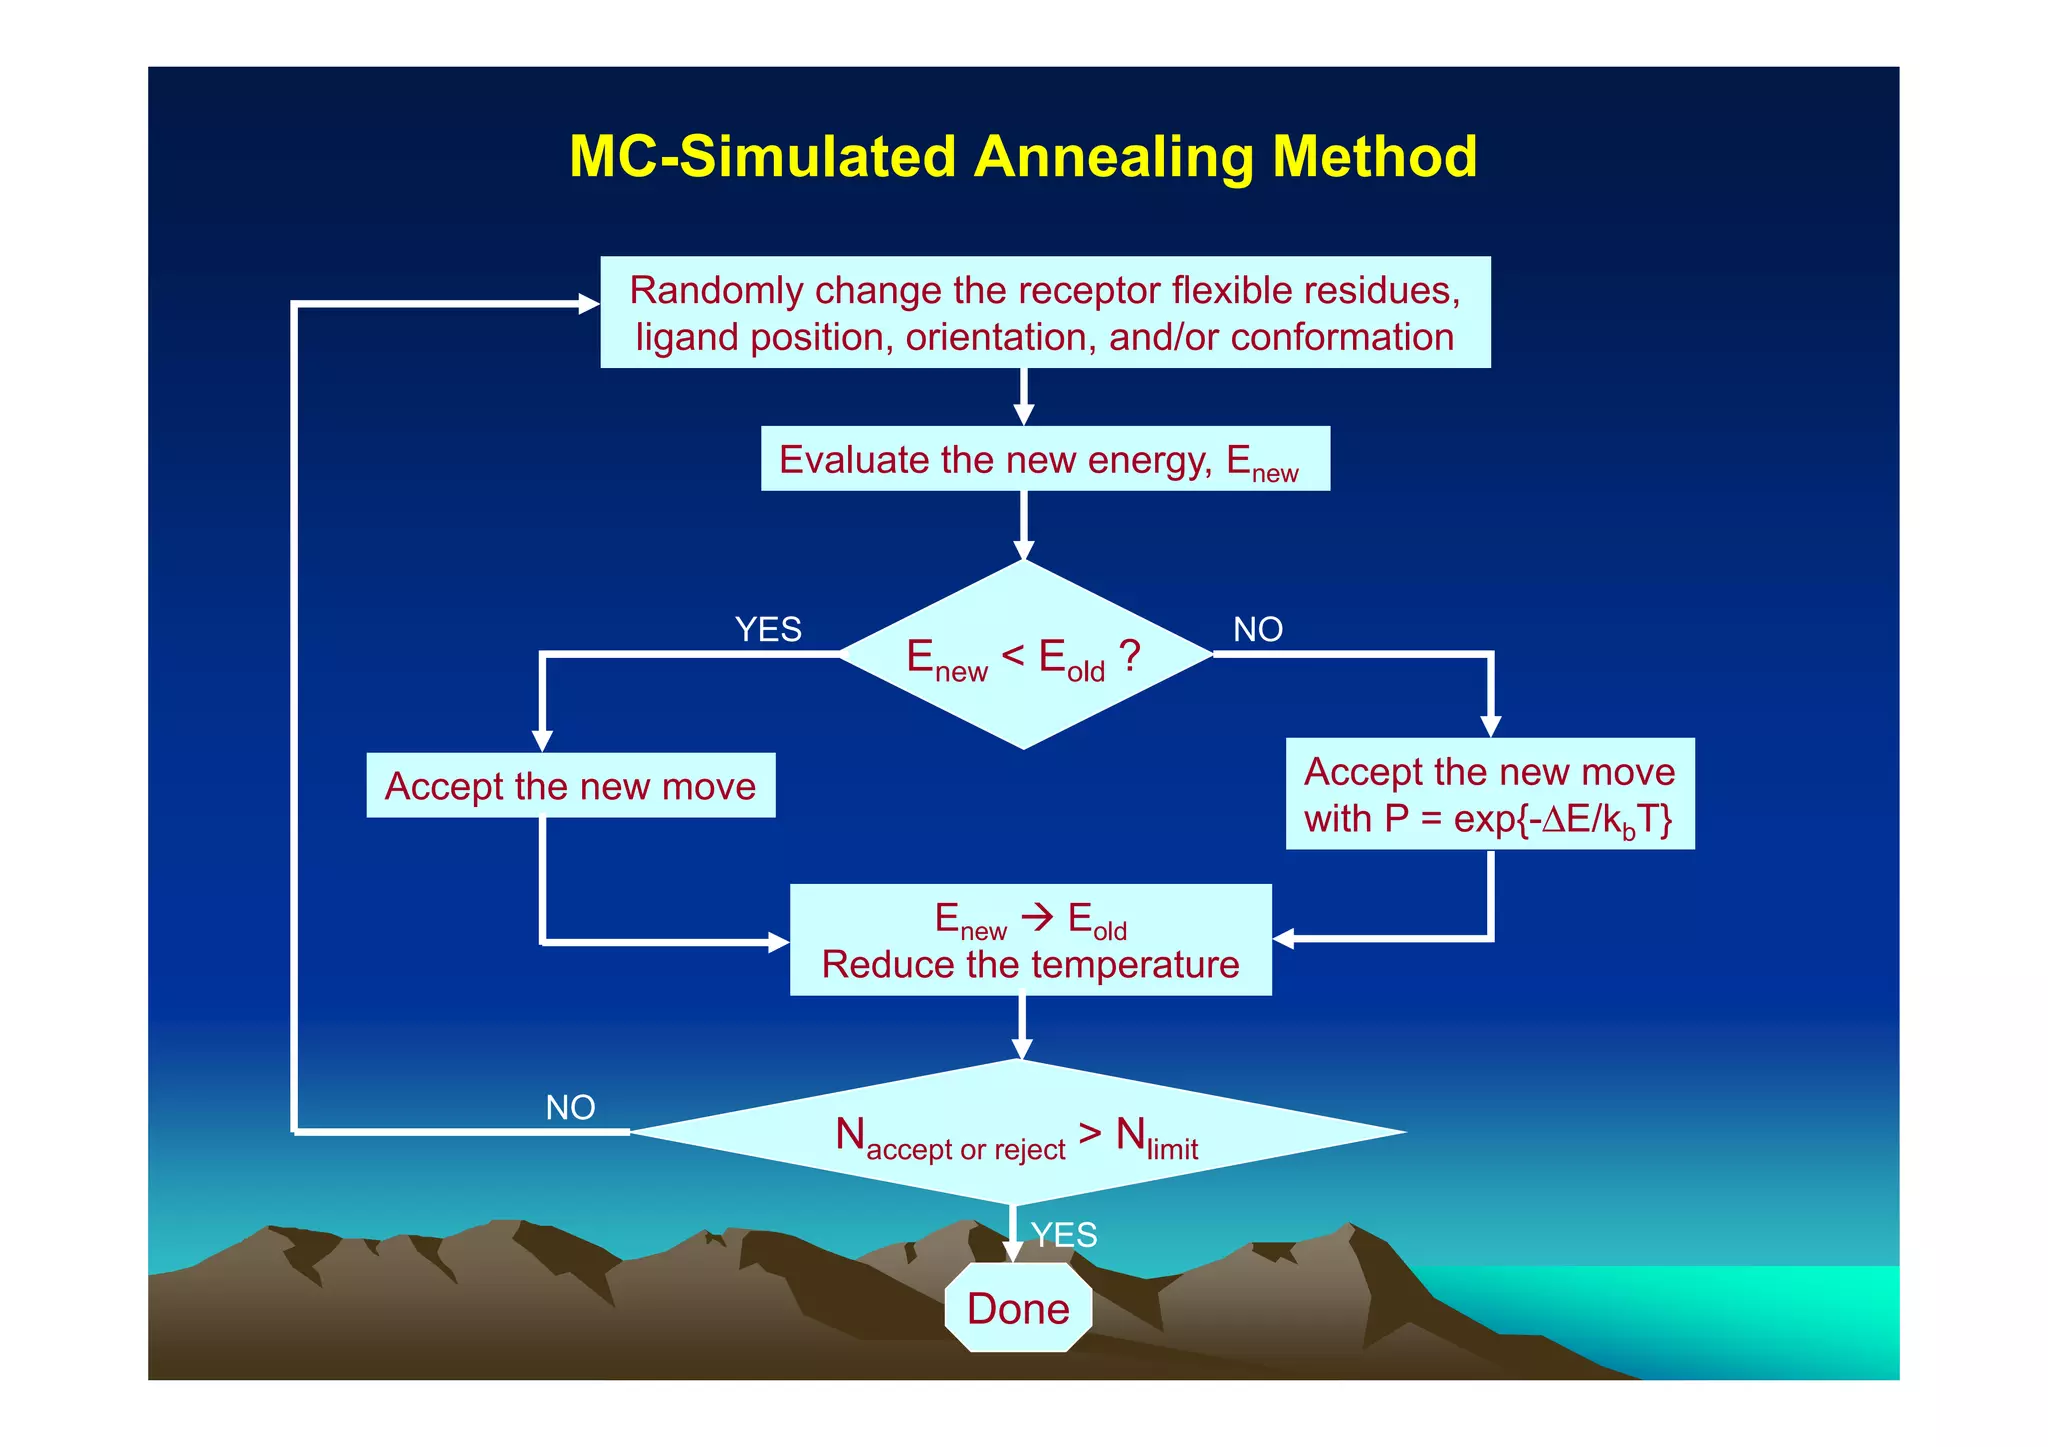
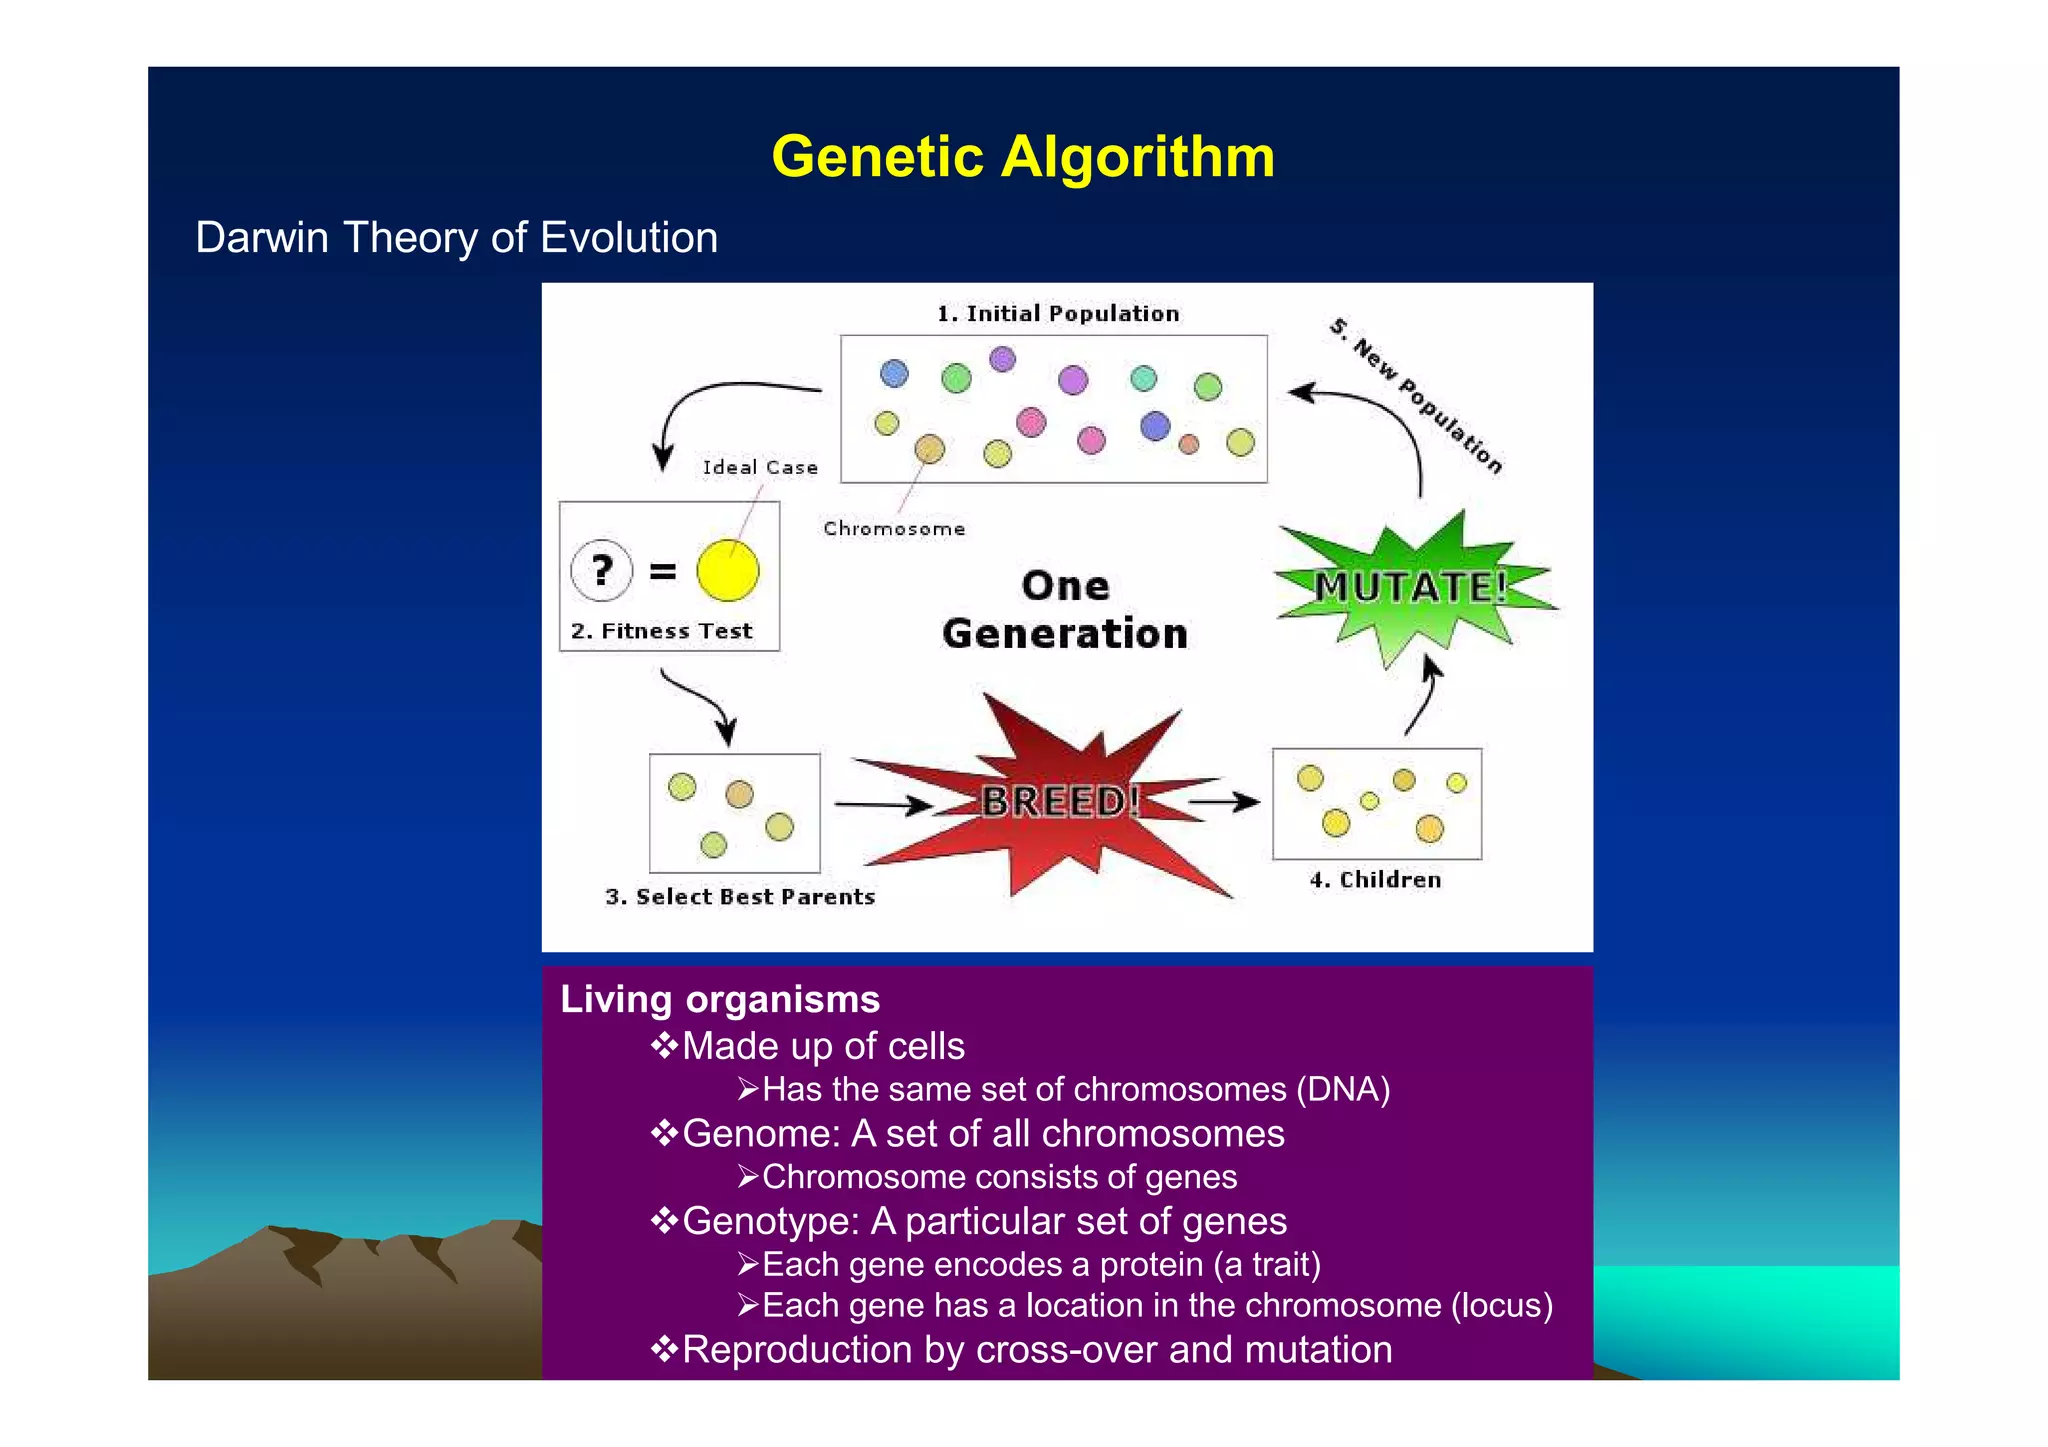
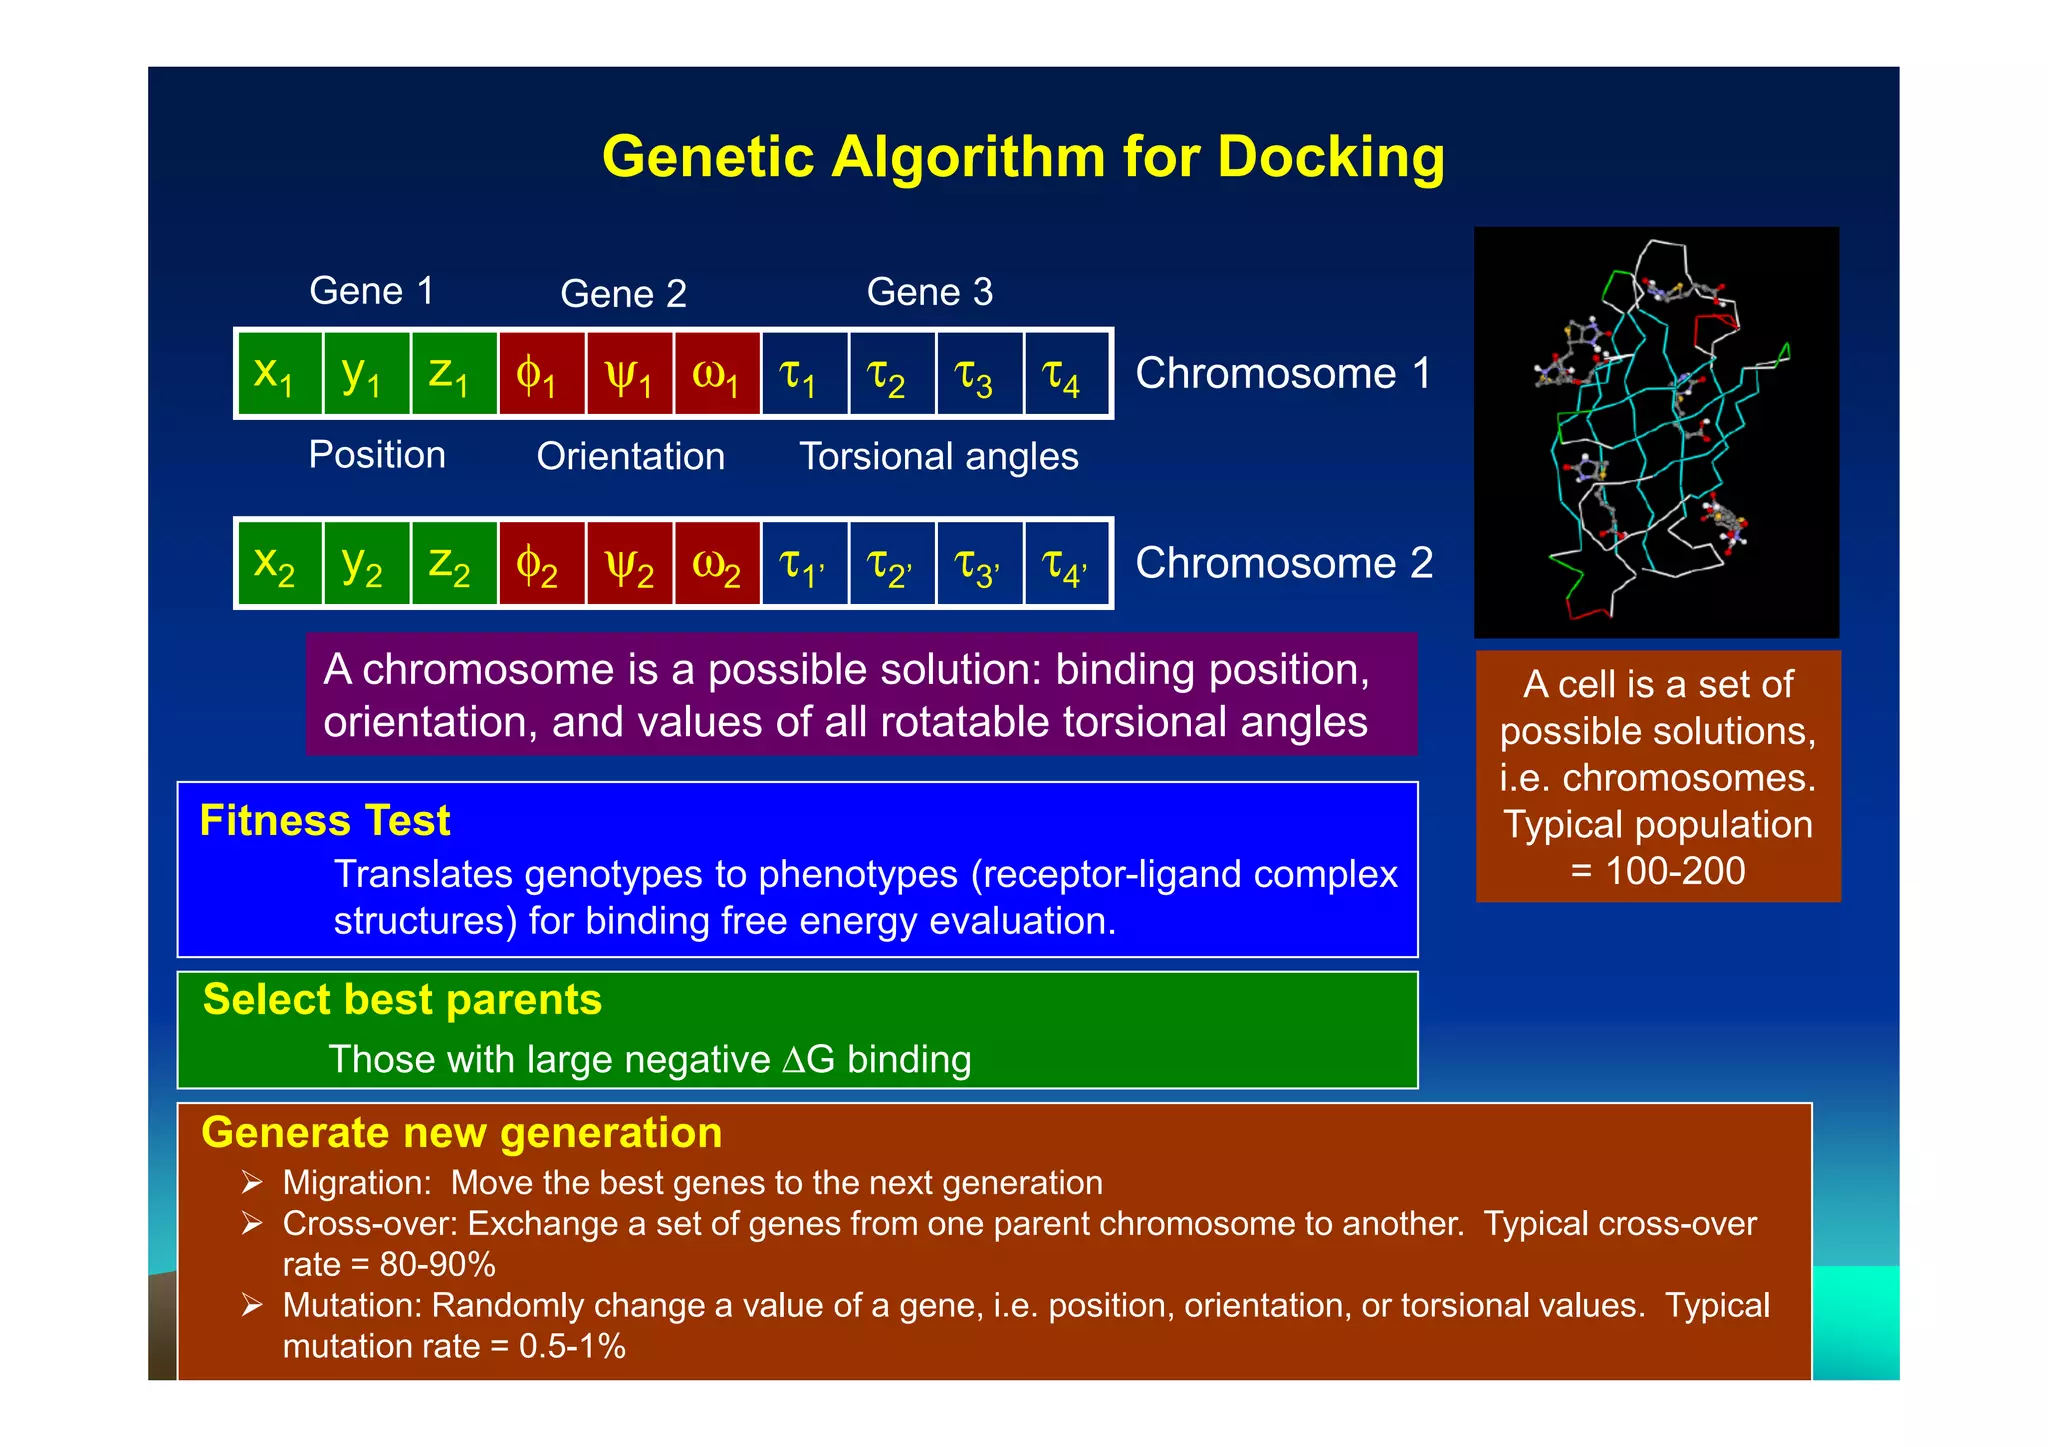
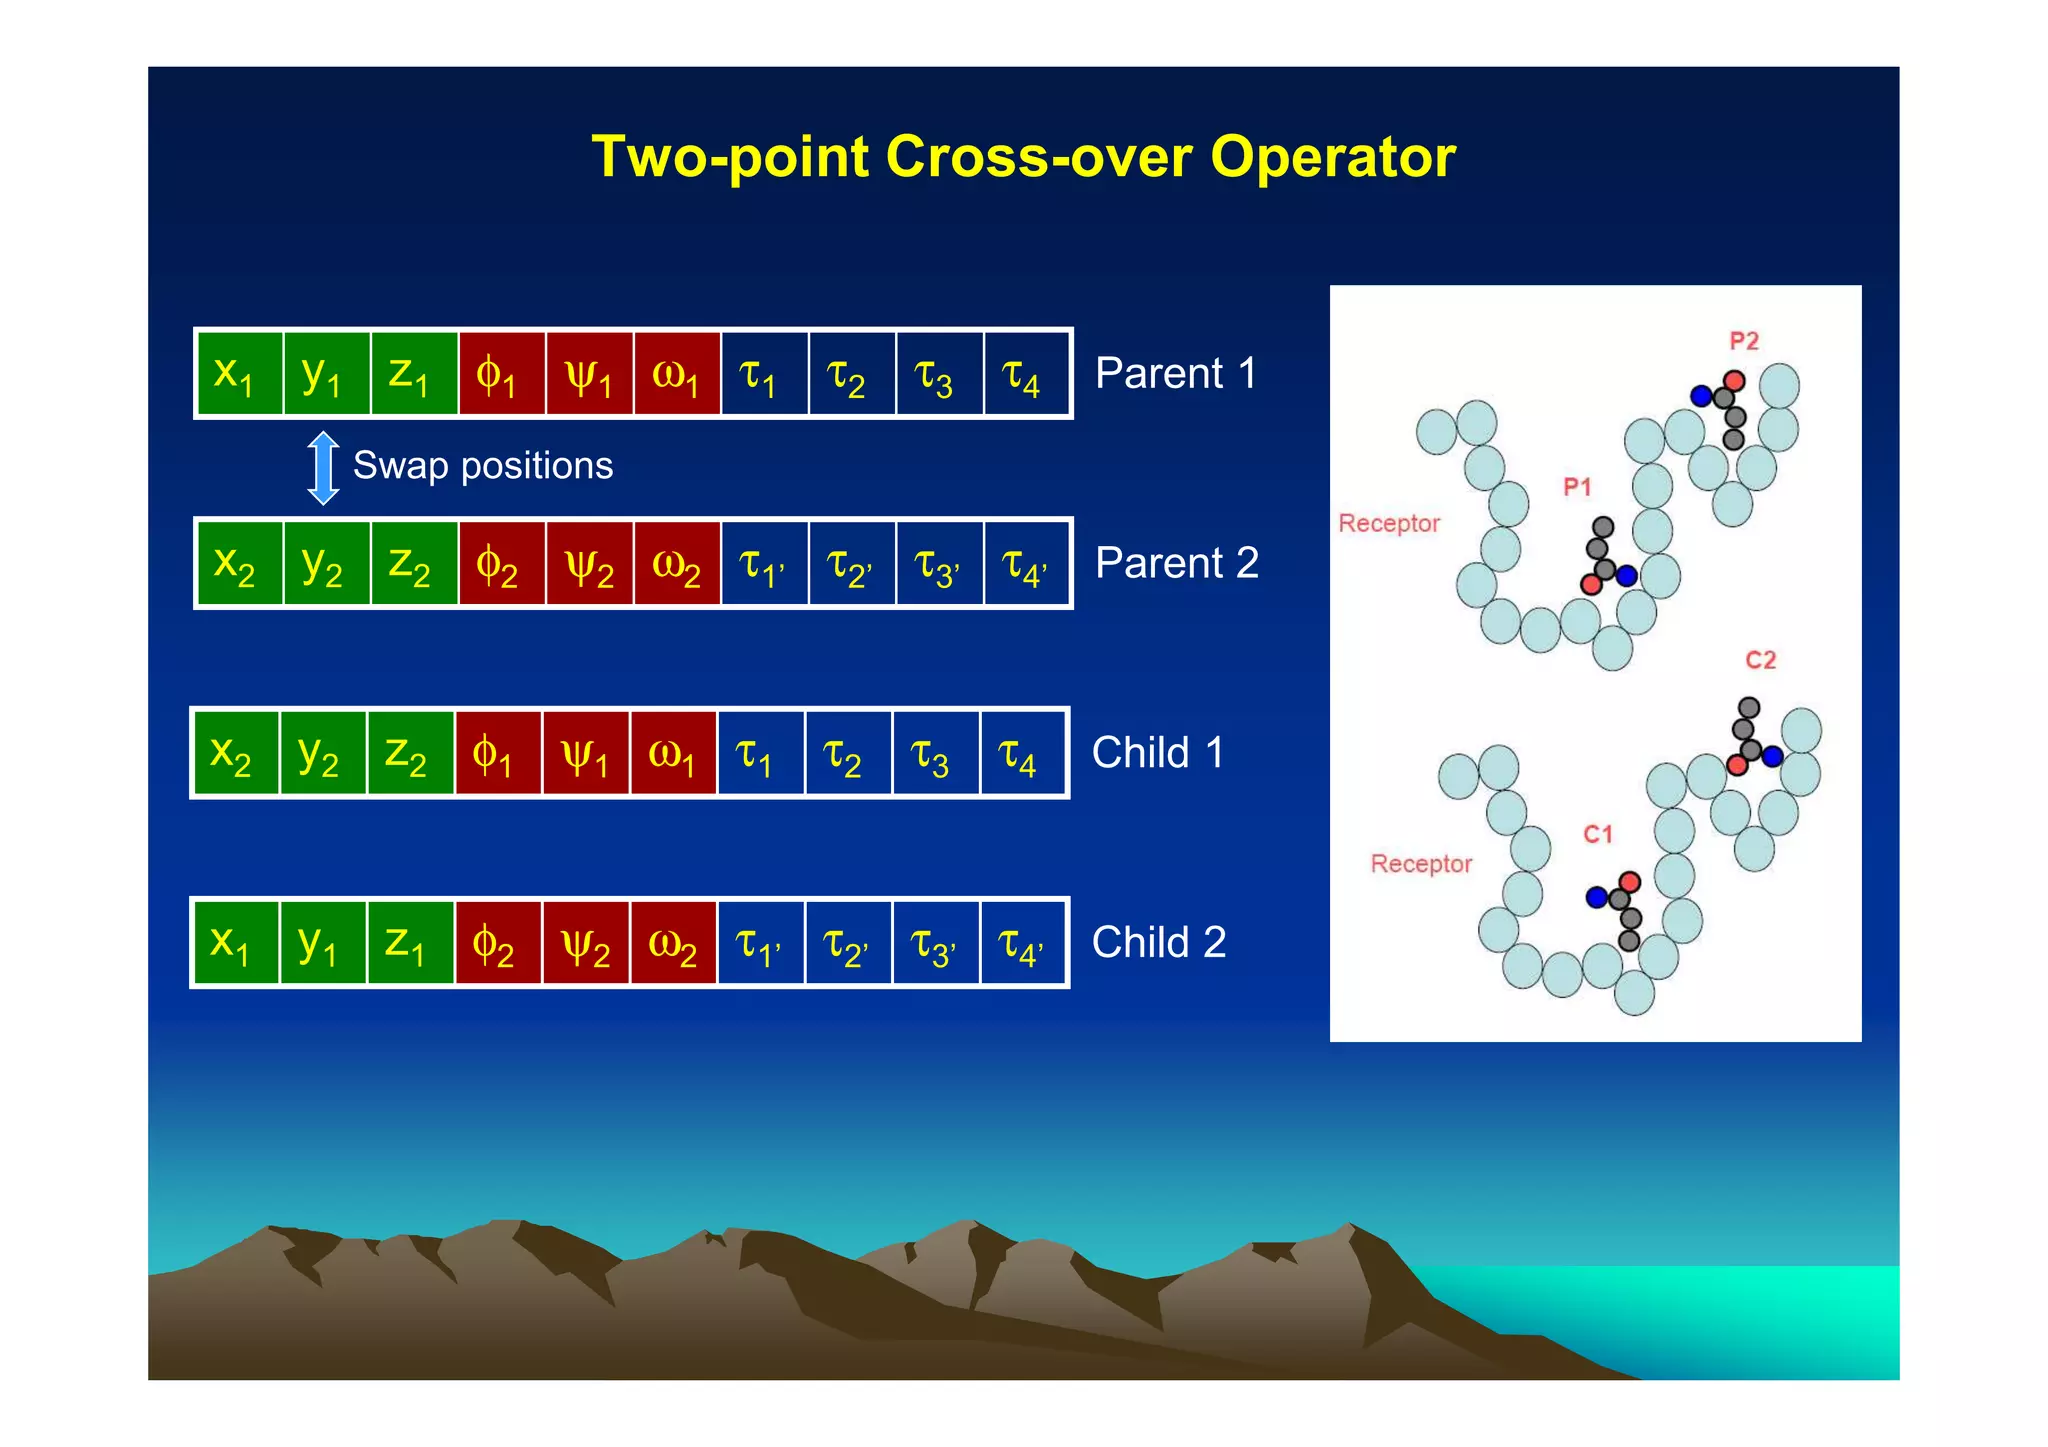
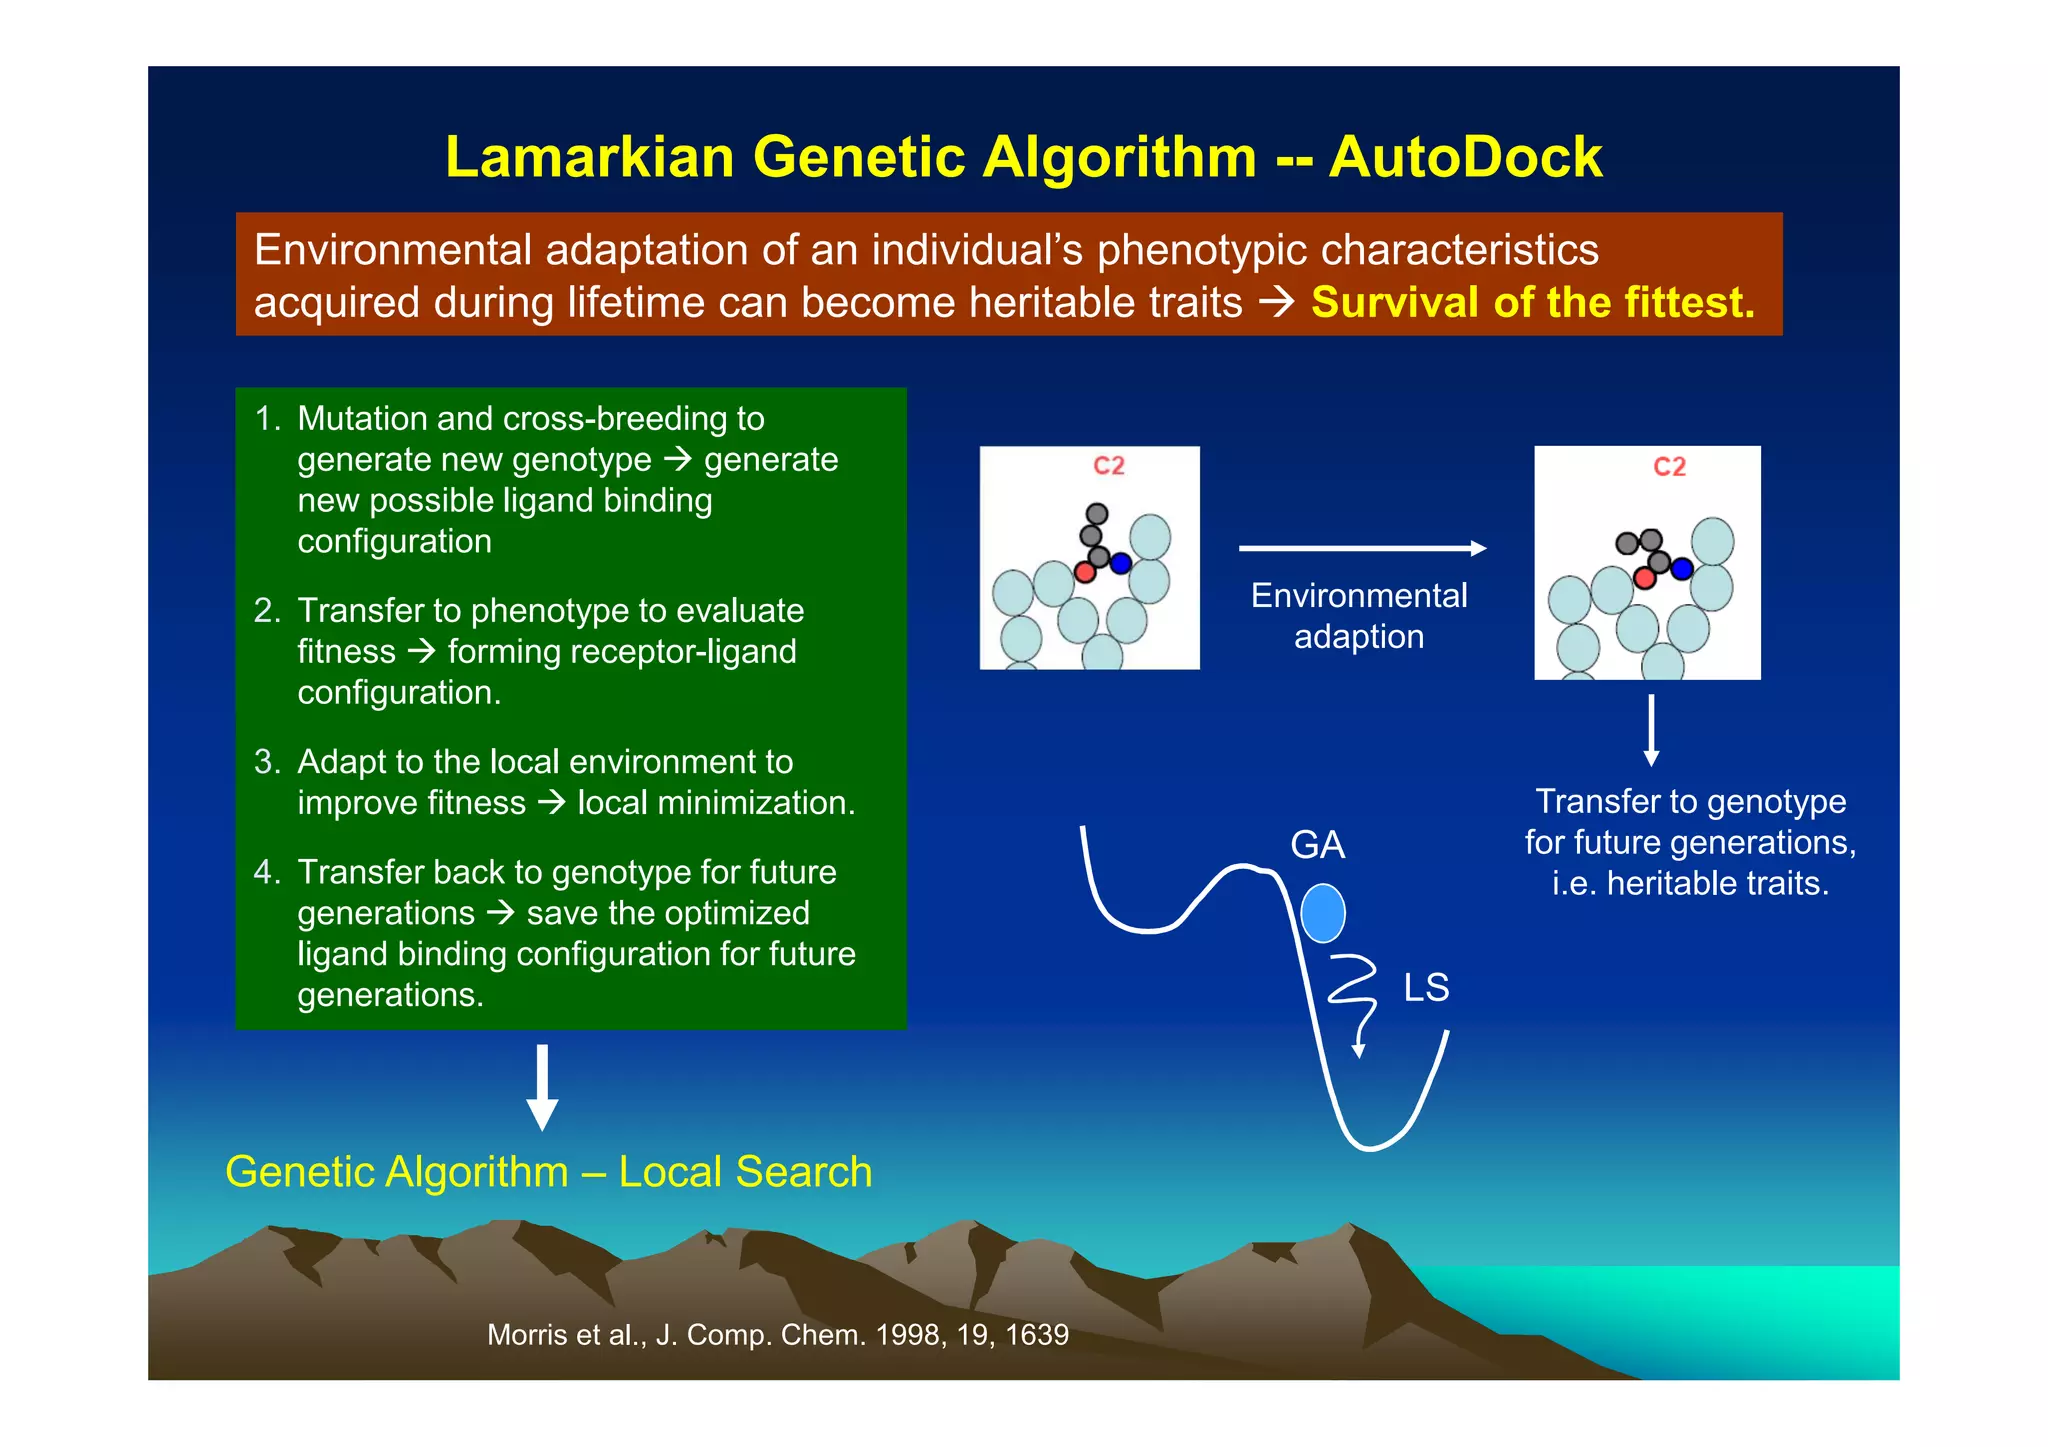
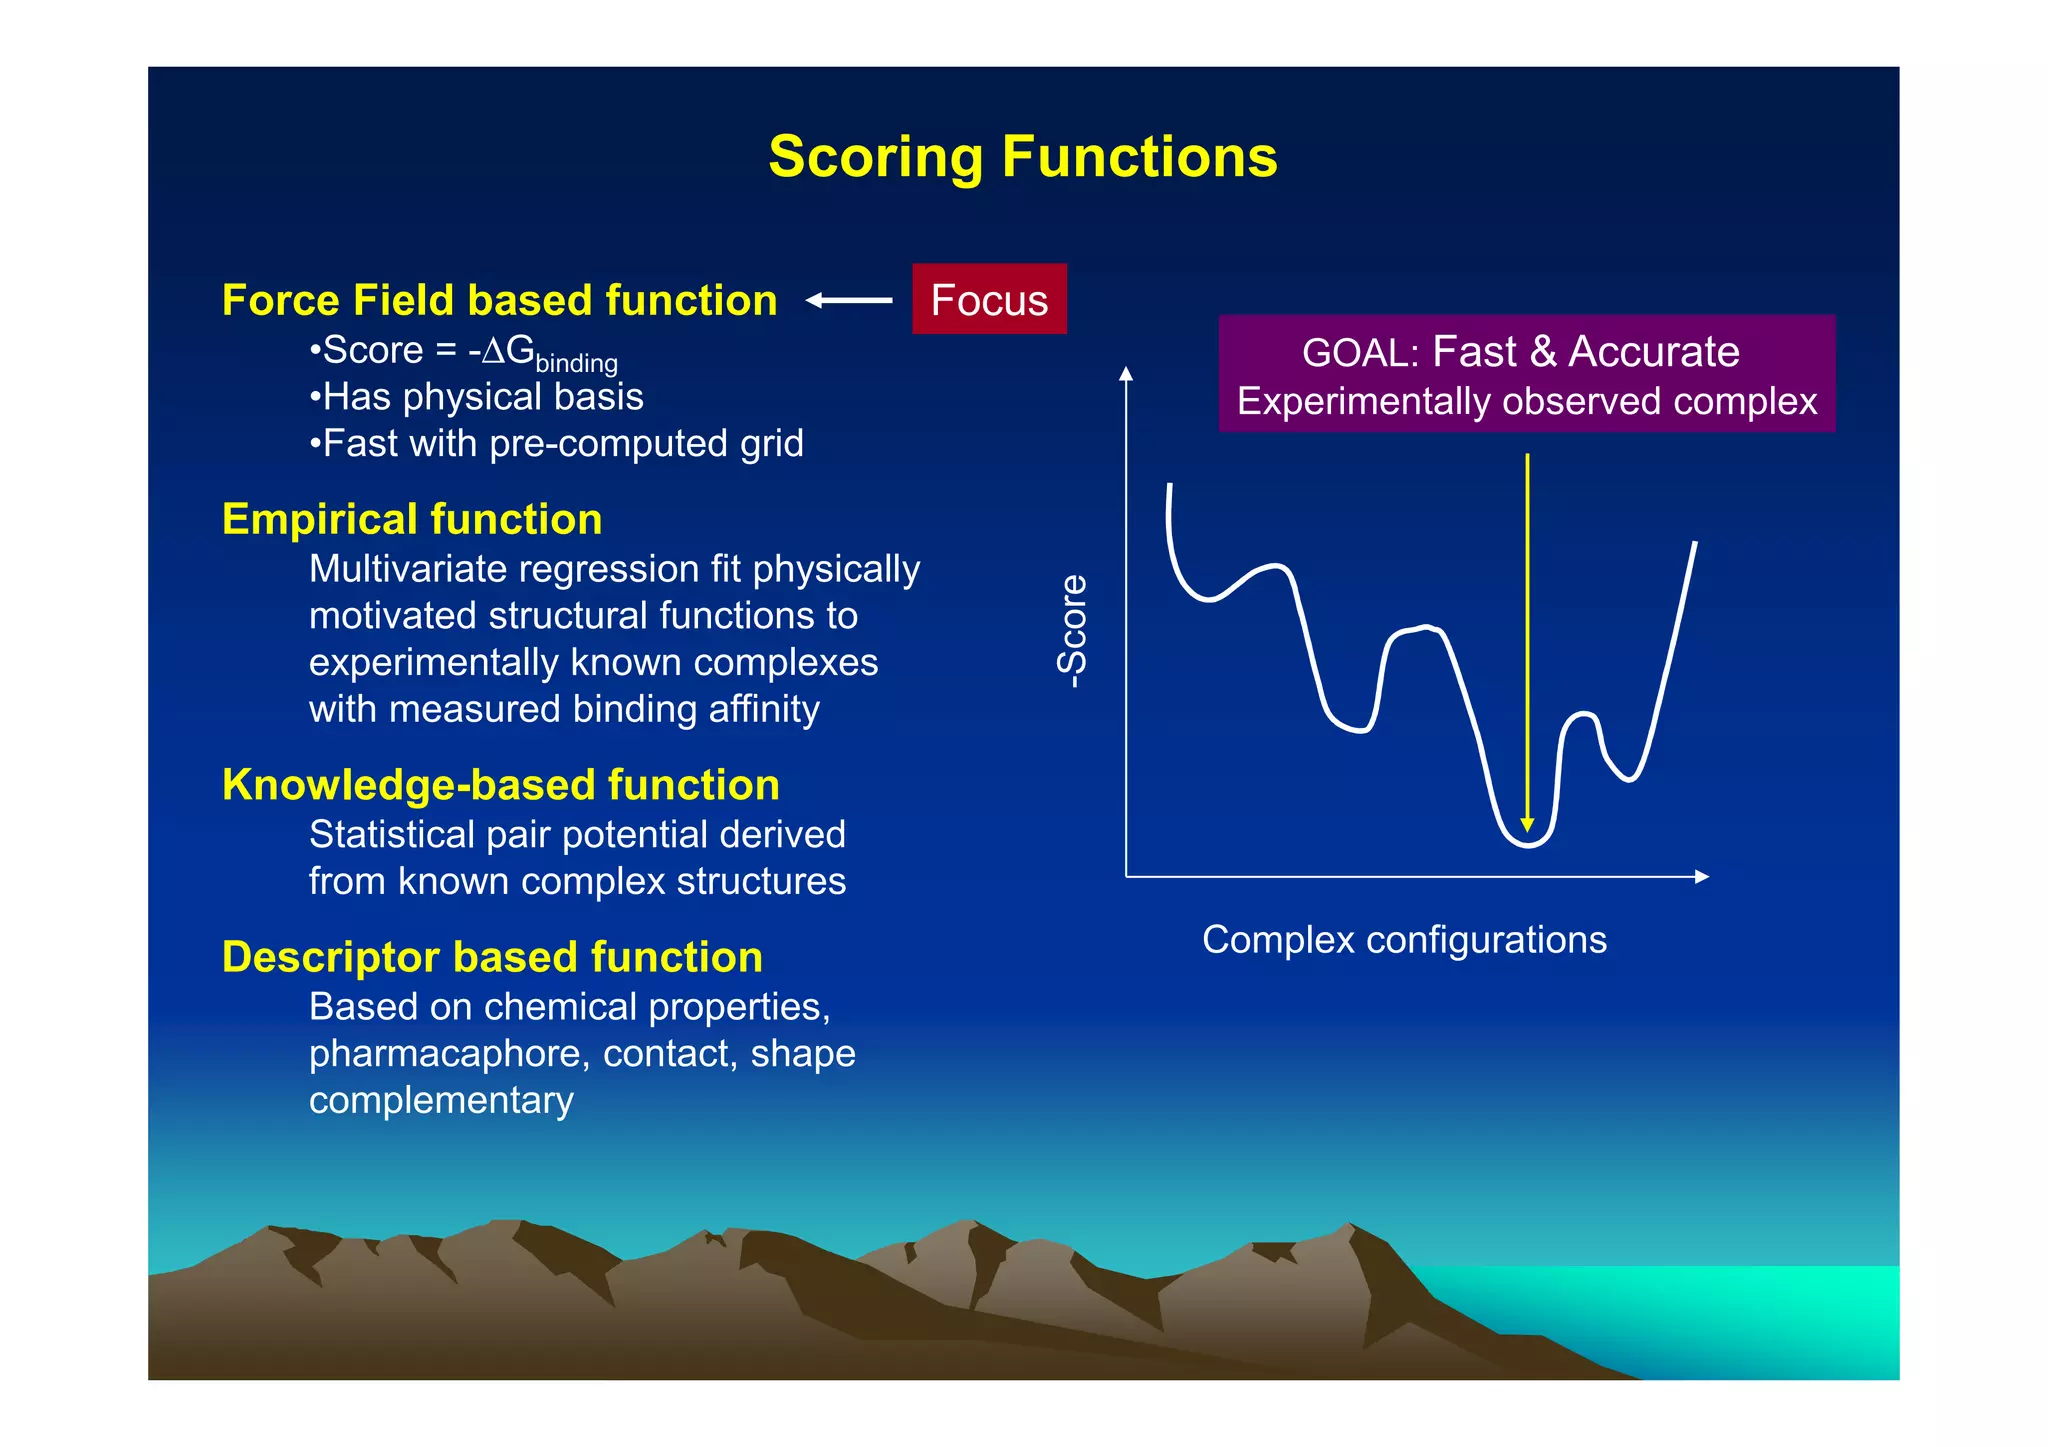
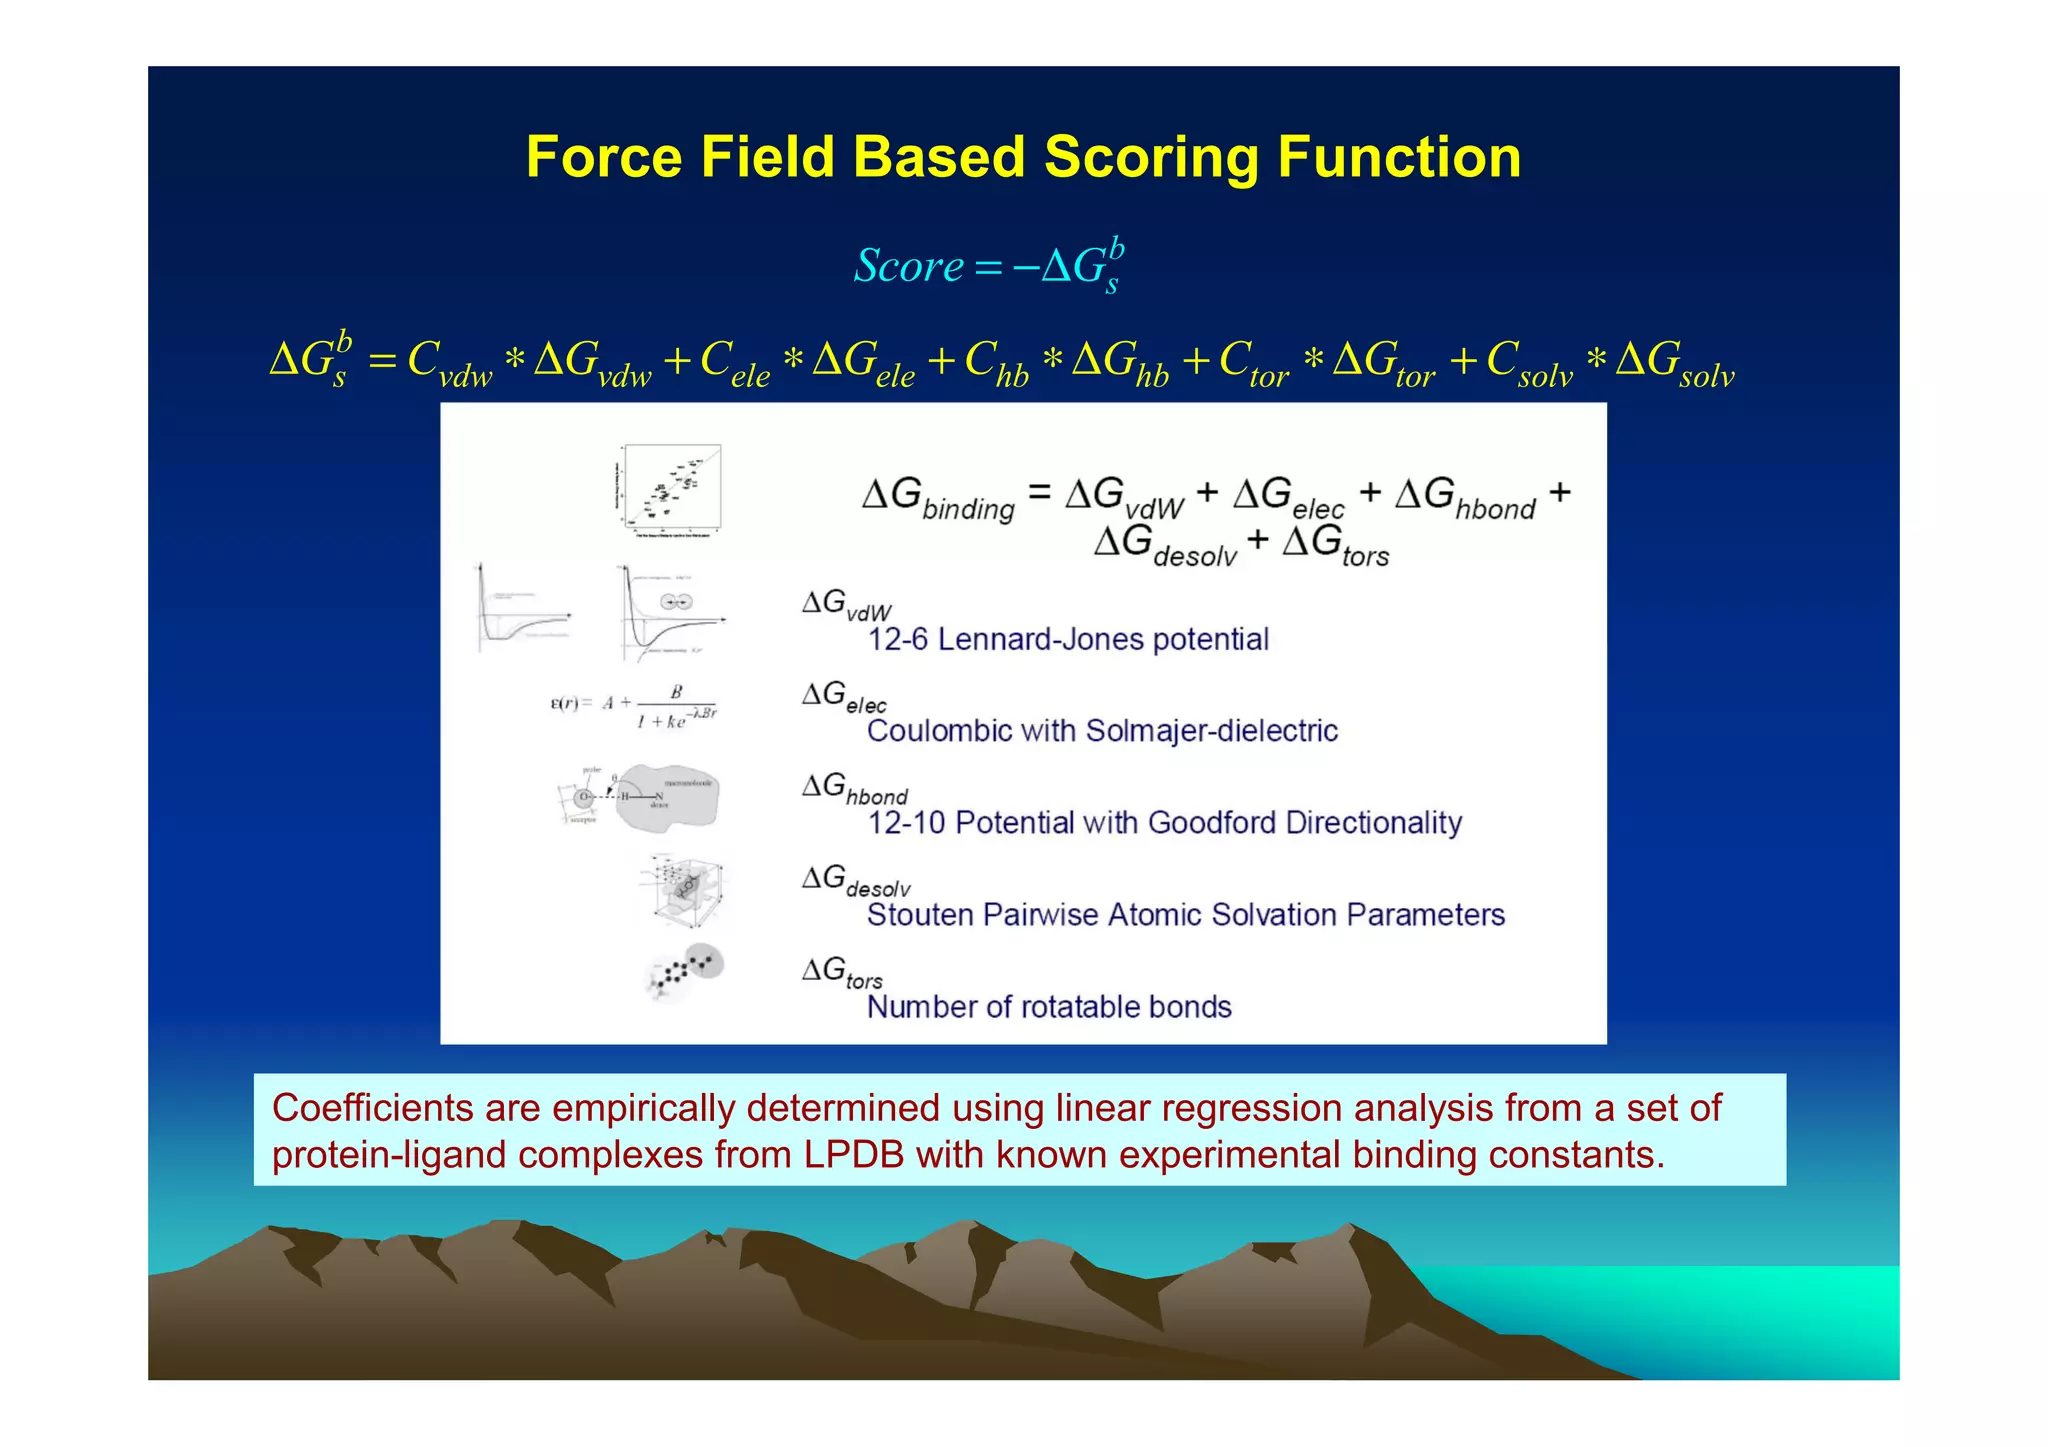
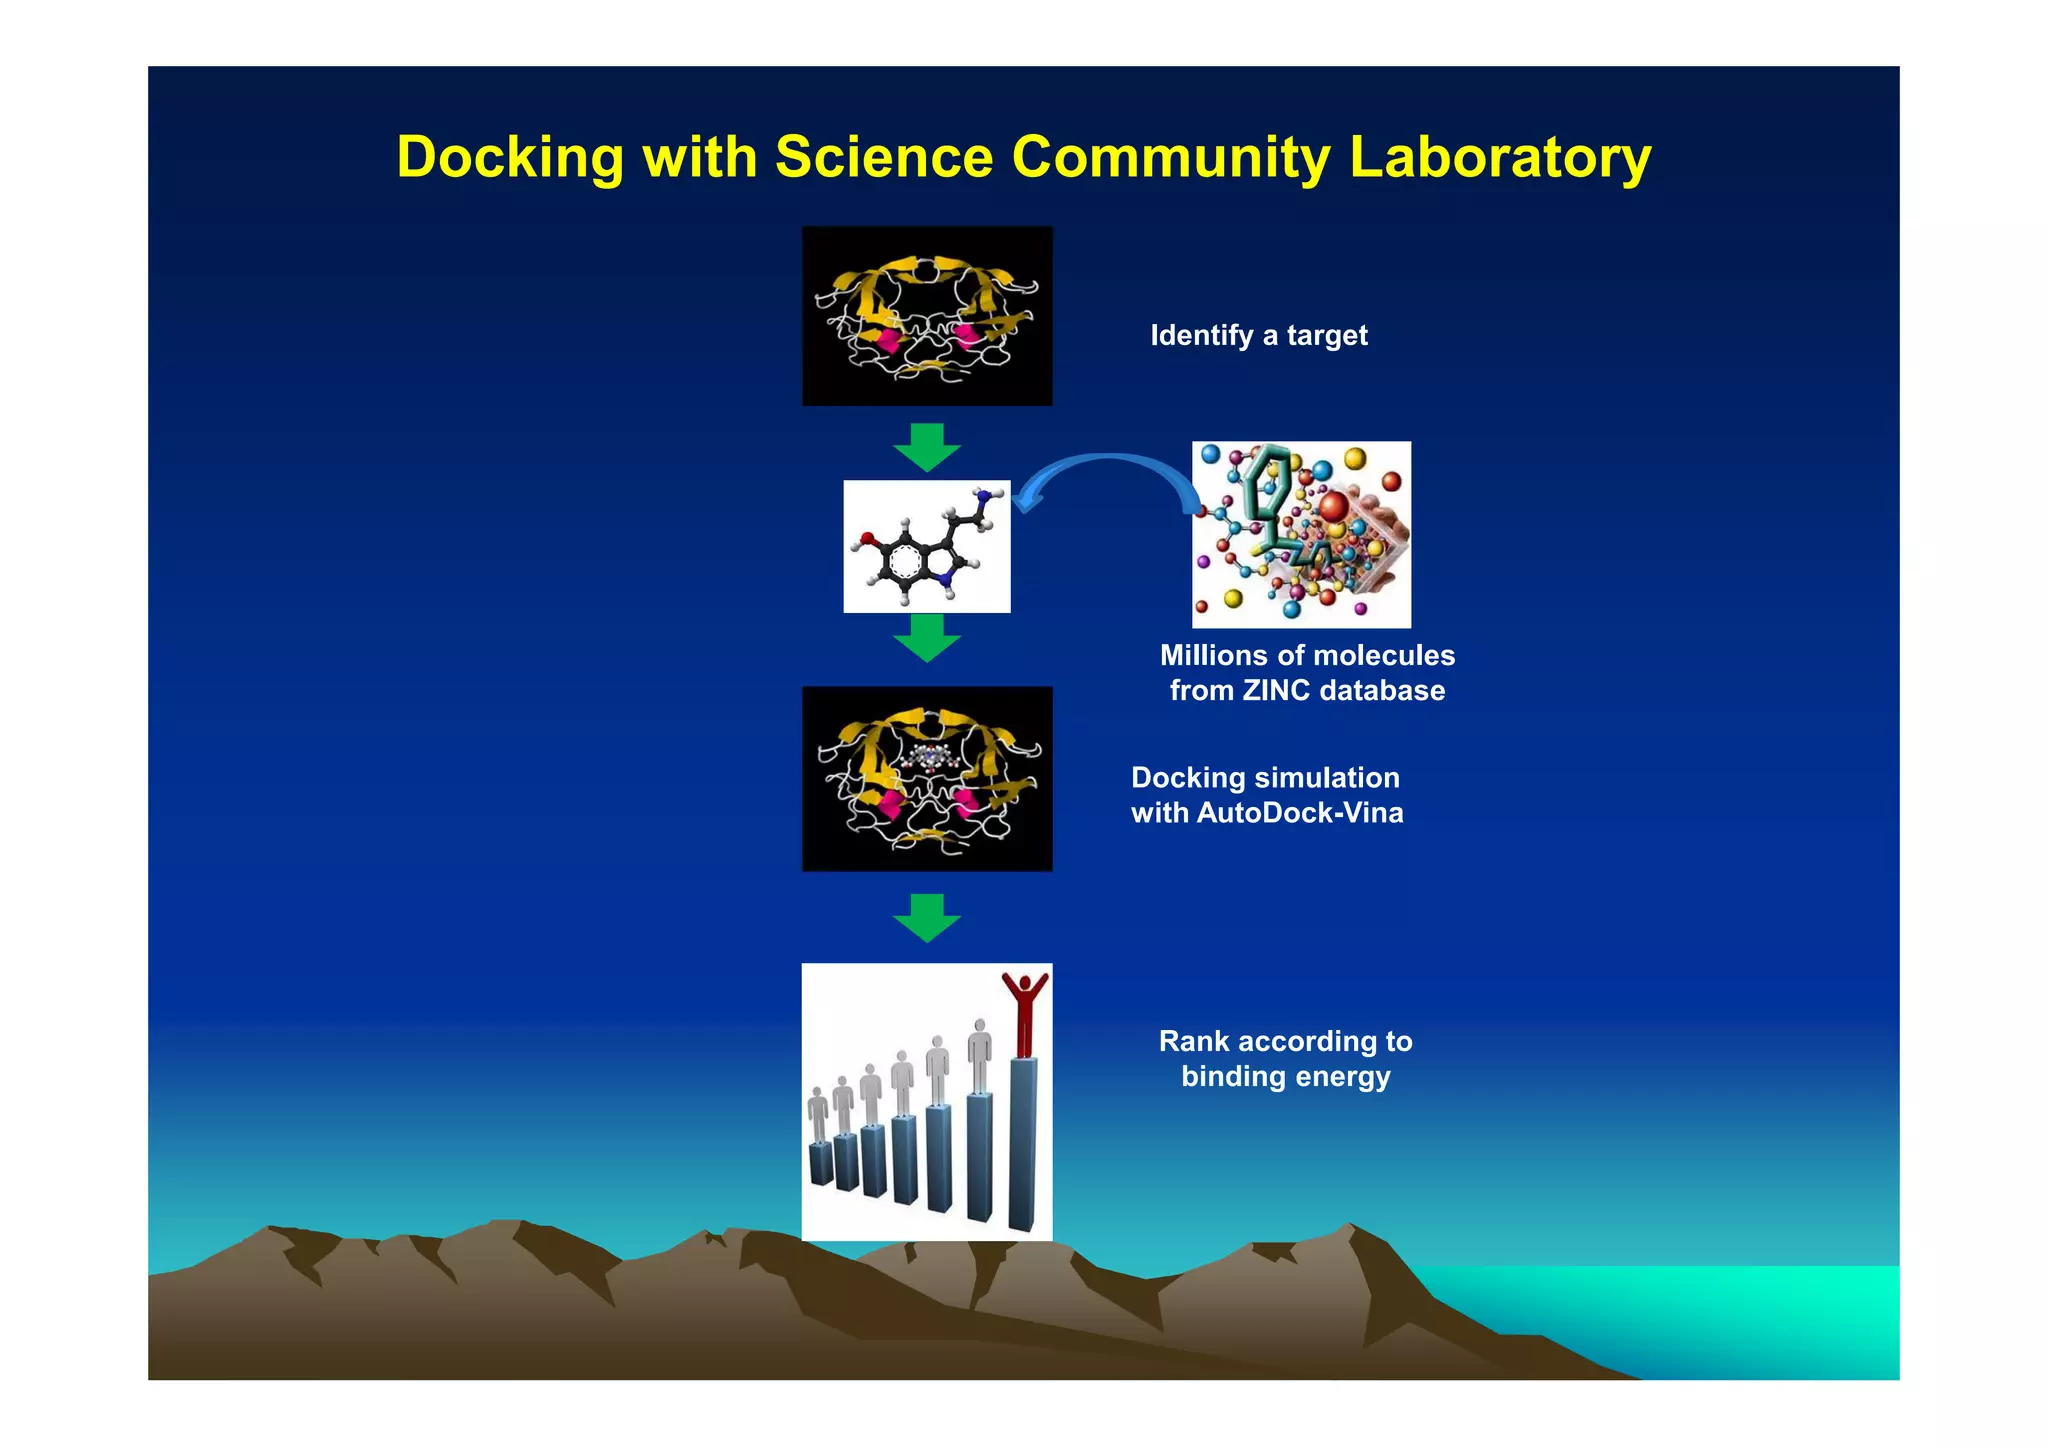

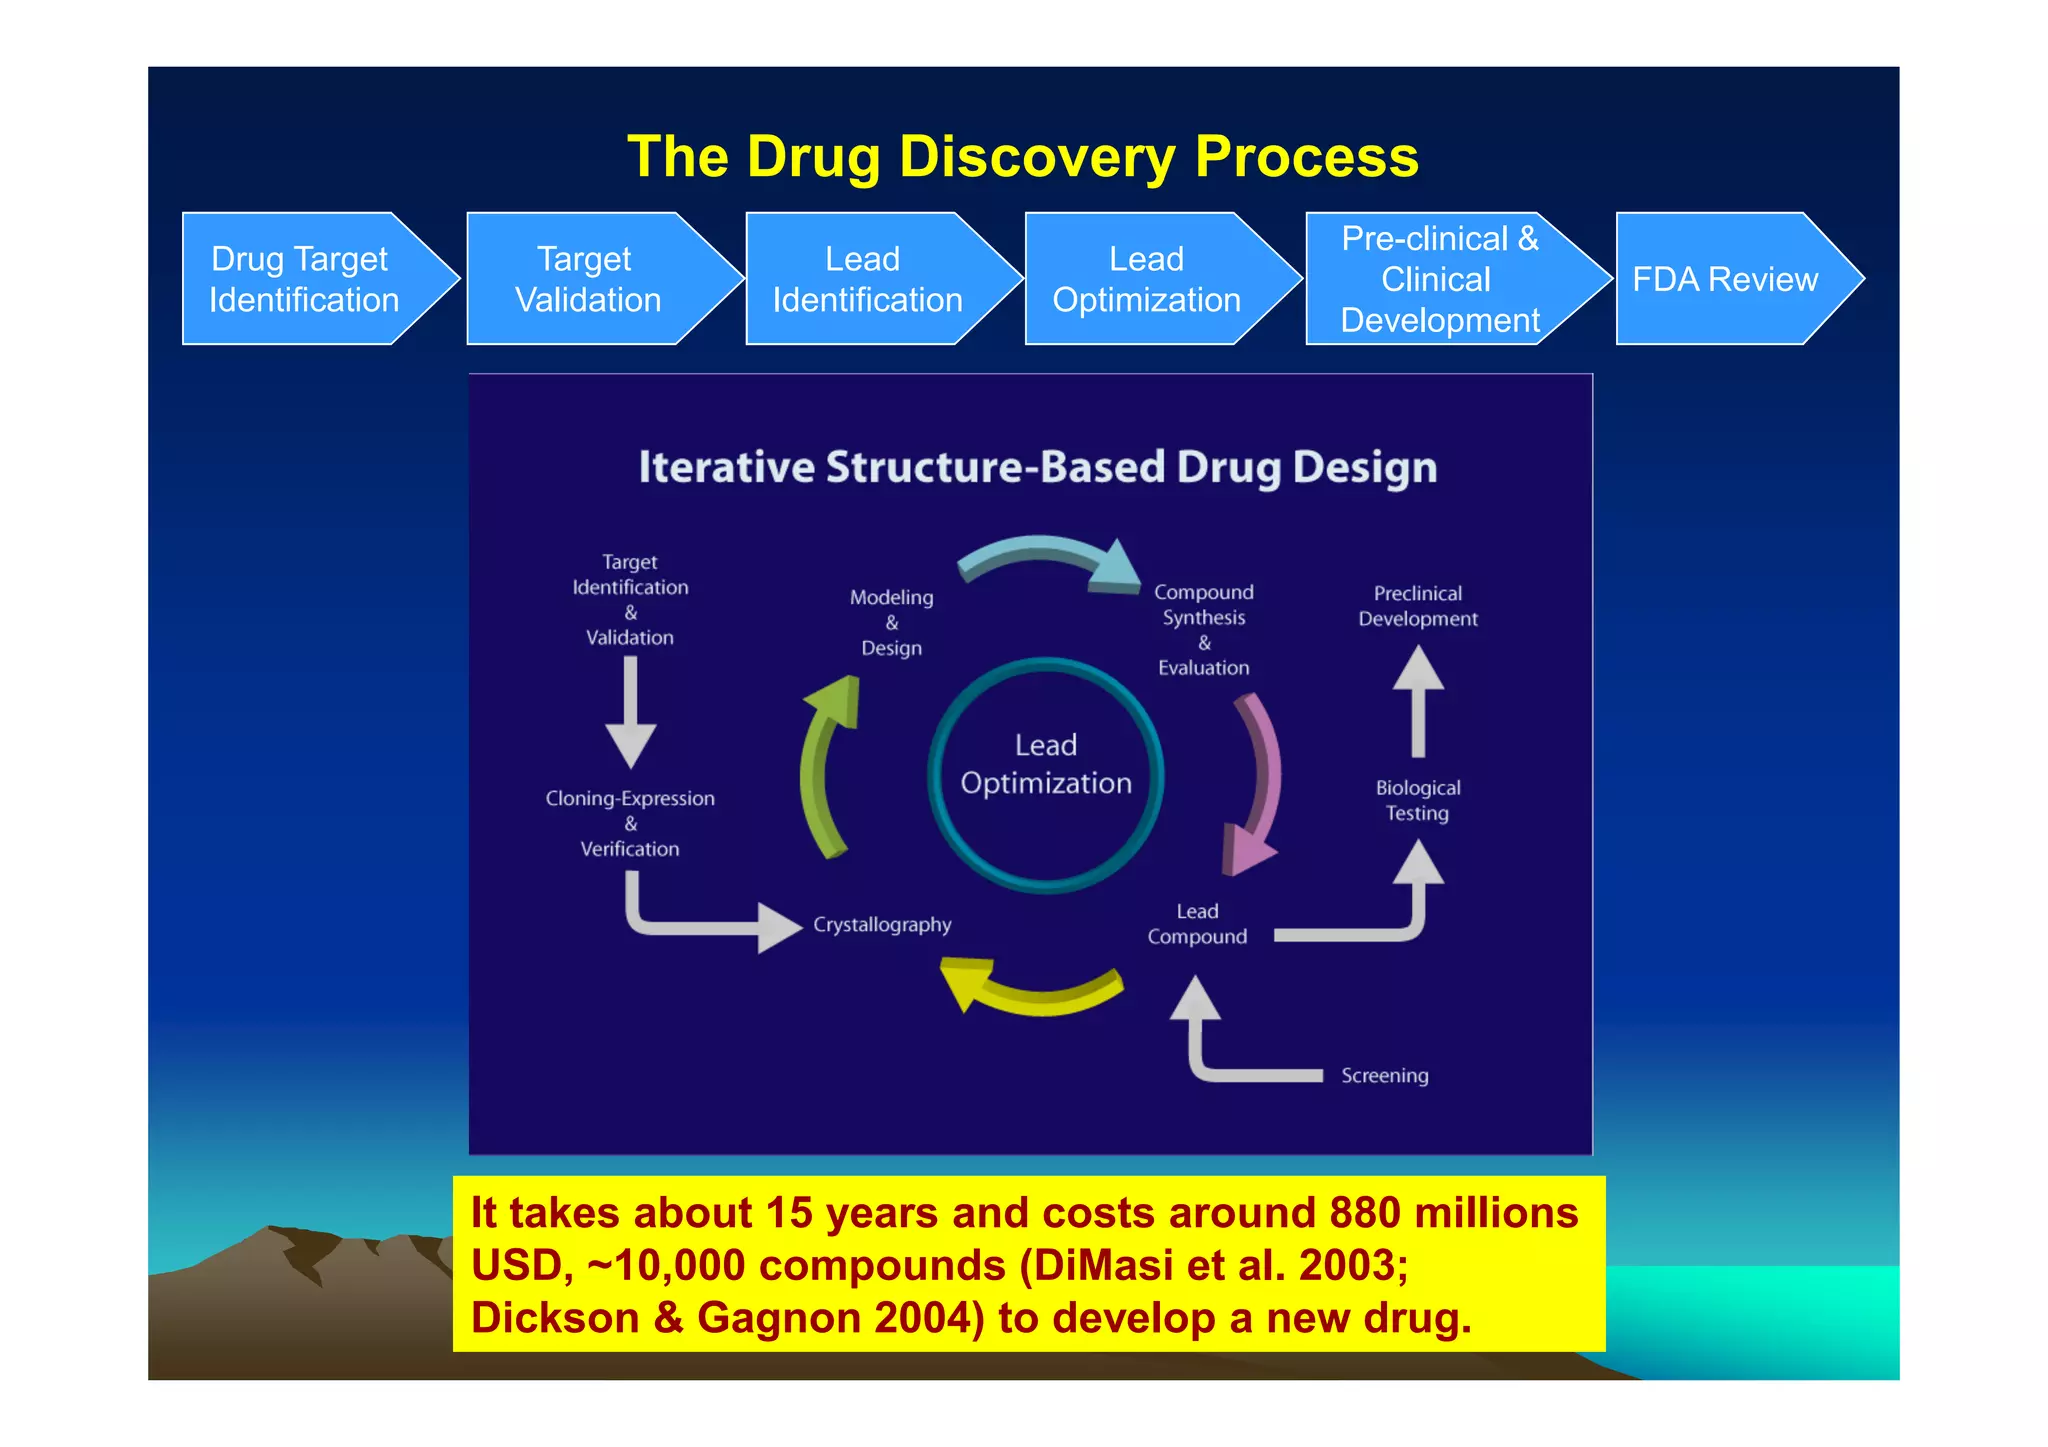
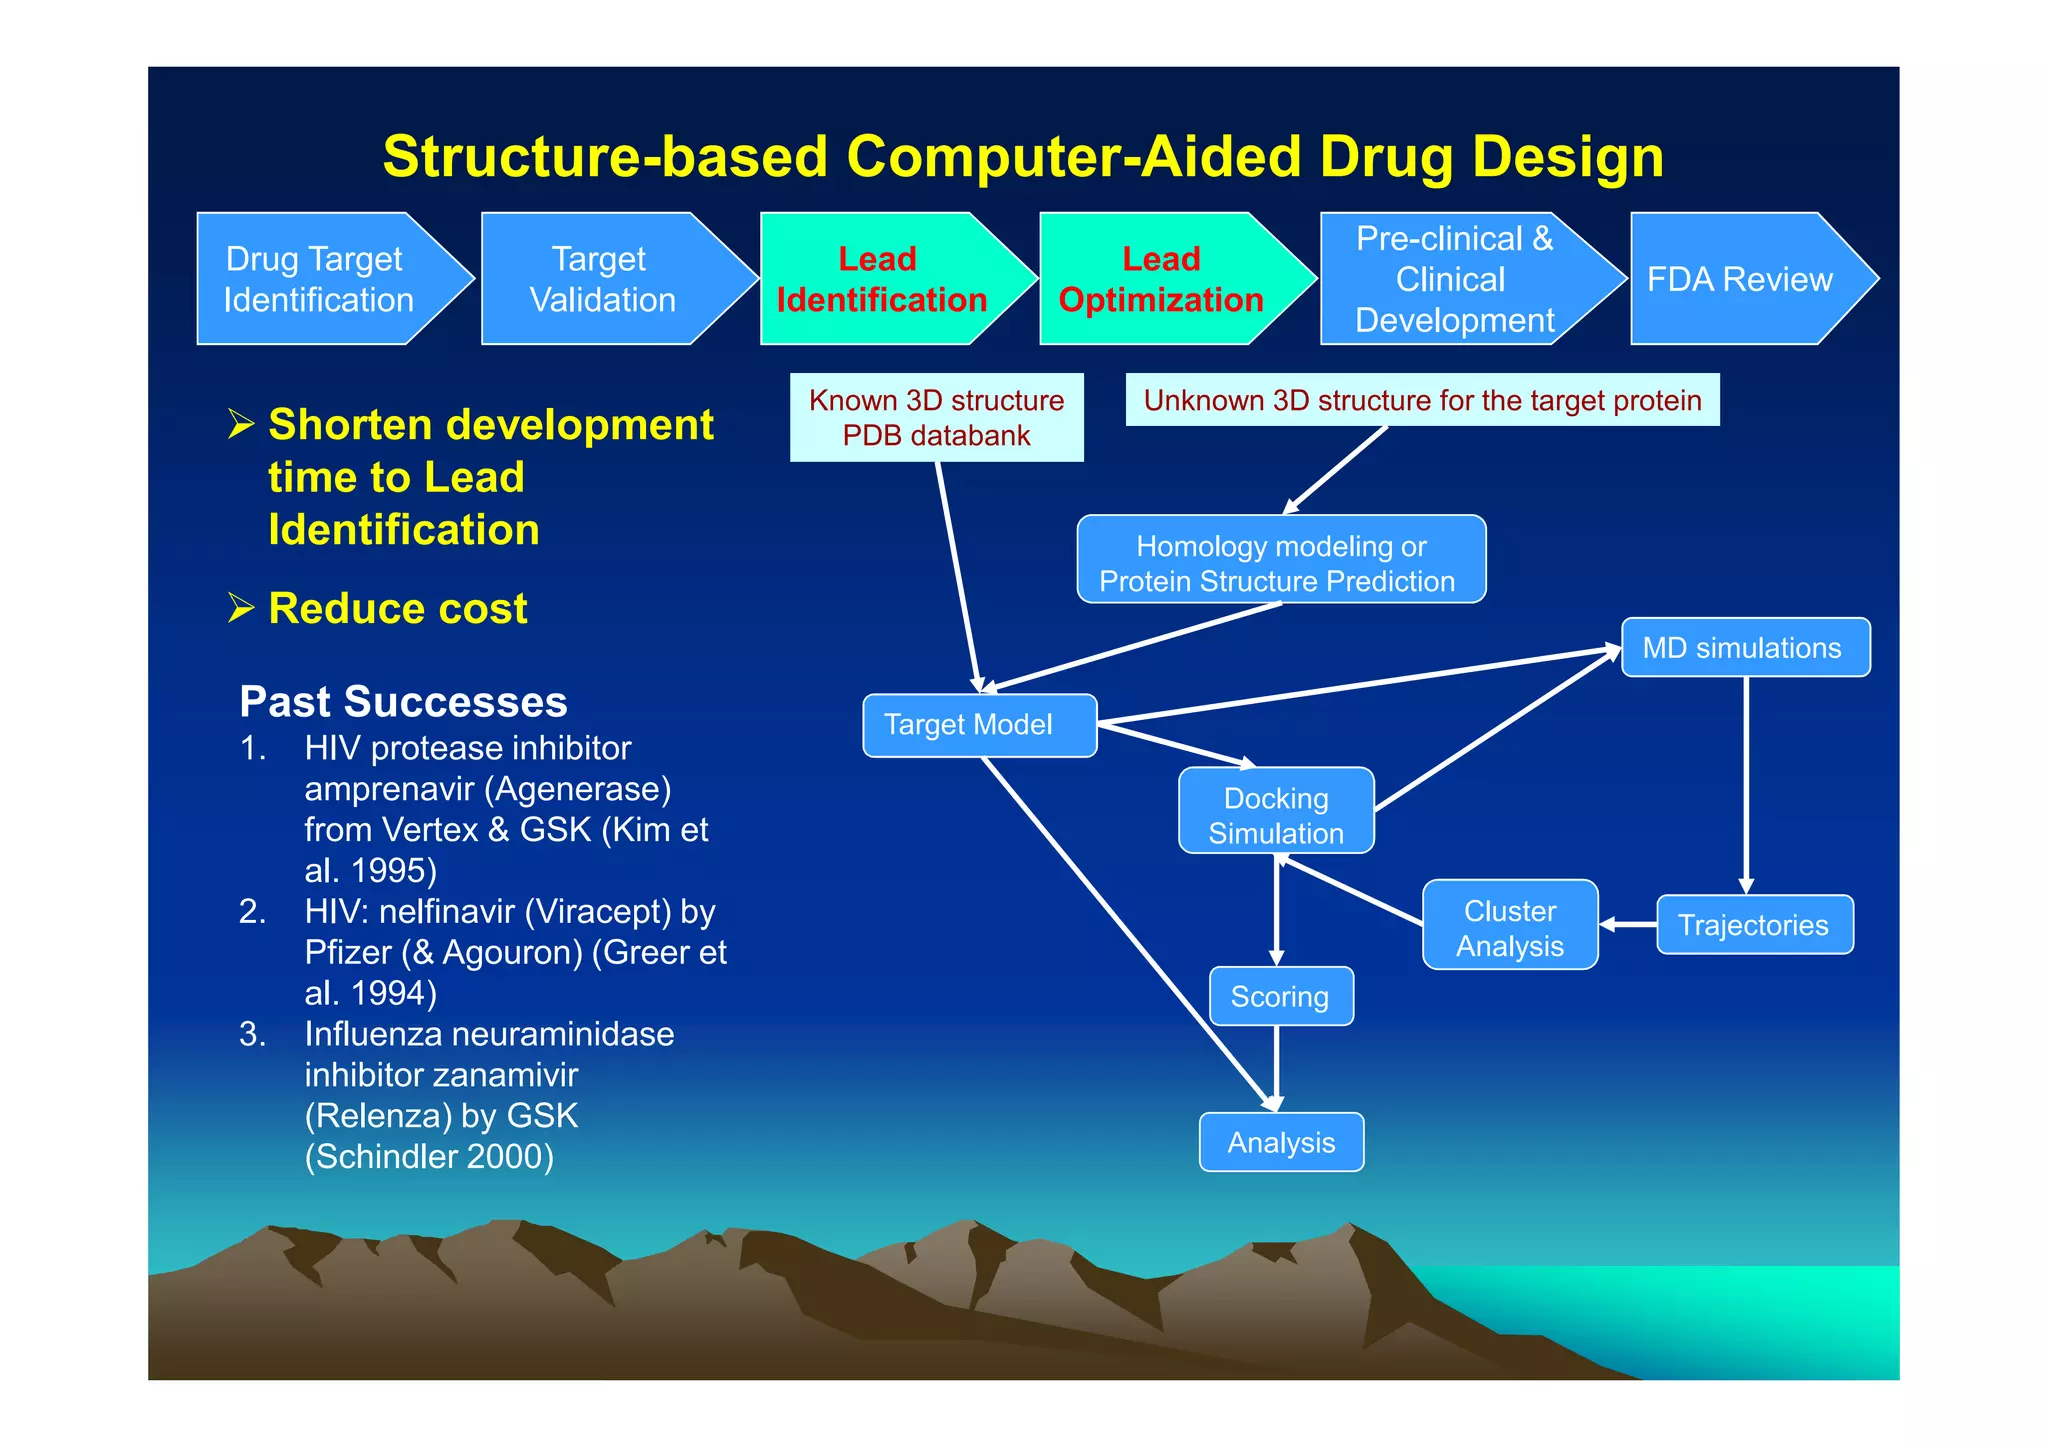
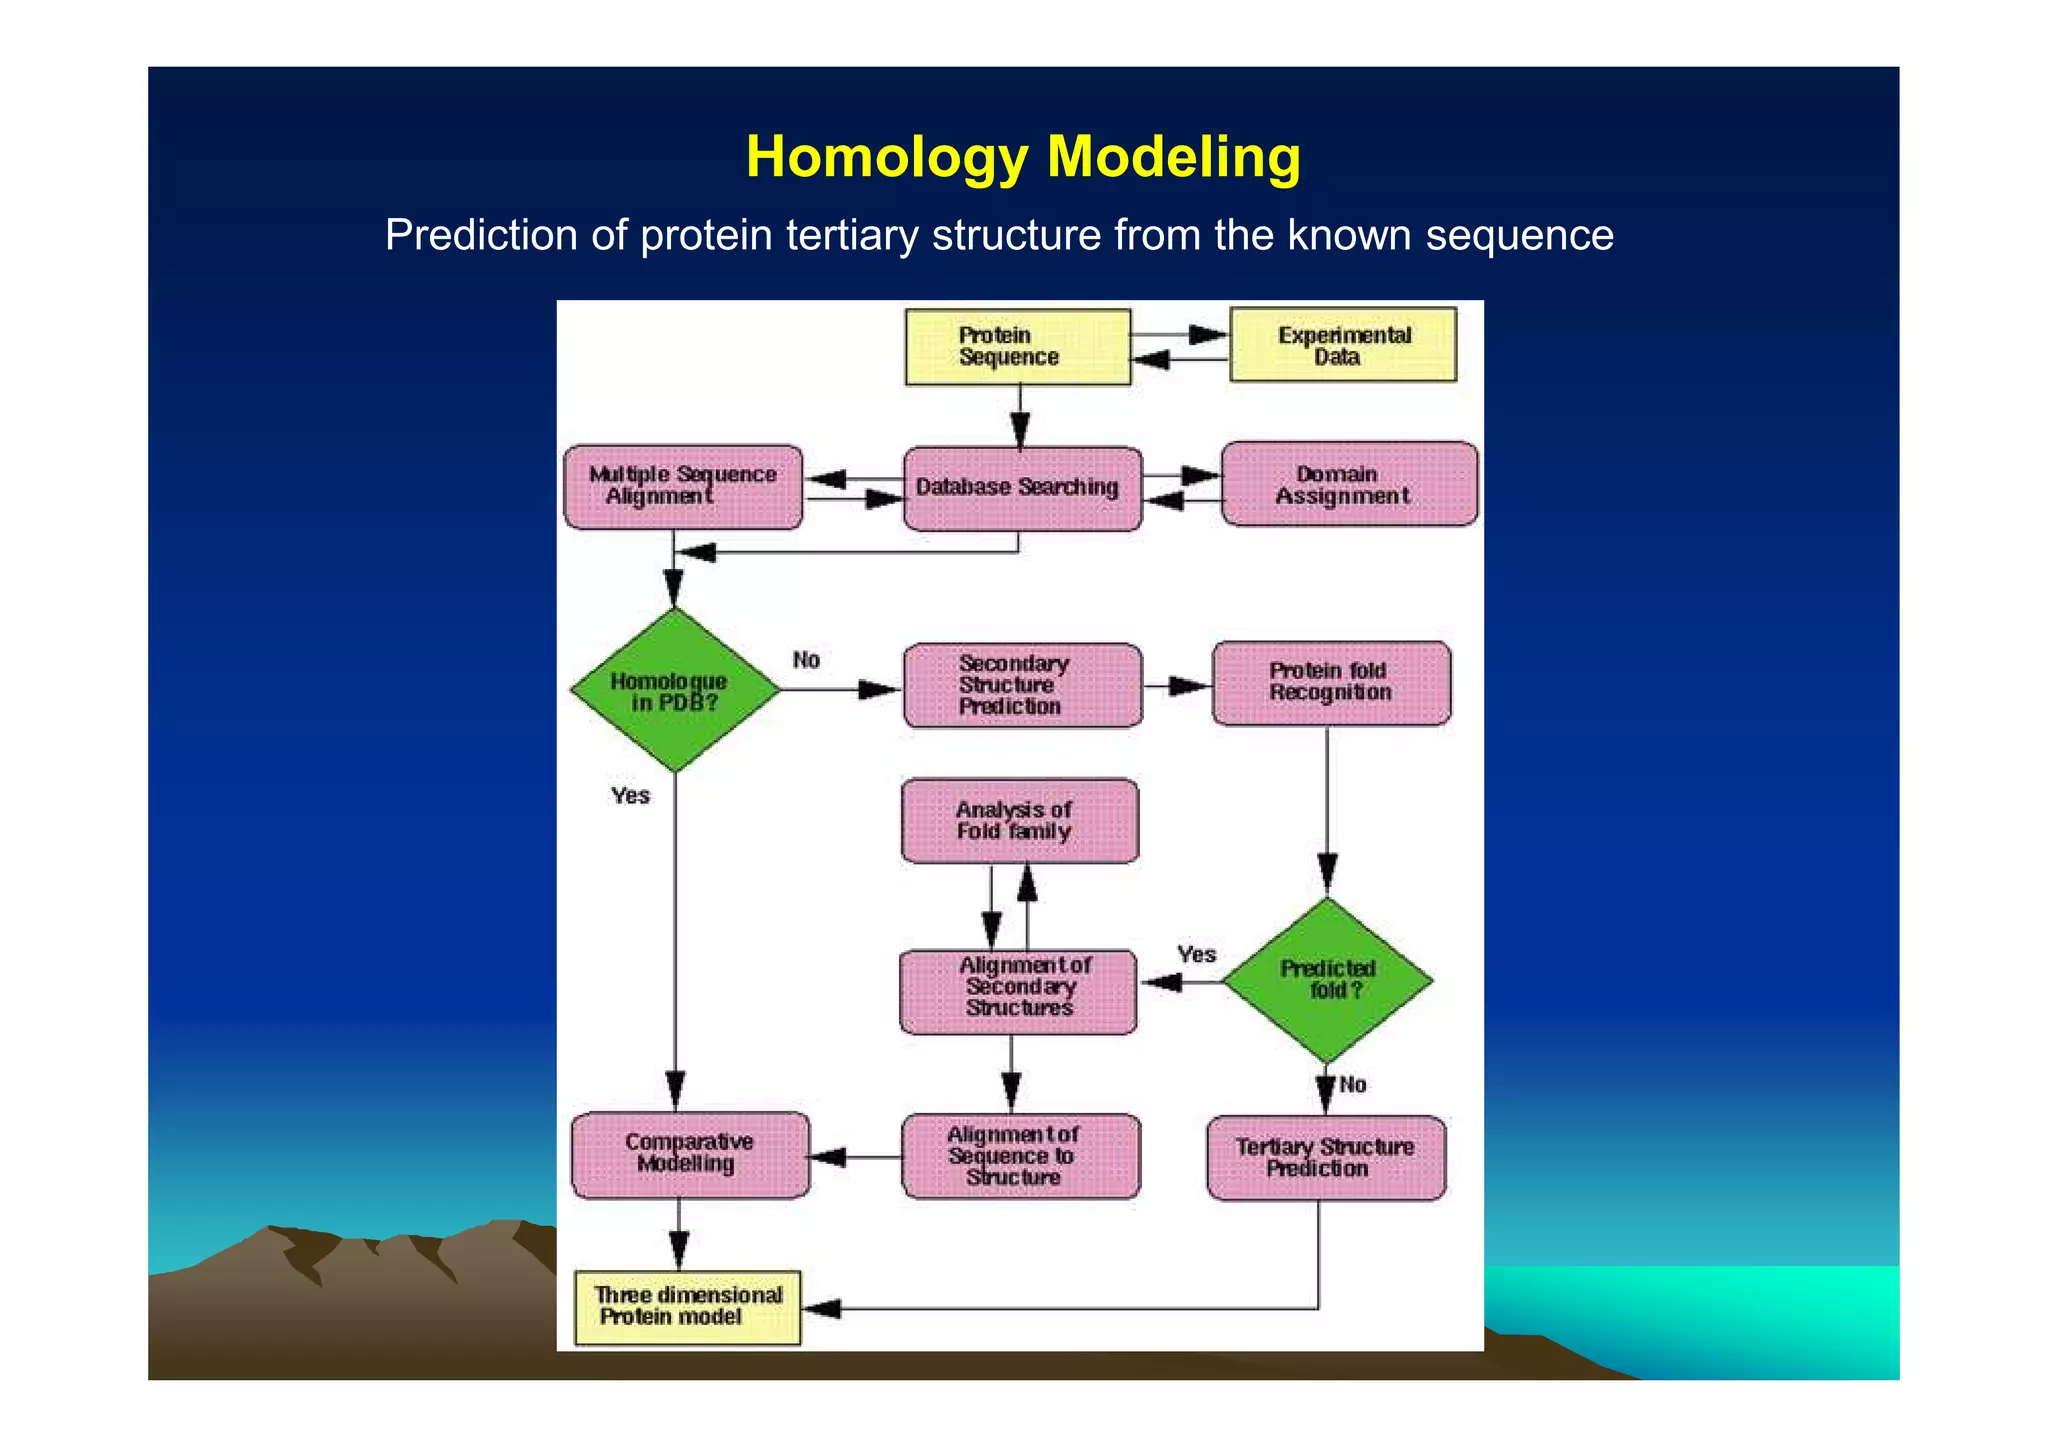
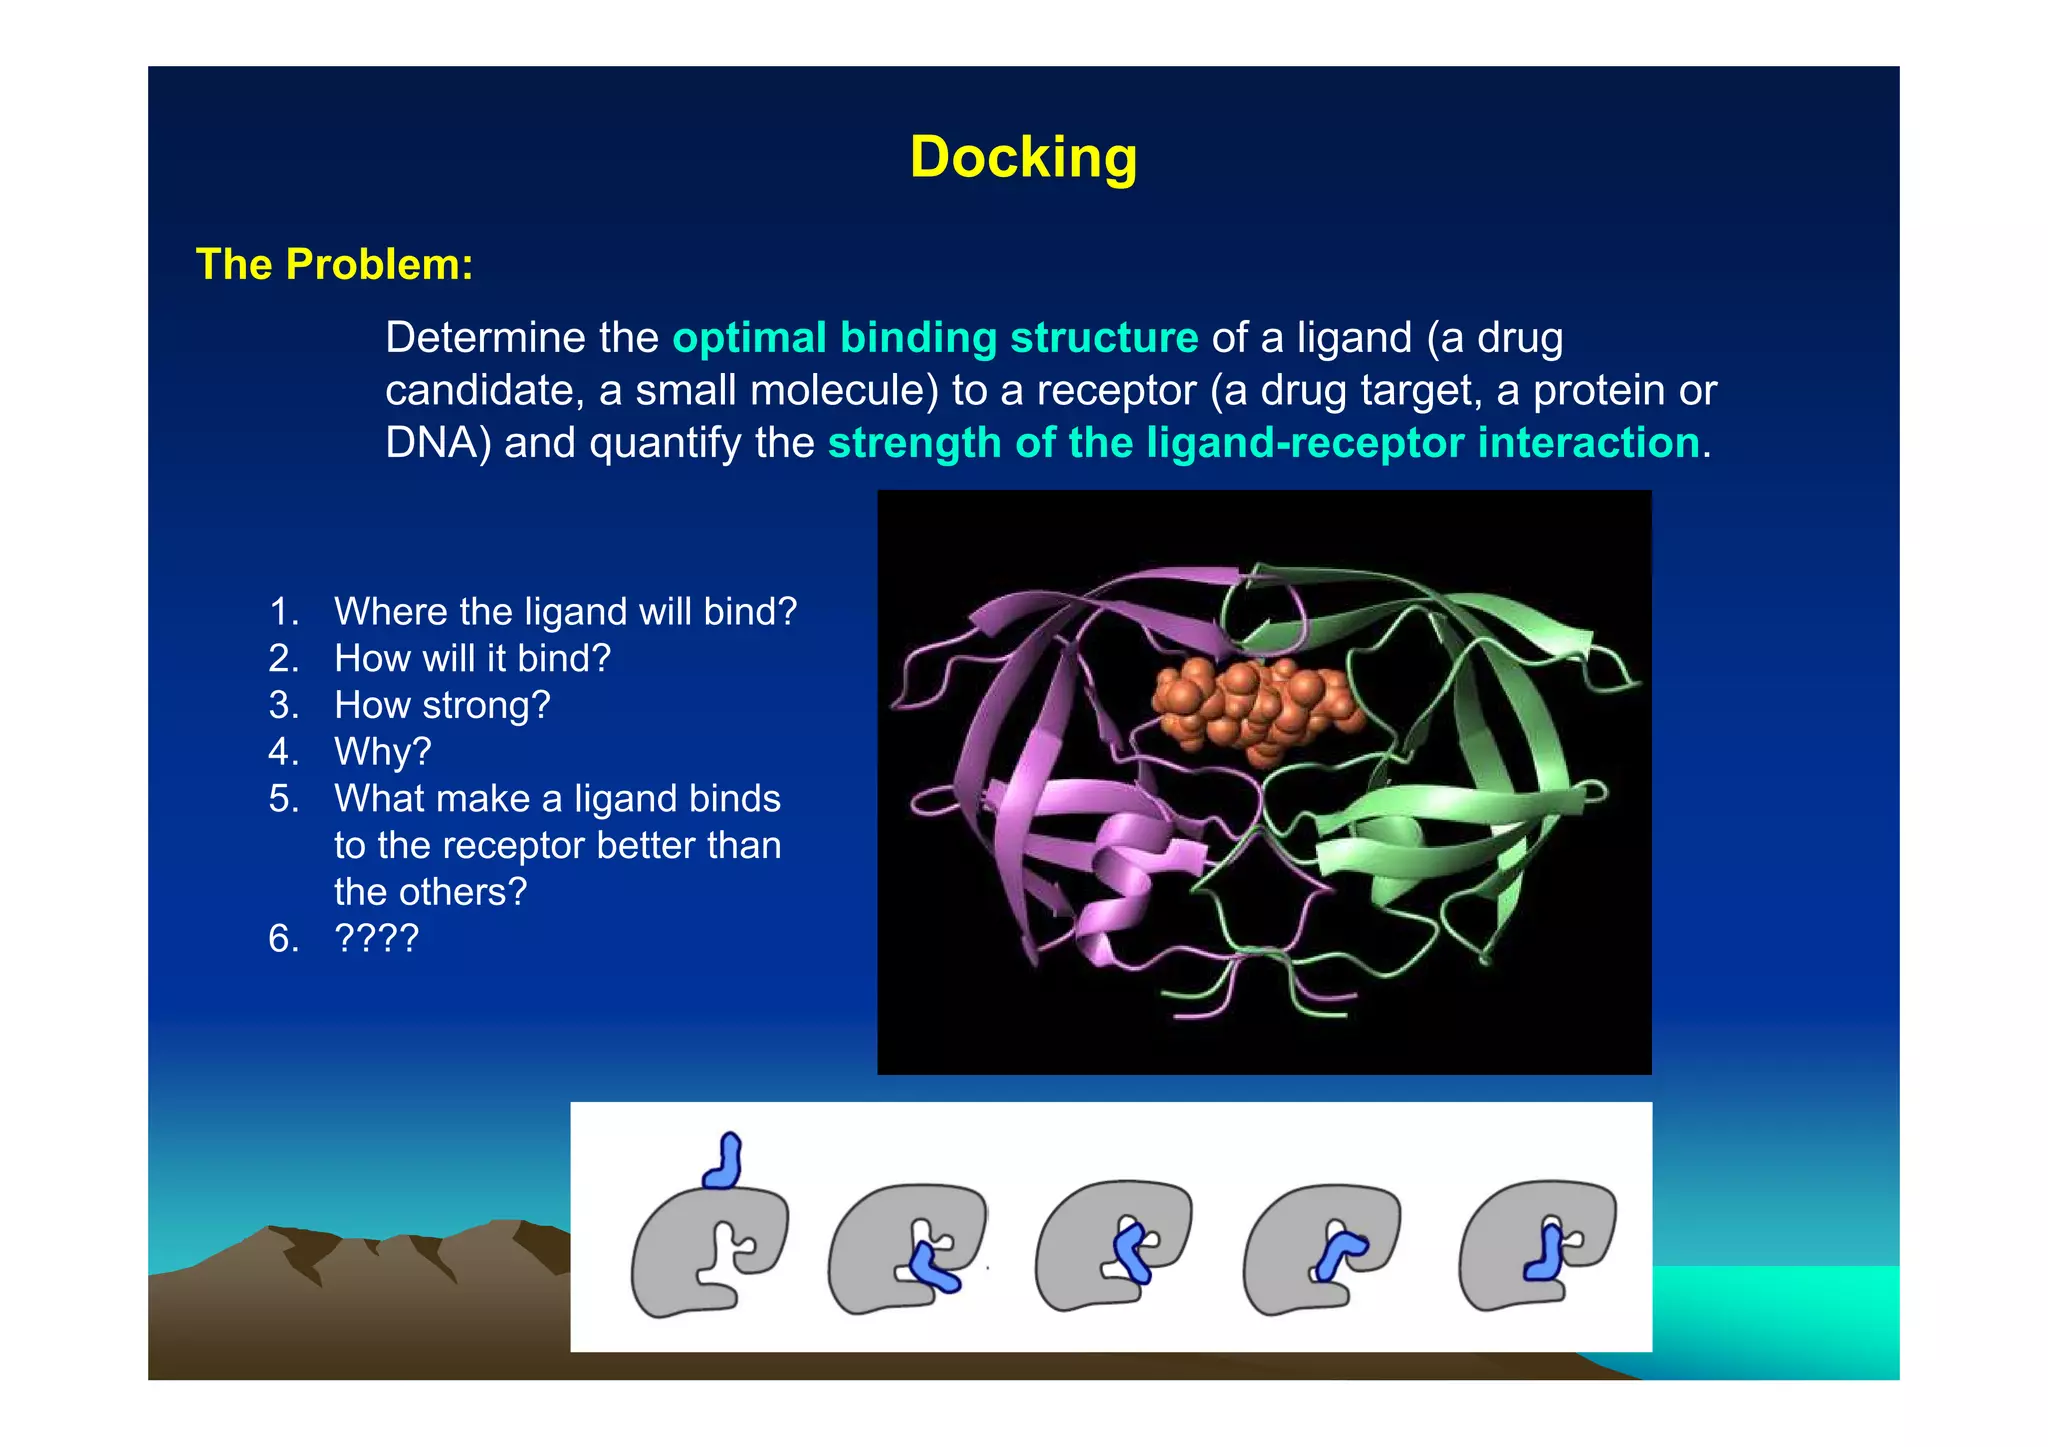
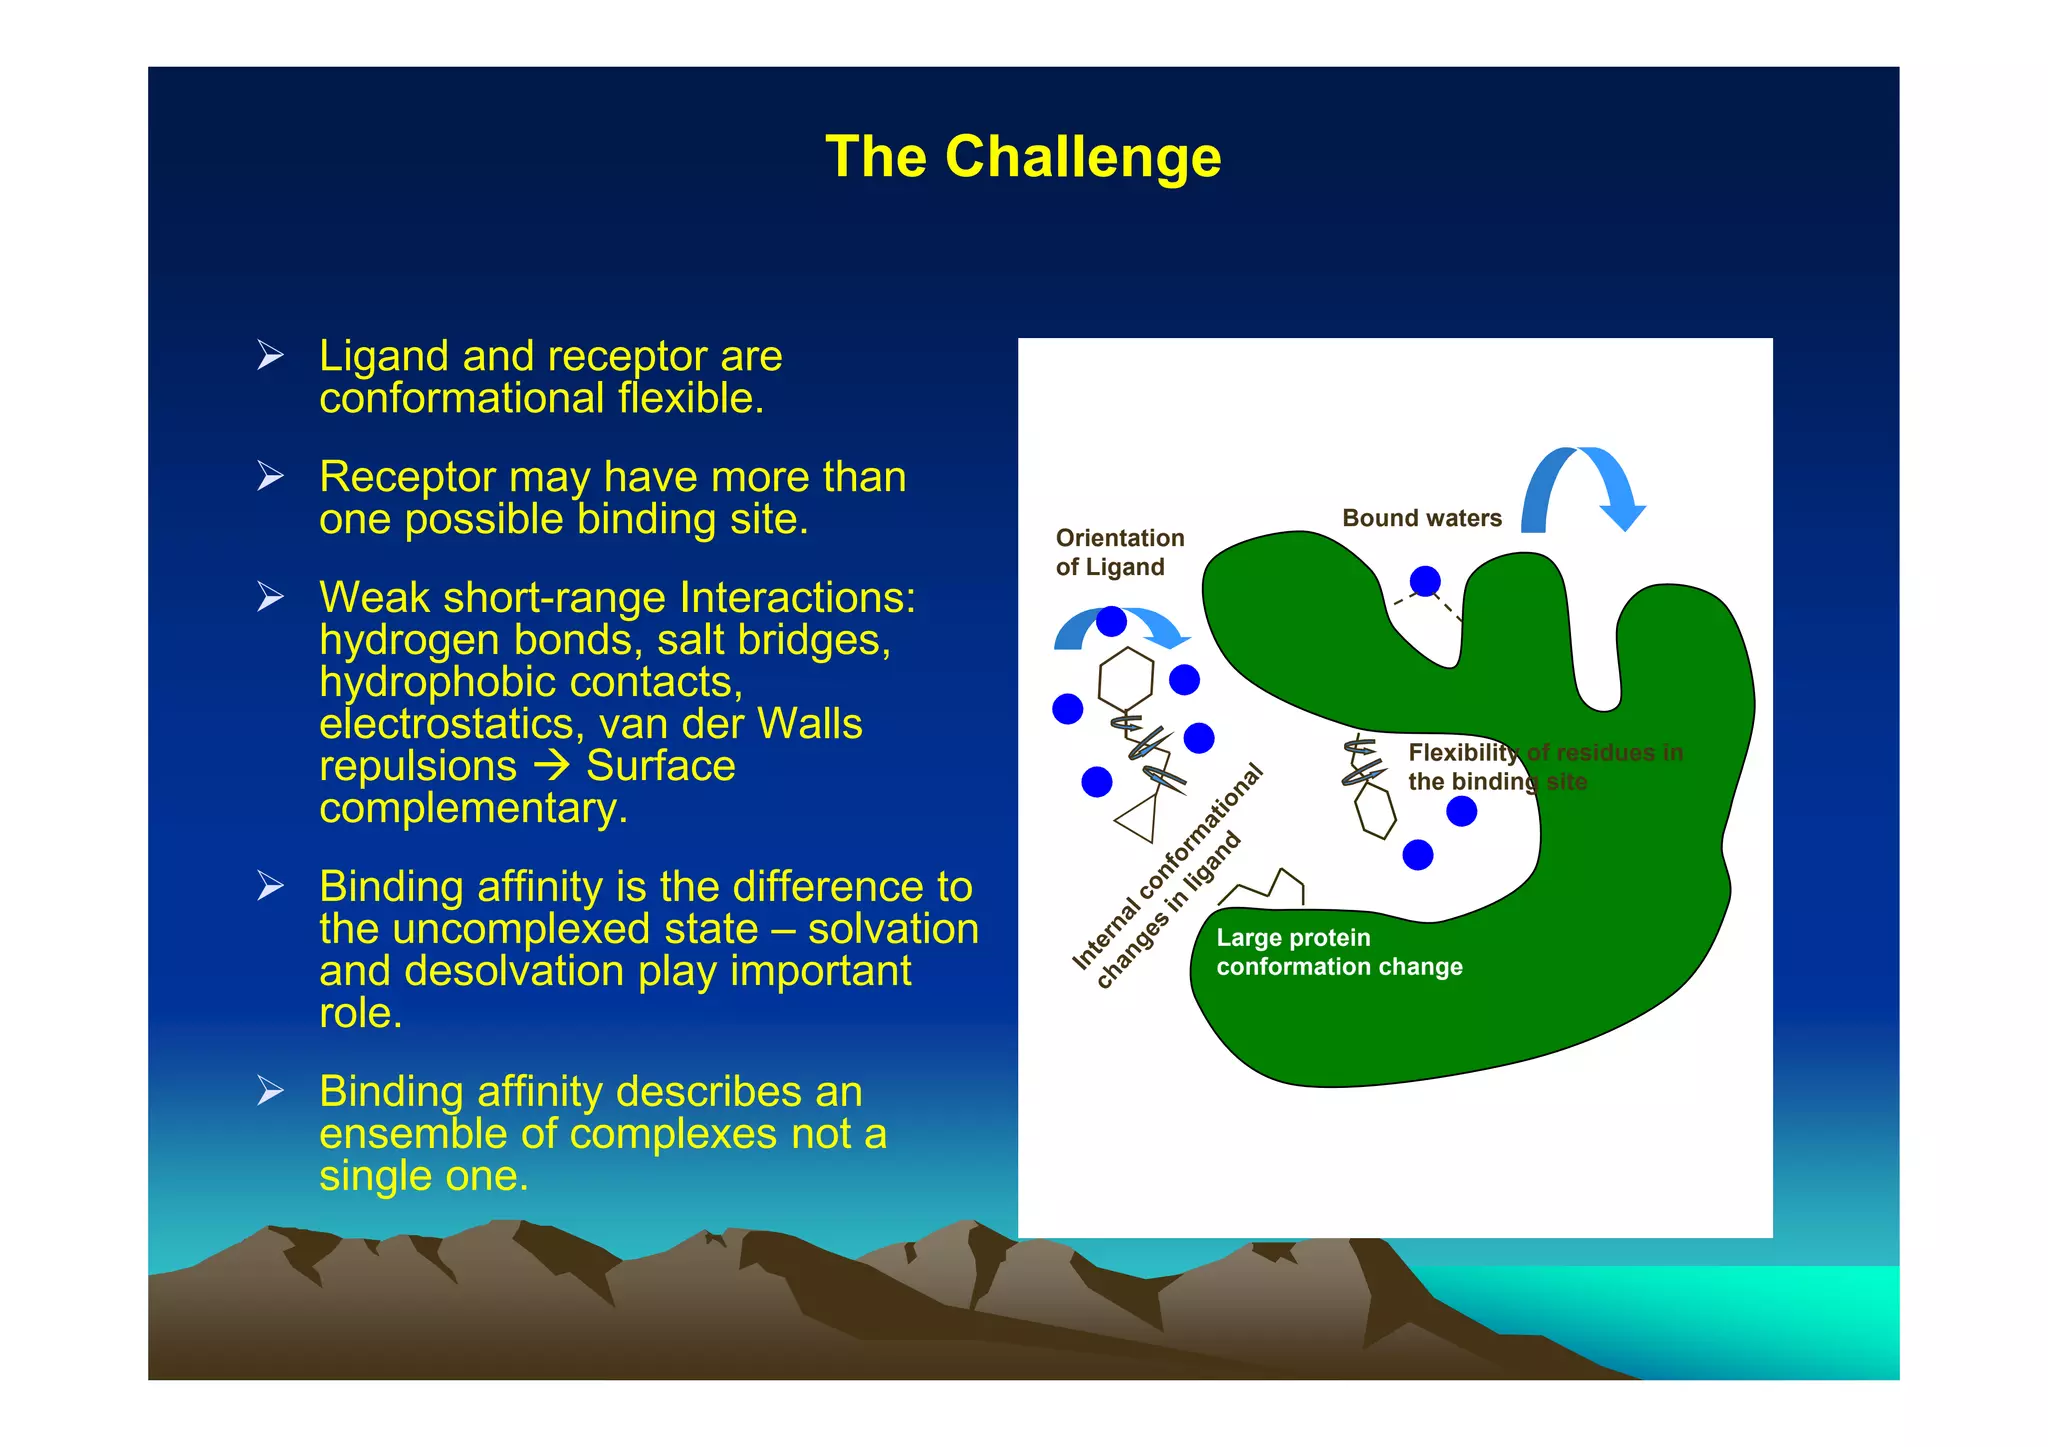
The document discusses structure-based computer-aided drug design. It describes the drug discovery process and challenges involved in predicting how small molecules bind to protein targets. Key steps in molecular docking include describing the receptor and ligand, sampling possible binding configurations, and scoring the interactions to estimate binding affinity. Genetic and simulated annealing algorithms are commonly used to sample configurations. The accuracy of docking depends on factors like receptor and ligand flexibility.


