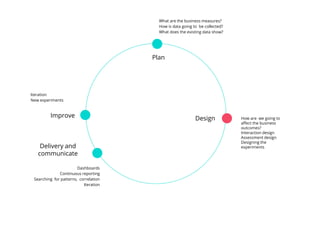
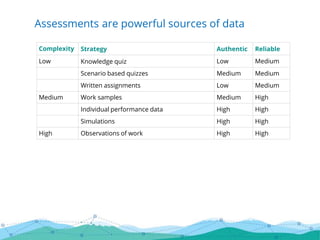
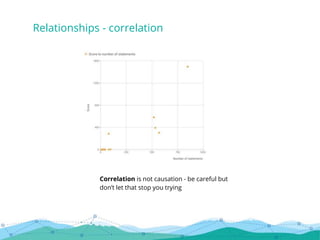
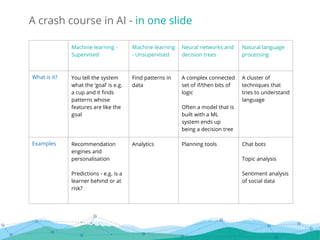
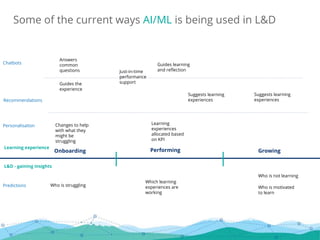
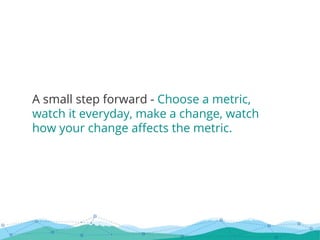
Robin Petterd
Founder of Sprout Labs, host
of the Learning While
Working podcast and virtual
conference
Sprout Labs builds digital learning platforms that enable you and your
team to author, deliver and measure high impact digital learning
ecosystems.
• The Learning While Working podcast
• The blog
• eBooks
• The recordings of past webinars
• A virtual conference
Content from Sprout Labs
• What are data-driven approaches to learning?
• Learning analytics and return on investment
• Useful statistics and visualisation techniques for L&D
• The link between learning analytics and xAPI
• Test-driven approaches to learning analytics
• Emerging approaches using artificial intelligence and machine learning
• How to plan a successful learning analytics project
What we are looking at today
L&D professionals need to be proving our value
now
We need to be making innovative leaps forward
What is analytics?
The analysis of data - looking for patterns and
relationships
What is learning data?
Content
Learner’s behaviour while learning
Assessment results
Performance outcomes
Business outcomes
Business data
Learning data
How is learning going
to impact business data?
How is learning going
to change in response
to business data?
Returns/Impact
Saving money Increasing
revenue
It’s often indirect
Most of us don’t work in L&D because of our
interest in numbers and data
Other disciplines have become data-driven e.g
marketing
BUT
Smart Insights research show nearly 50% of
marketers agree that data is the most
underutilised asset in their organisation.
I think about it as becoming data driven
It’s not just about evaluation and measurement
Plan
DesignImprove How are we going to affect
the business outcomes?
Interaction design
Assessment design
Designing the
experiments
Iteration
New experiments
Dashboards
Continuous reporting
Searching for patterns, correlation
Iteration
What are the business measures?
How is data going to be collected?
What does the existing data show?
Delivery and
communicate
Data is everywhere
Data is not just numbers
Stories, narratives, statements are data
Brinkerhoff success case method
Being data driven is not just about xAPI
xAPI is simply an effective way to store, save and retrieve learning data
Did you know that you can record interactions
with SCORM?
Collecting completions
Collecting detailed learning,
assessment and performance
data
Data collection design is part
of the learning design process
Measuring business impact
Emerging approaches using artificial
intelligence and machine learning
Personalisation, predictions,
powerful insights
Where do you think
most L&D are at?
Patterns to look at within completion data
Timing
Rate
Who
Relationships
What skills does a data driven L&D person have?
Technical
Extracting data
Formatting data
Visualising data
Translator
Can see patterns and gains
insights that relate to the
business
Is able to design
experiments
Plan
DesignImprove
What are the business measures?
How is data going to be collected?
What does the existing data show?
How are we going to affect
the business outcomes?
Interaction design
Assessment design
Designing the
experiments
Iteration
New experiments
Dashboards
Continuous reporting
Searching for patterns, correlation
Iteration
Delivery and
communicate
What is the impact of the program
going to be? What will that look like?
What business metric is going to
change?
Listen to the podcast at:
https://www.sproutlabs.com.au/blog/what-does-
xapi-mean-for-instructional-designers/
Leads to ecosystems and thinking beyond courses and programs
What data can we use to find out
more about our learners?
Reading their ‘digital body language’
Data-Driven Learning Design
Lori Niles-Hofmann
She talks about reading employees’ ‘Digital body language’.
What are people searching for on your intranet?
What are people accessing on your intranet?
What incidents have happened this week?
Listen to the podcast at: https://www.sproutlabs.com.au/blog/data-
driven-learning-design-and-digital-body-language/
I need to design an onboarding program for
new staff members who are working from
home.
Plan
What could be the business metrics?
How is the data going to be collected?
Please add your thoughts in chat
Plan
DesignImprove How are we going to
affect the business
outcomes?
Interaction design
Assessment design
Designing the
experiments
Iteration
New experiments
What are the business measures?
How is data going to be collected?
What does the existing data show?
Dashboards
Continuous reporting
Searching for patterns, correlation
Iteration
Delivery and
communicate
Do we need to collect new data?
How are we going to assess performance?
Assessments are powerful sources of data
Complexity Strategy Authentic Reliable
Low Knowledge quiz Low Medium
Scenario based quizzes Medium Medium
Written assignments Low Medium
Medium Work samples Medium High
Individual performance data High High
Simulations High High
High Observations of work High High
What do you mean by designing
experiments?
A/B test
Two different versions – which one gets the best results?
If we change ......, what happens?
B.A.D.I.R.
1. Business question - what is the hypothesis?
2. Analysis plan
3. Data collection
4. Insights
5. Recommendations
Book - Behind Every Good Decision: How Anyone Can Use Business Analytics to
Turn Data into Profitable Insight - Piyanka Jain, Puneet Sharma. Also
presented at the 2018 Learning While Working virtual conference
Plan
Design
Delivery and
communicate
Improve How are we going to affect
the business outcomes?
Interaction design
Assessment design
Designing the
experiments
Iteration
New experiments
What are the business measures?
How is data going to be collected?
What does the existing data show?
Dashboards
Continuous reporting
Searching for patterns, correlation
Iteration
Make it visual - it’s easier to see the patterns
Make it visual - this helps you tell the story
Useful statistics
Average
Standard deviation is a measure of variability
Standard deviation is
going be higher because
of this event
Correlation is not causation - be careful but
don’t let that stop you trying
Relationships - correlation
Choosing data visualisations
Line charts - time e.g when completions are occurring
Bar chart - comparison and time
Pie - comparison
Donut - comparing or single number
Scatter/bubble - comparing
Often you need to the work with a business
intelligence tool
What is the chain of evidence?
What learning dashboards should be showing
Business metrics Performance outcomes Learning activity
Growth
Employee engagement
Retention
Changes in on-the-job
assessments
Changes in self assessment
Productivity changes
Completions
Hours
Scores
When
Means bringing in different
data
Often means more
sophisticated approaches to
assessment are needed
What learning platforms
normally focus on
Podcast: Measuring the impact of learning ecosystems with Steven Foreman. Also
presented at the 2018 Learning While Working virtual conference
Often we need different tools to bring this all together e.g. PowerBI
Emerging technology - AI
What is AI?
Software that tries to simulate the way humans
think
The growth of machine learning
Software can make decisions in controlled
predictable situations
learning = It finds patterns in past data
Routine work can automated or augmented
How does machine learning (ML) work?
Training - cup
1
Training - cup 2
Data scientist tells the system which features are important
Training - we show it lots of
cups
The system makes a ‘model’ of the cup
Sees a new cup - compares it the model
This is 80% like the model
This is called supervised machine
learning
This is called unsupervised machine
learning
Machine learning -
Supervised
Machine learning
- Unsupervised
Neural networks and
decision trees
Natural language
processing
What is it? You tell the system
what the ‘goal’ is e.g.
a cup and it finds
patterns whose
features are like the
goal
Find patterns in
data
A complex connected
set of if/then bits of
logic
Often a model that is
built with a ML
system ends up
being a decision tree
A cluster of
techniques that
tries to understand
language
Examples Recommendation
engines and
personalisation
Predictions - e.g. is a
learner behind or at
risk?
Analytics Planning tools Chat bots
Topic analysis
Sentiment analysis
of social data
A crash course in AI - in one slide
Performing GrowingOnboarding
Predictions
Personalisation
Recommendations
Chatbots
Who is struggling
Who is not learning
Which learning
experiences are
working
Answers
common
questions
Learning
experiences
allocated based
on KPI
Suggests learning
experiences
Who is motivated
to learn
Suggests learning
experiences
Guides the
experience
Just-in-time
performance
support
Guides learning
and reflection
Changes to help
with what they
might be
struggling
Some of the current ways AI/ML is being used in L&D
Learning experience
L&D - gaining insights
A small step forward - Choose a metric,
watch it everyday, make a change, watch
how your change affects the metric.
Dr Robin Petterd
M: +61 419 101 928
E: robin@sproutlabs.com.au
If you want to talk about how Sprout
Labs can help you become more data
driven and plan your learning analytics
projects please get in contact.

Planning your analytics journey - webinar slides

  • 2.
    Robin Petterd Founder ofSprout Labs, host of the Learning While Working podcast and virtual conference
  • 3.
    Sprout Labs buildsdigital learning platforms that enable you and your team to author, deliver and measure high impact digital learning ecosystems.
  • 4.
    • The LearningWhile Working podcast • The blog • eBooks • The recordings of past webinars • A virtual conference Content from Sprout Labs
  • 5.
    • What aredata-driven approaches to learning? • Learning analytics and return on investment • Useful statistics and visualisation techniques for L&D • The link between learning analytics and xAPI • Test-driven approaches to learning analytics • Emerging approaches using artificial intelligence and machine learning • How to plan a successful learning analytics project What we are looking at today
  • 6.
    L&D professionals needto be proving our value now We need to be making innovative leaps forward
  • 7.
    What is analytics? Theanalysis of data - looking for patterns and relationships
  • 8.
    What is learningdata? Content Learner’s behaviour while learning Assessment results Performance outcomes Business outcomes
  • 9.
    Business data Learning data Howis learning going to impact business data? How is learning going to change in response to business data?
  • 10.
  • 11.
    Most of usdon’t work in L&D because of our interest in numbers and data
  • 12.
    Other disciplines havebecome data-driven e.g marketing
  • 13.
    BUT Smart Insights researchshow nearly 50% of marketers agree that data is the most underutilised asset in their organisation.
  • 14.
    I think aboutit as becoming data driven
  • 15.
    It’s not justabout evaluation and measurement
  • 16.
    Plan DesignImprove How arewe going to affect the business outcomes? Interaction design Assessment design Designing the experiments Iteration New experiments Dashboards Continuous reporting Searching for patterns, correlation Iteration What are the business measures? How is data going to be collected? What does the existing data show? Delivery and communicate
  • 17.
  • 18.
    Data is notjust numbers
  • 19.
    Stories, narratives, statementsare data Brinkerhoff success case method
  • 20.
    Being data drivenis not just about xAPI xAPI is simply an effective way to store, save and retrieve learning data
  • 23.
    Did you knowthat you can record interactions with SCORM?
  • 24.
    Collecting completions Collecting detailedlearning, assessment and performance data Data collection design is part of the learning design process Measuring business impact Emerging approaches using artificial intelligence and machine learning Personalisation, predictions, powerful insights Where do you think most L&D are at?
  • 25.
    Patterns to lookat within completion data Timing Rate Who Relationships
  • 26.
    What skills doesa data driven L&D person have? Technical Extracting data Formatting data Visualising data Translator Can see patterns and gains insights that relate to the business Is able to design experiments
  • 27.
    Plan DesignImprove What are thebusiness measures? How is data going to be collected? What does the existing data show? How are we going to affect the business outcomes? Interaction design Assessment design Designing the experiments Iteration New experiments Dashboards Continuous reporting Searching for patterns, correlation Iteration Delivery and communicate
  • 28.
    What is theimpact of the program going to be? What will that look like? What business metric is going to change? Listen to the podcast at: https://www.sproutlabs.com.au/blog/what-does- xapi-mean-for-instructional-designers/
  • 29.
    Leads to ecosystemsand thinking beyond courses and programs
  • 30.
    What data canwe use to find out more about our learners? Reading their ‘digital body language’
  • 31.
    Data-Driven Learning Design LoriNiles-Hofmann She talks about reading employees’ ‘Digital body language’. What are people searching for on your intranet? What are people accessing on your intranet? What incidents have happened this week? Listen to the podcast at: https://www.sproutlabs.com.au/blog/data- driven-learning-design-and-digital-body-language/
  • 32.
    I need todesign an onboarding program for new staff members who are working from home. Plan What could be the business metrics? How is the data going to be collected? Please add your thoughts in chat
  • 33.
    Plan DesignImprove How arewe going to affect the business outcomes? Interaction design Assessment design Designing the experiments Iteration New experiments What are the business measures? How is data going to be collected? What does the existing data show? Dashboards Continuous reporting Searching for patterns, correlation Iteration Delivery and communicate
  • 34.
    Do we needto collect new data? How are we going to assess performance?
  • 35.
    Assessments are powerfulsources of data Complexity Strategy Authentic Reliable Low Knowledge quiz Low Medium Scenario based quizzes Medium Medium Written assignments Low Medium Medium Work samples Medium High Individual performance data High High Simulations High High High Observations of work High High
  • 36.
    What do youmean by designing experiments?
  • 37.
    A/B test Two differentversions – which one gets the best results?
  • 38.
    If we change......, what happens?
  • 39.
    B.A.D.I.R. 1. Business question- what is the hypothesis? 2. Analysis plan 3. Data collection 4. Insights 5. Recommendations Book - Behind Every Good Decision: How Anyone Can Use Business Analytics to Turn Data into Profitable Insight - Piyanka Jain, Puneet Sharma. Also presented at the 2018 Learning While Working virtual conference
  • 40.
    Plan Design Delivery and communicate Improve Howare we going to affect the business outcomes? Interaction design Assessment design Designing the experiments Iteration New experiments What are the business measures? How is data going to be collected? What does the existing data show? Dashboards Continuous reporting Searching for patterns, correlation Iteration
  • 41.
    Make it visual- it’s easier to see the patterns
  • 42.
    Make it visual- this helps you tell the story
  • 43.
  • 44.
  • 45.
    Standard deviation isa measure of variability Standard deviation is going be higher because of this event
  • 46.
    Correlation is notcausation - be careful but don’t let that stop you trying Relationships - correlation
  • 47.
  • 48.
    Line charts -time e.g when completions are occurring
  • 49.
    Bar chart -comparison and time
  • 50.
  • 51.
    Donut - comparingor single number
  • 52.
  • 53.
    Often you needto the work with a business intelligence tool
  • 54.
    What is thechain of evidence?
  • 55.
    What learning dashboardsshould be showing Business metrics Performance outcomes Learning activity Growth Employee engagement Retention Changes in on-the-job assessments Changes in self assessment Productivity changes Completions Hours Scores When Means bringing in different data Often means more sophisticated approaches to assessment are needed What learning platforms normally focus on Podcast: Measuring the impact of learning ecosystems with Steven Foreman. Also presented at the 2018 Learning While Working virtual conference Often we need different tools to bring this all together e.g. PowerBI
  • 56.
  • 57.
    What is AI? Softwarethat tries to simulate the way humans think
  • 58.
    The growth ofmachine learning Software can make decisions in controlled predictable situations learning = It finds patterns in past data Routine work can automated or augmented
  • 59.
    How does machinelearning (ML) work?
  • 60.
  • 61.
    Training - cup2 Data scientist tells the system which features are important
  • 62.
    Training - weshow it lots of cups
  • 63.
    The system makesa ‘model’ of the cup
  • 64.
    Sees a newcup - compares it the model This is 80% like the model
  • 65.
    This is calledsupervised machine learning
  • 68.
    This is calledunsupervised machine learning
  • 69.
    Machine learning - Supervised Machinelearning - Unsupervised Neural networks and decision trees Natural language processing What is it? You tell the system what the ‘goal’ is e.g. a cup and it finds patterns whose features are like the goal Find patterns in data A complex connected set of if/then bits of logic Often a model that is built with a ML system ends up being a decision tree A cluster of techniques that tries to understand language Examples Recommendation engines and personalisation Predictions - e.g. is a learner behind or at risk? Analytics Planning tools Chat bots Topic analysis Sentiment analysis of social data A crash course in AI - in one slide
  • 70.
    Performing GrowingOnboarding Predictions Personalisation Recommendations Chatbots Who isstruggling Who is not learning Which learning experiences are working Answers common questions Learning experiences allocated based on KPI Suggests learning experiences Who is motivated to learn Suggests learning experiences Guides the experience Just-in-time performance support Guides learning and reflection Changes to help with what they might be struggling Some of the current ways AI/ML is being used in L&D Learning experience L&D - gaining insights
  • 71.
    A small stepforward - Choose a metric, watch it everyday, make a change, watch how your change affects the metric.
  • 72.
    Dr Robin Petterd M:+61 419 101 928 E: robin@sproutlabs.com.au If you want to talk about how Sprout Labs can help you become more data driven and plan your learning analytics projects please get in contact.