yikc 232140 Algorithm Investment Report
•
0 likes•89 views

This document provides a summary of a company's financial performance and stock price over several periods. It includes tables with metrics like sales, operating profit, debt ratio, and earnings per share. Charts show the company's current and indication stock prices, and how they compare to peers in the sector. A scoring system evaluates the probability of the stock price rising. Based on this analysis, the summary recommends purchasing the stock at its current or indicated prices.
![[Price for scheduled purchasing]
Arbitrarily made
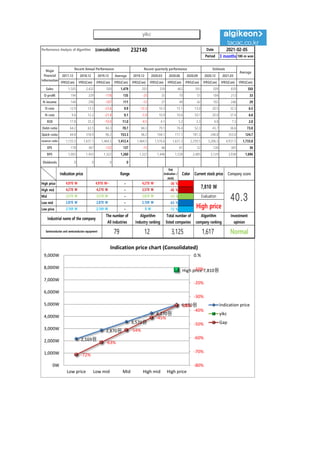
Algorithm stocks Trading Strategies (consolidated) 232140 Date
Period
Gap
(Indication /
stock)
Color
2021-02-05
3 months
Current stock price Evaluation
Stock price rise
probability score
Investment opinion Prospective purchase amount
7,810 W High price 41.1 Normal 3,000,000 W
Suggested Purchase
Amount 769,556 W
Number of stocks
purchased 99
Indication price Range Buying / Selling Buying / Selling [Stocks]
High price 4,970 W 4,970 W~ ~ 4,270 W -36 % 279,799 W 56
High mid 4,270 W 4,270 W ~ 3,570 W -45 % 348,798 W 82
Mid 3,570 W 3,570 W ~ 2,870 W -54 % 417,797 W 117
Low mid 2,870 W 2,870 W ~ 2,169 W -63 % 486,796 W 170
low price 2,169 W 2,169 W ~ 0 W -72 % 555,795 W 256
Stock price rise
probability score
A Sector 45.8 49.8 47.3 47.5 54.5 50.6
41.1
B Sector 26.7 27.9 42.9 47.5 40.4 28.8
Total average
2020.09.08 2020.10.12 2020.11.09 2020.12.07 2021.01.07 2021.02.04
36.2 38.9 45.1 40.4 47.4 39.7
15 % -20 %
2020.10.12 2020.11.09 2020.12.07 2021.01.07 2021.02.04
Total of
increase rate
Total score
A Sector 8 % -5 % 1 % 13 % -8 %
1 % 47.3
B Sector 4 % 35 % 10 % -18 % -41 %
Total average 7 % 14 % -12 %
46
50 47 48
54
51
27 28
43
48
40
29
36 39
45
40
47
40
0
10
20
30
40
50
60
2020.09.08 2020.10.12 2020.11.09 2020.12.07 2021.01.07 2021.02.04
Stock price rise probability score
A sector
B sector
Total average
8%
-5%
1%
13%
-8%
4%
35%
10%
-18%
-41%
7%
14%
-12%
15%
-20%
-60%
-40%
-20%
0%
20%
40%
2020.10.12 2020.11.09 2020.12.07 2021.01.07 2021.02.04
Increase rate of stock price rise
A sector
B sector
Total average
yikc](data:image/gif;base64,R0lGODlhAQABAIAAAAAAAP///yH5BAEAAAAALAAAAAABAAEAAAIBRAA7)
Recommended
Recommended
More Related Content
What's hot
What's hot (20)
Similar to yikc 232140 Algorithm Investment Report
Similar to yikc 232140 Algorithm Investment Report (20)
More from 알고리즘 기업분석 컨설팅-알기컨,algikeon
More from 알고리즘 기업분석 컨설팅-알기컨,algikeon (20)
Recently uploaded
Recently uploaded (20)
yikc 232140 Algorithm Investment Report
- 1. Performance Analysis of Algorithm (consolidated) 232140 Date Period 3 months 100-m won 2017.12 2018.12 2019.12 Average 2019.12 2020.03 2020.06 2020.09 2020.12 2021.03 IFRS(Con) IFRS(Con) IFRS(Con) IFRS(Con) IFRS(Con) IFRS(Con) IFRS(Con) IFRS(Con) IFRS(Con) IFRS(Con) IFRS(Con) Sales 1,505 2,432 500 1,479 203 339 463 393 509 659 350 O-profit 194 329 -118 135 -25 35 70 51 104 213 33 N-income 144 296 -107 111 -12 37 49 42 102 246 29 O-rate 12.9 13.5 -23.6 0.9 -12.3 10.3 15.1 13.0 20.5 32.3 6.5 N-rate 9.6 12.2 -21.4 0.1 -5.9 10.9 10.6 10.7 20.0 37.4 6.6 ROE 17.8 25.2 -10.0 11.0 -4.5 4.1 5.2 3.3 4.8 7.3 2.0 Debt-ratio 64.2 63.5 84.3 70.7 84.3 79.1 76.4 52.3 43.7 36.6 73.0 Quick-ratio 44.8 318.9 96.2 153.3 96.2 104.1 117.1 181.3 248.8 353.0 124.7 reserve-ratio 1,135.5 1,637.1 1,464.5 1,412.4 1,464.5 1,576.6 1,631.3 2,259.5 3,206.3 4,931.5 1,733.0 EPS 178 367 -132 137 -15 46 61 52 126 305 36 BPS 1,003 1,455 1,322 1,260 1,322 1,446 1,528 2,485 3,129 3,938 1,696 Dividends 0 0 0 0 2021-02-05 Major Financial Information Recent Annual Performance Recent quarterly performance Estimate Average Gap (Indication / stock) Color High price ~ -36 % High mid ~ -45 % Mid ~ -54 % Low mid ~ -63 % Low price ~ -72 % Indication price Range Current stock price Company score 4,270 W 4,270 W 3,570 W 3,570 W 3,570 W 2,870 W Evaluation 4,970 W 4,970 W~ 4,270 W 7,810 W 40.3 2,870 W 2,870 W 2,169 W High price Normal 2,169 W 2,169 W 0 W Industrial name of the company The number of All industries Algorithm Industry ranking Total number of listed companies Algorithm company ranking Investment opinion Semiconductor and semiconductor equipment 79 12 3,125 1,617 2,169원 2,870원 3,570원 4,270원 4,970원 High price 7,810원 -72% -63% -54% -45% -36% -80% -70% -60% -50% -40% -30% -20% -10% 0.% 0W 1,000W 2,000W 3,000W 4,000W 5,000W 6,000W 7,000W 8,000W 9,000W Low price Low mid Mid High mid High price Indication price chart (Consolidated) Indication price yikc Gap yikc
- 2. [Price for scheduled purchasing] Arbitrarily made Algorithm stocks Trading Strategies (consolidated) 232140 Date Period Gap (Indication / stock) Color 2021-02-05 3 months Current stock price Evaluation Stock price rise probability score Investment opinion Prospective purchase amount 7,810 W High price 41.1 Normal 3,000,000 W Suggested Purchase Amount 769,556 W Number of stocks purchased 99 Indication price Range Buying / Selling Buying / Selling [Stocks] High price 4,970 W 4,970 W~ ~ 4,270 W -36 % 279,799 W 56 High mid 4,270 W 4,270 W ~ 3,570 W -45 % 348,798 W 82 Mid 3,570 W 3,570 W ~ 2,870 W -54 % 417,797 W 117 Low mid 2,870 W 2,870 W ~ 2,169 W -63 % 486,796 W 170 low price 2,169 W 2,169 W ~ 0 W -72 % 555,795 W 256 Stock price rise probability score A Sector 45.8 49.8 47.3 47.5 54.5 50.6 41.1 B Sector 26.7 27.9 42.9 47.5 40.4 28.8 Total average 2020.09.08 2020.10.12 2020.11.09 2020.12.07 2021.01.07 2021.02.04 36.2 38.9 45.1 40.4 47.4 39.7 15 % -20 % 2020.10.12 2020.11.09 2020.12.07 2021.01.07 2021.02.04 Total of increase rate Total score A Sector 8 % -5 % 1 % 13 % -8 % 1 % 47.3 B Sector 4 % 35 % 10 % -18 % -41 % Total average 7 % 14 % -12 % 46 50 47 48 54 51 27 28 43 48 40 29 36 39 45 40 47 40 0 10 20 30 40 50 60 2020.09.08 2020.10.12 2020.11.09 2020.12.07 2021.01.07 2021.02.04 Stock price rise probability score A sector B sector Total average 8% -5% 1% 13% -8% 4% 35% 10% -18% -41% 7% 14% -12% 15% -20% -60% -40% -20% 0% 20% 40% 2020.10.12 2020.11.09 2020.12.07 2021.01.07 2021.02.04 Increase rate of stock price rise A sector B sector Total average yikc
- 3. 정보와 완전 정보 결 투자판단 있습니 위배 무단으 숙지하 Compliance notice ① The information provided by The Algorithm Company Analysis Consulting is obtained through reliable data and information and The Algorithm Company Analysis Program (TACAP), but its accuracy or completeness are not guaranteed. Furthermore, it may change over time.Therefore, we are not legally responsible for the results of the data provided by The Algorithm Company Analysis Consulting because of information errors or omissions. ② The Algorithm Company Analysis Consulting and all the information provided on it site are reference materials for investment decisions and the final responsibility of investment is up to users utilizing this information. ③ The Algorithm Company Analysis Consulting and its site do not do anything that violates the related laws such as discretionary transaction. ④ Users can not reallocate and recycle the information provided by The Algorithm Company Analysis Consulting firm let alone the information provided by its Site. ⑤ Be sure to know about application period of this algorithm analysis report in order to improve its accuracy. Tel : 070 - 4667 - 5009 Email : tacac@tacac.co.kr Homepage : tacac.co.kr Blog : tacac.blog.me SERVICES M&A, IPO, RECOVER, CORPORATE RESTRUCTURING, MANAGEMENT OF TECHNOLOGY, BUSINESS STRATEGY, FAMILY BUSINESS Request : http://tacac.co.kr/?page_id=1374 ① Consulting is o The Algorithm accuracy or com change over tim results of the d Consulting bec ② information pr investment dec up ③ do anything th transaction. ④ The Algorithm information pr ⑤ analysis report