wonik ips 240810 Algorithm Investment Report
•
0 likes•61 views

This document contains performance data and financial information for Algorithm company from 2016 to 2019. It also includes stock price indicators and analysis, and recommendations to purchase Algorithm stock. The analysis scores the company's performance as "normal" and suggests purchasing 162 stocks of Algorithm at the current price of 28,800 won per stock.
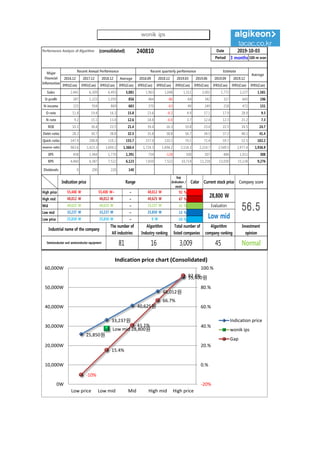
![[Price for scheduled purchasing]
Arbitrarily made
Algorithm stocks Trading Strategies (consolidated) 240810 Date
Period
Gap
(Indication /
stock)
Color
2019-10-03
3 months
Current stock price Evaluation
Stock price rise
probability score
Investment opinion Prospective purchase amount
28,800 W Low mid 56.0 Normal 9,000,000 W
Suggested Purchase
Amount 4,653,101 W
Number of stocks
purchased 162
Indication price Range Buying / Selling Buying / Selling [Stocks]
High price 55,400 W 55,400 W~ ~ 48,012 W 92 % -4,297,618 W -78
High mid 48,012 W 48,012 W ~ 40,625 W 67 % -3,104,049 W -65
Mid 40,625 W 40,625 W ~ 33,237 W 41 % -1,910,481 W -47
Low mid 33,237 W 33,237 W ~ 25,850 W 15 % -716,912 W -22
low price 25,850 W 25,850 W ~ 0 W -10 % 476,657 W 18
Stock price rise
probability score
A Sector 49.4 41.6 48.7 48.7 48.9 49.1
56.0B Sector 24.6 53.8 28.3 48.7 30.4 41.3
Total average
2019.05.09 2019.06.07 2019.07.05 2019.08.02 2019.09.02 2019.10.02
37.0 47.7 38.5 30.4 39.7 45.2
23 % 12 %
2019.06.07 2019.07.05 2019.08.02 2019.09.02 2019.10.02
Total of
increase rate
Total score
A Sector -19 % 15 % 0 % 1 % 0 %
2 % 49.7B Sector 54 % -90 % 42 % -60 % 26 %
Total average 22 % -24 % -27 %
49
42
49 49 49 49
25
54
28
49
30
41
37
48
39
30
40
45
0
10
20
30
40
50
60
2019.05.09 2019.06.07 2019.07.05 2019.08.02 2019.09.02 2019.10.02
Stock price rise probability score
A sector
B sector
Total average
-19%
15%
0% 1% 0%
54%
-90%
42%
-60%
26%22%
-24% -27%
23%
12%
-100%
-80%
-60%
-40%
-20%
0%
20%
40%
60%
80%
2019.06.07 2019.07.05 2019.08.02 2019.09.02 2019.10.02
Increase rate of stock price rise
A sector
B sector
Total average
wonik ips](data:image/gif;base64,R0lGODlhAQABAIAAAAAAAP///yH5BAEAAAAALAAAAAABAAEAAAIBRAA7)
Recommended
Recommended
More Related Content
What's hot
What's hot (20)
Similar to wonik ips 240810 Algorithm Investment Report
Similar to wonik ips 240810 Algorithm Investment Report (18)
More from 알고리즘 기업분석 컨설팅-알기컨,algikeon
More from 알고리즘 기업분석 컨설팅-알기컨,algikeon (20)
Recently uploaded
Recently uploaded (8)
wonik ips 240810 Algorithm Investment Report
- 1. Performance Analysis of Algorithm (consolidated) 240810 Date Period 3 months 100-m won 2016.12 2017.12 2018.12 Average 2018.09 2018.12 2019.03 2019.06 2019.09 2019.12 IFRS(Con) IFRS(Con) IFRS(Con) IFRS(Con) IFRS(Con) IFRS(Con) IFRS(Con) IFRS(Con) IFRS(Con) IFRS(Con) IFRS(Con) Sales 2,441 6,309 6,493 5,081 1,963 1,048 1,311 2,002 1,772 2,227 1,581 O-profit 287 1,223 1,059 856 464 -86 64 342 317 645 196 N-income 225 954 869 683 370 -63 49 249 218 472 151 O-rate 11.8 19.4 16.3 15.8 23.6 -8.2 4.9 17.1 17.9 28.9 9.3 N-rate 9.2 15.1 13.4 12.6 18.8 -6.0 3.7 12.4 12.3 21.2 7.3 ROE 10.3 30.4 23.5 21.4 39.4 16.3 19.8 23.4 22.5 24.5 24.7 Debt-ratio 28.2 30.7 38.8 32.5 35.8 38.8 56.7 34.5 37.2 40.1 41.4 Quick-ratio 147.9 208.8 110.2 155.7 157.0 110.2 70.1 71.4 59.7 52.5 102.2 reserve-ratio 963.6 1,423.3 1,694.2 1,360.4 1,724.3 1,694.2 2,114.3 2,214.7 2,549.5 2,977.4 1,936.9 EPS 458 1,944 1,770 1,391 754 -128 100 507 484 1,011 308 BPS 4,460 6,387 7,522 6,123 7,650 7,522 10,714 11,218 13,030 15,134 9,276 Dividends 0 200 220 140 2019-10-03 Major Financial Information Recent Annual Performance Recent quarterly performance Estimate Average Gap (Indication / stock) Color High price ~ 92 % High mid ~ 67 % Mid ~ 41 % Low mid ~ 15 % Low price ~ -10 % Indication price Range Current stock price Company score 48,012 W 48,012 W 40,625 W 40,625 W 40,625 W 33,237 W Evaluation 55,400 W 55,400 W~ 48,012 W 28,800 W 56.533,237 W 33,237 W 25,850 W Low mid Normal 25,850 W 25,850 W 0 W Industrial name of the company The number of All industries Algorithm Industry ranking Total number of listed companies Algorithm company ranking Investment opinion Semiconductor and semiconductor equipment 81 16 3,009 45 25,850원 33,237원 40,625원 48,012원 55,400원 Low mid 28,800원 -10% 15.4% 41.1% 66.7% 92.4% -20% 0.% 20.% 40.% 60.% 80.% 100.% 0W 10,000W 20,000W 30,000W 40,000W 50,000W 60,000W Low price Low mid Mid High mid High price Indication price chart (Consolidated) Indication price wonik ips Gap wonik ips
- 2. [Price for scheduled purchasing] Arbitrarily made Algorithm stocks Trading Strategies (consolidated) 240810 Date Period Gap (Indication / stock) Color 2019-10-03 3 months Current stock price Evaluation Stock price rise probability score Investment opinion Prospective purchase amount 28,800 W Low mid 56.0 Normal 9,000,000 W Suggested Purchase Amount 4,653,101 W Number of stocks purchased 162 Indication price Range Buying / Selling Buying / Selling [Stocks] High price 55,400 W 55,400 W~ ~ 48,012 W 92 % -4,297,618 W -78 High mid 48,012 W 48,012 W ~ 40,625 W 67 % -3,104,049 W -65 Mid 40,625 W 40,625 W ~ 33,237 W 41 % -1,910,481 W -47 Low mid 33,237 W 33,237 W ~ 25,850 W 15 % -716,912 W -22 low price 25,850 W 25,850 W ~ 0 W -10 % 476,657 W 18 Stock price rise probability score A Sector 49.4 41.6 48.7 48.7 48.9 49.1 56.0B Sector 24.6 53.8 28.3 48.7 30.4 41.3 Total average 2019.05.09 2019.06.07 2019.07.05 2019.08.02 2019.09.02 2019.10.02 37.0 47.7 38.5 30.4 39.7 45.2 23 % 12 % 2019.06.07 2019.07.05 2019.08.02 2019.09.02 2019.10.02 Total of increase rate Total score A Sector -19 % 15 % 0 % 1 % 0 % 2 % 49.7B Sector 54 % -90 % 42 % -60 % 26 % Total average 22 % -24 % -27 % 49 42 49 49 49 49 25 54 28 49 30 41 37 48 39 30 40 45 0 10 20 30 40 50 60 2019.05.09 2019.06.07 2019.07.05 2019.08.02 2019.09.02 2019.10.02 Stock price rise probability score A sector B sector Total average -19% 15% 0% 1% 0% 54% -90% 42% -60% 26%22% -24% -27% 23% 12% -100% -80% -60% -40% -20% 0% 20% 40% 60% 80% 2019.06.07 2019.07.05 2019.08.02 2019.09.02 2019.10.02 Increase rate of stock price rise A sector B sector Total average wonik ips
- 3. 정보와 완전 정보 결 투자판단 있습니 위배 무단으 숙지하 Compliance notice ① The information provided by The Algorithm Company Analysis Consulting is obtained through reliable data and information and The Algorithm Company Analysis Program (TACAP), but its accuracy or completeness are not guaranteed. Furthermore, it may change over time.Therefore, we are not legally responsible for the results of the data provided by The Algorithm Company Analysis Consulting because of information errors or omissions. ② The Algorithm Company Analysis Consulting and all the information provided on it site are reference materials for investment decisions and the final responsibility of investment is up to users utilizing this information. ③ The Algorithm Company Analysis Consulting and its site do not do anything that violates the related laws such as discretionary transaction. ④ Users can not reallocate and recycle the information provided by The Algorithm Company Analysis Consulting firm let alone the information provided by its Site. ⑤ Be sure to know about application period of this algorithm analysis report in order to improve its accuracy. Tel : 070 - 4667 - 5009 Email : tacac@tacac.co.kr Homepage : tacac.co.kr Blog : tacac.blog.me SERVICES M&A, IPO, RECOVER, CORPORATE RESTRUCTURING, MANAGEMENT OF TECHNOLOGY, BUSINESS STRATEGY, FAMILY BUSINESS Request : http://tacac.co.kr/?page_id=1374 ① Consulting The Algori accuracy o change ove results of Consulting ② informatio investmen up ③ do anythin transaction ④ The Algori informatio ⑤ analysis re