Algorithm Performance and Stock Analysis
•
0 likes•111 views

The document contains performance data and analysis for Algorithm company from 2017-2021. It provides quarterly sales, profit, debt, and stock price data. It also includes the company's industry ranking and analysis of the stock's predicted price changes over the next 3 months. The analysis assigns the stock a "high mid" rating, suggesting a normal investment opinion and providing calculations for suggested purchase amounts.
![[Price for scheduled purchasing]
Arbitrarily made
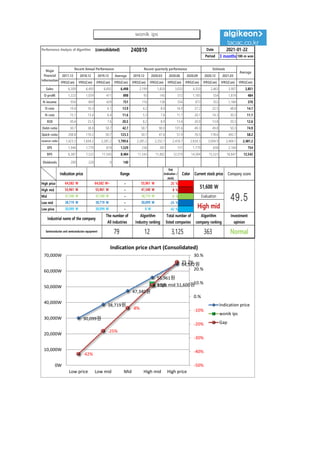
Algorithm stocks Trading Strategies (consolidated) 240810 Date
Period
Gap
(Indication /
stock)
Color
2021-01-22
3 months
Current stock price Evaluation
Stock price rise
probability score
Investment opinion Prospective purchase amount
51,600 W High mid 43.5 Normal 4,000,000 W
Suggested Purchase
Amount 1,427,092 W
Number of stocks
purchased 28
Indication price Range Buying / Selling Buying / Selling [Stocks]
High price 64,582 W 64,582 W~ ~ 55,961 W 25 % -359,031 W -6
High mid 55,961 W 55,961 W ~ 47,340 W 8 % -120,609 W -2
Mid 47,340 W 47,340 W ~ 38,719 W -8 % 117,814 W 2
Low mid 38,719 W 38,719 W ~ 30,099 W -25 % 356,236 W 9
low price 30,099 W 30,099 W ~ 0 W -42 % 594,659 W 20
Stock price rise
probability score
A Sector 46.8 53.2 41.1 51.8 44.5 47.9
43.5
B Sector 37.1 30.8 40.0 51.8 43.3 30.8
Total average
2020.08.25 2020.09.22 2020.10.26 2020.11.23 2020.12.21 2021.01.21
41.9 42.0 40.5 44.2 43.9 39.4
-1 % -12 %
2020.09.22 2020.10.26 2020.11.23 2020.12.21 2021.01.21
Total of
increase rate
Total score
A Sector 12 % -29 % 21 % -16 % 7 %
-1 % 44.7
B Sector -20 % 23 % 23 % -19 % -41 %
Total average 0 % -4 % 8 %
47
53
41
52
44
48
37
31
40
52
43
31
42 42 41
44 44
39
0
10
20
30
40
50
60
2020.08.25 2020.09.22 2020.10.26 2020.11.23 2020.12.21 2021.01.21
Stock price rise probability score
A sector
B sector
Total average
12%
-29%
21%
-16%
7%
-20%
23% 23%
-19%
-41%
0%
-4%
8%
-1%
-12%
-50%
-40%
-30%
-20%
-10%
0%
10%
20%
30%
2020.09.22 2020.10.26 2020.11.23 2020.12.21 2021.01.21
Increase rate of stock price rise
A sector
B sector
Total average
wonik ips](data:image/gif;base64,R0lGODlhAQABAIAAAAAAAP///yH5BAEAAAAALAAAAAABAAEAAAIBRAA7)
Recommended
Recommended
More Related Content
What's hot
What's hot (20)
Similar to Algorithm Performance and Stock Analysis
Similar to Algorithm Performance and Stock Analysis (20)
More from 알고리즘 기업분석 컨설팅-알기컨,algikeon
More from 알고리즘 기업분석 컨설팅-알기컨,algikeon (20)
Recently uploaded
Recently uploaded (20)
Algorithm Performance and Stock Analysis
- 1. Performance Analysis of Algorithm (consolidated) 240810 Date Period 3 months 100-m won 2017.12 2018.12 2019.12 Average 2019.12 2020.03 2020.06 2020.09 2020.12 2021.03 IFRS(Con) IFRS(Con) IFRS(Con) IFRS(Con) IFRS(Con) IFRS(Con) IFRS(Con) IFRS(Con) IFRS(Con) IFRS(Con) IFRS(Con) Sales 6,309 6,493 6,692 6,498 2,199 1,820 3,033 4,350 2,463 3,907 2,851 O-profit 1,223 1,059 411 898 93 145 512 1,185 554 1,874 484 N-income 954 869 429 751 116 138 354 873 353 1,184 370 O-rate 19.4 16.3 6.1 13.9 4.2 8.0 16.9 27.2 22.5 48.0 14.1 N-rate 15.1 13.4 6.4 11.6 5.3 7.6 11.7 20.1 14.3 30.3 11.1 ROE 30.4 23.5 7.6 20.5 8.2 8.9 13.4 20.0 13.8 20.3 12.6 Debt-ratio 30.7 38.8 58.7 42.7 58.7 90.0 101.6 49.3 49.8 50.3 74.9 Quick-ratio 208.8 110.2 50.7 123.3 50.7 47.6 57.9 76.5 178.6 492.7 58.2 reserve-ratio 1,423.3 1,694.2 2,281.2 1,799.6 2,281.2 2,332.7 2,476.7 2,834.3 3,094.9 3,404.1 2,481.2 EPS 1,944 1,770 874 1,529 236 281 721 1,779 658 2,104 754 BPS 6,387 7,522 11,543 8,484 11,543 11,802 12,519 14,304 15,523 16,847 12,542 Dividends 200 220 0 140 2021-01-22 Major Financial Information Recent Annual Performance Recent quarterly performance Estimate Average Gap (Indication / stock) Color High price ~ 25 % High mid ~ 8 % Mid ~ -8 % Low mid ~ -25 % Low price ~ -42 % Indication price Range Current stock price Company score 55,961 W 55,961 W 47,340 W 47,340 W 47,340 W 38,719 W Evaluation 64,582 W 64,582 W~ 55,961 W 51,600 W 49.5 38,719 W 38,719 W 30,099 W High mid Normal 30,099 W 30,099 W 0 W Industrial name of the company The number of All industries Algorithm Industry ranking Total number of listed companies Algorithm company ranking Investment opinion Semiconductor and semiconductor equipment 79 12 3,125 363 30,099원 38,719원 47,340원 55,961원 64,582원 High mid 51,600원 -42% -25% -8% 8.5% 25.2% -50% -40% -30% -20% -10% 0.% 10.% 20.% 30.% 0W 10,000W 20,000W 30,000W 40,000W 50,000W 60,000W 70,000W Low price Low mid Mid High mid High price Indication price chart (Consolidated) Indication price wonik ips Gap wonik ips
- 2. [Price for scheduled purchasing] Arbitrarily made Algorithm stocks Trading Strategies (consolidated) 240810 Date Period Gap (Indication / stock) Color 2021-01-22 3 months Current stock price Evaluation Stock price rise probability score Investment opinion Prospective purchase amount 51,600 W High mid 43.5 Normal 4,000,000 W Suggested Purchase Amount 1,427,092 W Number of stocks purchased 28 Indication price Range Buying / Selling Buying / Selling [Stocks] High price 64,582 W 64,582 W~ ~ 55,961 W 25 % -359,031 W -6 High mid 55,961 W 55,961 W ~ 47,340 W 8 % -120,609 W -2 Mid 47,340 W 47,340 W ~ 38,719 W -8 % 117,814 W 2 Low mid 38,719 W 38,719 W ~ 30,099 W -25 % 356,236 W 9 low price 30,099 W 30,099 W ~ 0 W -42 % 594,659 W 20 Stock price rise probability score A Sector 46.8 53.2 41.1 51.8 44.5 47.9 43.5 B Sector 37.1 30.8 40.0 51.8 43.3 30.8 Total average 2020.08.25 2020.09.22 2020.10.26 2020.11.23 2020.12.21 2021.01.21 41.9 42.0 40.5 44.2 43.9 39.4 -1 % -12 % 2020.09.22 2020.10.26 2020.11.23 2020.12.21 2021.01.21 Total of increase rate Total score A Sector 12 % -29 % 21 % -16 % 7 % -1 % 44.7 B Sector -20 % 23 % 23 % -19 % -41 % Total average 0 % -4 % 8 % 47 53 41 52 44 48 37 31 40 52 43 31 42 42 41 44 44 39 0 10 20 30 40 50 60 2020.08.25 2020.09.22 2020.10.26 2020.11.23 2020.12.21 2021.01.21 Stock price rise probability score A sector B sector Total average 12% -29% 21% -16% 7% -20% 23% 23% -19% -41% 0% -4% 8% -1% -12% -50% -40% -30% -20% -10% 0% 10% 20% 30% 2020.09.22 2020.10.26 2020.11.23 2020.12.21 2021.01.21 Increase rate of stock price rise A sector B sector Total average wonik ips
- 3. 정보와 완전 정보 결 투자판단 있습니 위배 무단으 숙지하 Compliance notice ① The information provided by The Algorithm Company Analysis Consulting is obtained through reliable data and information and The Algorithm Company Analysis Program (TACAP), but its accuracy or completeness are not guaranteed. Furthermore, it may change over time.Therefore, we are not legally responsible for the results of the data provided by The Algorithm Company Analysis Consulting because of information errors or omissions. ② The Algorithm Company Analysis Consulting and all the information provided on it site are reference materials for investment decisions and the final responsibility of investment is up to users utilizing this information. ③ The Algorithm Company Analysis Consulting and its site do not do anything that violates the related laws such as discretionary transaction. ④ Users can not reallocate and recycle the information provided by The Algorithm Company Analysis Consulting firm let alone the information provided by its Site. ⑤ Be sure to know about application period of this algorithm analysis report in order to improve its accuracy. Tel : 070 - 4667 - 5009 Email : tacac@tacac.co.kr Homepage : tacac.co.kr Blog : tacac.blog.me SERVICES M&A, IPO, RECOVER, CORPORATE RESTRUCTURING, MANAGEMENT OF TECHNOLOGY, BUSINESS STRATEGY, FAMILY BUSINESS Request : http://tacac.co.kr/?page_id=1374 ① Consulting is o The Algorithm accuracy or com change over tim results of the d Consulting bec ② information pr investment dec up ③ do anything th transaction. ④ The Algorithm information pr ⑤ analysis report