posco international 047050 Algorithm Investment Report.pdf
•
0 likes•10 views

This document provides a performance analysis of an algorithm (consolidated) over a 3 month period from 2020-2023. It includes key financial metrics such as sales, operating profit, net income, operating rate, net rate, ROE, debt ratio, quick ratio, and reserve ratio on an annual and quarterly basis. It also provides the company's stock price, EPS, BPS, dividends, and compares the indication price to the current stock price. Additional sections analyze stock price rise probability scores by sector over time and provide a suggested purchase amount and number of stocks based on the indication price range.
![[Price for scheduled purchasing]
Arbitrarily made
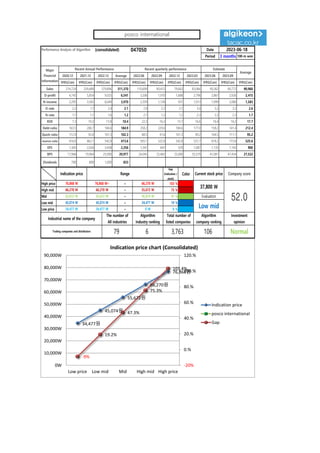
Algorithm stocks Trading Strategies (consolidated) 047050 Date
Period
Gap
(Indication /
stock)
Color
low price 34,477 W 34,477 W ~ 0 W -9 % 395,964 W 11
Low mid 45,074 W 45,074 W ~ 34,477 W 19 % -866,706 W -19
Mid 55,672 W 55,672 W ~ 45,074 W 47 % -2,129,375 W -38
High mid 66,270 W 66,270 W ~ 55,672 W 75 % -3,392,044 W -51
Suggested Purchase
Amount 4,503,682 W
Number of stocks
purchased 119
Indication price Range Buying / Selling Buying / Selling [Stocks]
High price 76,868 W 76,868 W~ ~ 66,270 W 103 % -4,654,713 W All selling
2023-06-18
3 months
Current stock price Evaluation
Stock price rise
probability score
Investment opinion Prospective purchase amount
37,800 W Low mid 39.2 Normal 10,000,000 W
39.4 41.6 41.3 28.8 39.7 39.5
2023.01.18 2023.02.17 2023.03.20 2023.04.17 2023.05.17 2023.06.16
Stock price rise
probability score
A Sector 41.8 47.4 46.8 45.5 51.1 50.2
39.2
B Sector 37.1 35.8 35.8 45.5 28.3 28.8
Total average
2023.03.20 2023.04.17 2023.05.17 2023.06.16
Total of
increase rate
Total score
A Sector 12 % -1 % -3 % 11 % -2 %
-2 % 47.0
B Sector -3 % 0 % 21 % -61 % 1 %
Total average 5 % -1 % -44 % 28 % -1 %
2023.02.17
42
47 47 46
51 50
37 36 36
46
28 29
39 42 41
29
40 39
0
10
20
30
40
50
60
2023.01.18 2023.02.17 2023.03.20 2023.04.17 2023.05.17 2023.06.16
Stock price rise probability score
A sector
B sector
Total average
12%
-1% -3%
11%
-2%
-3% 0%
21%
-61%
1%
5%
-1%
-44%
28%
-1%
-80%
-60%
-40%
-20%
0%
20%
40%
2023.02.17 2023.03.20 2023.04.17 2023.05.17 2023.06.16
Increase rate of stock price rise
A sector
B sector
Total average
posco international](data:image/gif;base64,R0lGODlhAQABAIAAAAAAAP///yH5BAEAAAAALAAAAAABAAEAAAIBRAA7)
Recommended
Recommended
More Related Content
Similar to posco international 047050 Algorithm Investment Report.pdf
Similar to posco international 047050 Algorithm Investment Report.pdf (20)
More from 알고리즘 기업분석 컨설팅-알기컨,algikeon
More from 알고리즘 기업분석 컨설팅-알기컨,algikeon (20)
Recently uploaded
Recently uploaded (8)
posco international 047050 Algorithm Investment Report.pdf
- 1. Performance Analysis of Algorithm (consolidated) 047050 Date Period 3 months 100-m won 2020.12 2021.12 2022.12 Average 2022.06 2022.09 2022.12 2023.03 2023.06 2023.09 IFRS(Con) IFRS(Con) IFRS(Con) IFRS(Con) IFRS(Con) IFRS(Con) IFRS(Con) IFRS(Con) IFRS(Con) IFRS(Con) IFRS(Con) Sales 214,724 339,489 379,896 311,370 110,699 90,412 79,663 83,066 90,362 90,772 90,960 O-profit 4,745 5,854 9,025 6,541 3,206 1,970 1,688 2,796 2,867 2,926 2,415 N-income 2,295 3,565 6,049 3,970 2,359 1,128 931 1,913 1,999 2,080 1,583 O-rate 2.2 1.7 2.4 2.1 2.9 2.2 2.1 3.4 3.2 3.2 2.6 N-rate 1.1 1.1 1.6 1.2 2.1 1.2 1.2 2.3 2.2 2.3 1.7 ROE 7.3 10.2 13.8 10.4 22.3 16.2 15.7 16.6 16.4 16.2 17.7 Debt-ratio 163.5 206.7 184.6 184.9 258.2 229.6 184.6 177.0 158.2 141.4 212.4 Quick-ratio 112.9 92.6 101.3 102.3 88.5 91.6 101.3 99.2 104.5 111.1 95.2 reserve-ratio 416.0 462.1 542.8 473.6 505.1 522.8 542.8 531.7 618.2 773.8 525.6 EPS 1,305 2,026 3,438 2,256 1,341 641 529 1,087 1,135 1,143 900 BPS 17,968 19,964 25,000 20,977 24,045 25,465 25,000 35,579 41,081 47,434 27,522 Dividends 700 800 1,000 833 Major Financial Information Recent Annual Performance Recent quarterly performance Estimate Average 2023-06-18 Gap (Indication / stock) Color High price ~ 103 % High mid ~ 75 % Mid ~ 47 % Low mid ~ 19 % Low price ~ -9 % Normal 34,477 W 34,477 W 0 W Industrial name of the company The number of All industries Algorithm Industry ranking Total number of listed companies Algorithm company ranking Investment opinion Trading companies and distributors 79 6 3,763 106 66,270 W 66,270 W 55,672 W 55,672 W 55,672 W 45,074 W Evaluation 76,868 W 76,868 W~ 66,270 W 37,800 W 52.0 45,074 W 45,074 W 34,477 W Low mid Indication price Range Current stock price Company score 34,477원 45,074원 55,672원 66,270원 76,868원 -9% 19.2% 47.3% 75.3% 103.4% -20% 0.% 20.% 40.% 60.% 80.% 100.% 120.% 0W 10,000W 20,000W 30,000W 40,000W 50,000W 60,000W 70,000W 80,000W 90,000W Low price Low mid Mid High mid High price Indication price chart (Consolidated) Indication price posco international Gap posco international
- 2. [Price for scheduled purchasing] Arbitrarily made Algorithm stocks Trading Strategies (consolidated) 047050 Date Period Gap (Indication / stock) Color low price 34,477 W 34,477 W ~ 0 W -9 % 395,964 W 11 Low mid 45,074 W 45,074 W ~ 34,477 W 19 % -866,706 W -19 Mid 55,672 W 55,672 W ~ 45,074 W 47 % -2,129,375 W -38 High mid 66,270 W 66,270 W ~ 55,672 W 75 % -3,392,044 W -51 Suggested Purchase Amount 4,503,682 W Number of stocks purchased 119 Indication price Range Buying / Selling Buying / Selling [Stocks] High price 76,868 W 76,868 W~ ~ 66,270 W 103 % -4,654,713 W All selling 2023-06-18 3 months Current stock price Evaluation Stock price rise probability score Investment opinion Prospective purchase amount 37,800 W Low mid 39.2 Normal 10,000,000 W 39.4 41.6 41.3 28.8 39.7 39.5 2023.01.18 2023.02.17 2023.03.20 2023.04.17 2023.05.17 2023.06.16 Stock price rise probability score A Sector 41.8 47.4 46.8 45.5 51.1 50.2 39.2 B Sector 37.1 35.8 35.8 45.5 28.3 28.8 Total average 2023.03.20 2023.04.17 2023.05.17 2023.06.16 Total of increase rate Total score A Sector 12 % -1 % -3 % 11 % -2 % -2 % 47.0 B Sector -3 % 0 % 21 % -61 % 1 % Total average 5 % -1 % -44 % 28 % -1 % 2023.02.17 42 47 47 46 51 50 37 36 36 46 28 29 39 42 41 29 40 39 0 10 20 30 40 50 60 2023.01.18 2023.02.17 2023.03.20 2023.04.17 2023.05.17 2023.06.16 Stock price rise probability score A sector B sector Total average 12% -1% -3% 11% -2% -3% 0% 21% -61% 1% 5% -1% -44% 28% -1% -80% -60% -40% -20% 0% 20% 40% 2023.02.17 2023.03.20 2023.04.17 2023.05.17 2023.06.16 Increase rate of stock price rise A sector B sector Total average posco international
- 3. 정보와 완전 정보 결 투자판단 있습니 위배 무단으 숙지하 Compliance notice ① The information provided by The Algorithm Company Analysis Consulting is obtained through reliable data and information and The Algorithm Company Analysis Program (TACAP), but its accuracy or completeness are not guaranteed. Furthermore, it may change over time.Therefore, we are not legally responsible for the results of the data provided by The Algorithm Company Analysis Consulting because of information errors or omissions. ② The Algorithm Company Analysis Consulting and all the information provided on it site are reference materials for investment decisions and the final responsibility of investment is up to users utilizing this information. ③ The Algorithm Company Analysis Consulting and its site do not do anything that violates the related laws such as discretionary transaction. ④ Users can not reallocate and recycle the information provided by The Algorithm Company Analysis Consulting firm let alone the information provided by its Site. ⑤ Be sure to know about application period of this algorithm analysis report in order to improve its accuracy. Tel : 070 - 4667 - 5009 Email : tacac@tacac.co.kr Homepage : tacac.co.kr Blog : tacac.blog.me SERVICES M&A, IPO, RECOVER, CORPORATE RESTRUCTURING, MANAGEMENT OF TECHNOLOGY, BUSINESS STRATEGY, FAMILY BUSINESS Request : http://tacac.co.kr/?page_id=1374 ① Consulting is o The Algorithm accuracy or com change over tim results of the d Consulting bec ② information pr investment dec up ③ do anything th transaction. ④ The Algorithm information pr ⑤ analysis report