kakao 035720 Algorithm Investment Report
•
1 like•28 views

kakao 035720 Algorithm Investment Report
![[Price for scheduled purchasing]
Arbitrarily made
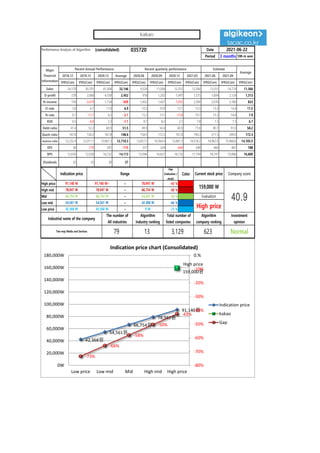
Algorithm stocks Trading Strategies (consolidated) 035720 Date
Period
Gap
(Indication /
stock)
Color
2021-06-22
3 months
Current stock price Evaluation
Stock price rise
probability score
Investment opinion Prospective purchase amount
159,000 W High price 29.1 Normal 3,500,000 W
Suggested Purchase
Amount 1,050,646 W
Number of stocks
purchased 7
Indication price Range Buying / Selling Buying / Selling [Stocks]
High price 91,140 W 91,140 W~ ~ 78,947 W -43 % 448,409 W 5
High mid 78,947 W 78,947 W ~ 66,754 W -50 % 528,979 W 7
Mid 66,754 W 66,754 W ~ 54,561 W -58 % 609,549 W 9
Low mid 54,561 W 54,561 W ~ 42,368 W -66 % 690,119 W 13
low price 42,368 W 42,368 W ~ 0 W -73 % 770,688 W 18
Stock price rise
probability score
A Sector 46.9 52.6 50.1 46.6 43.4 42.4
29.1
B Sector 48.3 35.0 21.3 46.6 49.6 37.5
Total average
2021.01.25 2021.02.24 2021.03.25 2021.04.22 2021.05.24 2021.06.21
47.6 43.8 35.7 39.6 46.5 39.9
15 % -16 %
2021.02.24 2021.03.25 2021.04.22 2021.05.24 2021.06.21
Total of
increase rate
Total score
A Sector 11 % -5 % -8 % -7 % -2 %
-5 % 41.0
B Sector -38 % -65 % 54 % 6 % -32 %
Total average -9 % -23 % 10 %
47
53 50
47
43 42
48
35
21
47
50
38
48
44
36
40
47
40
0
10
20
30
40
50
60
2021.01.25 2021.02.24 2021.03.25 2021.04.22 2021.05.24 2021.06.21
Stock price rise probability score
A sector
B sector
Total average
11%
-5% -8% -7% -2%
-38%
-65%
54%
6%
-32%
-9%
-23%
10% 15%
-16%
-80%
-60%
-40%
-20%
0%
20%
40%
60%
80%
2021.02.24 2021.03.25 2021.04.22 2021.05.24 2021.06.21
Increase rate of stock price rise
A sector
B sector
Total average
kakao](data:image/gif;base64,R0lGODlhAQABAIAAAAAAAP///yH5BAEAAAAALAAAAAABAAEAAAIBRAA7)
Recommended
Recommended
More Related Content
What's hot
What's hot (20)
Similar to kakao 035720 Algorithm Investment Report
Similar to kakao 035720 Algorithm Investment Report (19)
More from 알고리즘 기업분석 컨설팅-알기컨,algikeon
More from 알고리즘 기업분석 컨설팅-알기컨,algikeon (20)
Recently uploaded
Recently uploaded (20)
kakao 035720 Algorithm Investment Report
- 1. Performance Analysis of Algorithm (consolidated) 035720 Date Period 3 months 100-m won 2018.12 2019.12 2020.12 Average 2020.06 2020.09 2020.12 2021.03 2021.06 2021.09 IFRS(Con) IFRS(Con) IFRS(Con) IFRS(Con) IFRS(Con) IFRS(Con) IFRS(Con) IFRS(Con) IFRS(Con) IFRS(Con) IFRS(Con) Sales 24,170 30,701 41,568 32,146 9,529 11,004 12,351 12,580 13,551 14,774 11,366 O-profit 729 2,068 4,559 2,452 978 1,202 1,497 1,575 1,804 2,124 1,313 N-income 159 -3,419 1,734 -509 1,452 1,437 -1,955 2,399 2,070 2,180 833 O-rate 3.0 6.7 11.0 6.9 10.3 10.9 12.1 12.5 13.3 14.4 11.5 N-rate 0.7 -11.1 4.2 -2.1 15.2 13.1 -15.8 19.1 15.3 14.8 7.9 ROE 0.3 -6.0 2.3 -1.1 8.7 8.2 2.1 7.8 7.3 7.3 6.7 Debt-ratio 41.4 52.2 60.9 51.5 49.9 50.4 60.9 71.6 80.7 91.0 58.2 Quick-ratio 147.8 130.2 167.8 148.6 158.5 172.5 167.8 190.3 217.3 249.9 172.3 reserve-ratio 12,232.4 12,017.1 13,881.3 12,710.3 13,657.5 14,364.9 13,881.3 14,518.2 14,962.0 15,468.6 14,105.5 EPS 36 -770 391 -115 327 324 -440 540 464 467 188 BPS 12,676 12,930 16,732 14,113 15,096 16,827 16,732 17,744 18,747 19,806 16,600 Dividends 25 25 30 27 2021-06-22 Major Financial Information Recent Annual Performance Recent quarterly performance Estimate Average Gap (Indication / stock) Color High price ~ -43 % High mid ~ -50 % Mid ~ -58 % Low mid ~ -66 % Low price ~ -73 % Indication price Range Current stock price Company score 78,947 W 78,947 W 66,754 W 66,754 W 66,754 W 54,561 W Evaluation 91,140 W 91,140 W~ 78,947 W 159,000 W 40.9 54,561 W 54,561 W 42,368 W High price Normal 42,368 W 42,368 W 0 W Industrial name of the company The number of All industries Algorithm Industry ranking Total number of listed companies Algorithm company ranking Investment opinion Two-way Media and Services 79 13 3,129 623 42,368원 54,561원 66,754원 78,947원 91,140원 High price 159,000원 -73% -66% -58% -50% -43% -80% -70% -60% -50% -40% -30% -20% -10% 0.% 0W 20,000W 40,000W 60,000W 80,000W 100,000W 120,000W 140,000W 160,000W 180,000W Low price Low mid Mid High mid High price Indication price chart (Consolidated) Indication price kakao Gap kakao
- 2. [Price for scheduled purchasing] Arbitrarily made Algorithm stocks Trading Strategies (consolidated) 035720 Date Period Gap (Indication / stock) Color 2021-06-22 3 months Current stock price Evaluation Stock price rise probability score Investment opinion Prospective purchase amount 159,000 W High price 29.1 Normal 3,500,000 W Suggested Purchase Amount 1,050,646 W Number of stocks purchased 7 Indication price Range Buying / Selling Buying / Selling [Stocks] High price 91,140 W 91,140 W~ ~ 78,947 W -43 % 448,409 W 5 High mid 78,947 W 78,947 W ~ 66,754 W -50 % 528,979 W 7 Mid 66,754 W 66,754 W ~ 54,561 W -58 % 609,549 W 9 Low mid 54,561 W 54,561 W ~ 42,368 W -66 % 690,119 W 13 low price 42,368 W 42,368 W ~ 0 W -73 % 770,688 W 18 Stock price rise probability score A Sector 46.9 52.6 50.1 46.6 43.4 42.4 29.1 B Sector 48.3 35.0 21.3 46.6 49.6 37.5 Total average 2021.01.25 2021.02.24 2021.03.25 2021.04.22 2021.05.24 2021.06.21 47.6 43.8 35.7 39.6 46.5 39.9 15 % -16 % 2021.02.24 2021.03.25 2021.04.22 2021.05.24 2021.06.21 Total of increase rate Total score A Sector 11 % -5 % -8 % -7 % -2 % -5 % 41.0 B Sector -38 % -65 % 54 % 6 % -32 % Total average -9 % -23 % 10 % 47 53 50 47 43 42 48 35 21 47 50 38 48 44 36 40 47 40 0 10 20 30 40 50 60 2021.01.25 2021.02.24 2021.03.25 2021.04.22 2021.05.24 2021.06.21 Stock price rise probability score A sector B sector Total average 11% -5% -8% -7% -2% -38% -65% 54% 6% -32% -9% -23% 10% 15% -16% -80% -60% -40% -20% 0% 20% 40% 60% 80% 2021.02.24 2021.03.25 2021.04.22 2021.05.24 2021.06.21 Increase rate of stock price rise A sector B sector Total average kakao
- 3. 정보와 완전 정보 결 투자판단 있습니 위배 무단으 숙지하 Compliance notice ① The information provided by The Algorithm Company Analysis Consulting is obtained through reliable data and information and The Algorithm Company Analysis Program (TACAP), but its accuracy or completeness are not guaranteed. Furthermore, it may change over time.Therefore, we are not legally responsible for the results of the data provided by The Algorithm Company Analysis Consulting because of information errors or omissions. ② The Algorithm Company Analysis Consulting and all the information provided on it site are reference materials for investment decisions and the final responsibility of investment is up to users utilizing this information. ③ The Algorithm Company Analysis Consulting and its site do not do anything that violates the related laws such as discretionary transaction. ④ Users can not reallocate and recycle the information provided by The Algorithm Company Analysis Consulting firm let alone the information provided by its Site. ⑤ Be sure to know about application period of this algorithm analysis report in order to improve its accuracy. Tel : 070 - 4667 - 5009 Email : tacac@tacac.co.kr Homepage : tacac.co.kr Blog : tacac.blog.me SERVICES M&A, IPO, RECOVER, CORPORATE RESTRUCTURING, MANAGEMENT OF TECHNOLOGY, BUSINESS STRATEGY, FAMILY BUSINESS Request : http://tacac.co.kr/?page_id=1374 ① Consulting is o The Algorithm accuracy or com change over tim results of the d Consulting bec ② information pr investment dec up ③ do anything th transaction. ④ The Algorithm information pr ⑤ analysis report