rorze systems 071280 Algorithm Investment Report
•
1 like•210 views

This document provides a performance analysis of an algorithm (consolidated) over several time periods. It includes sales, operating profit, net income, operating rate, net rate, debt ratio, quick ratio, and other financial metrics from 2018-2022. It also shows the algorithm's industry ranking and compares its current stock price to indication price ranges. Charts display the indication price and probability of stock price increases over time. The document evaluates purchasing the stock and provides a compliance notice.
![[Price for scheduled purchasing]
Arbitrarily made
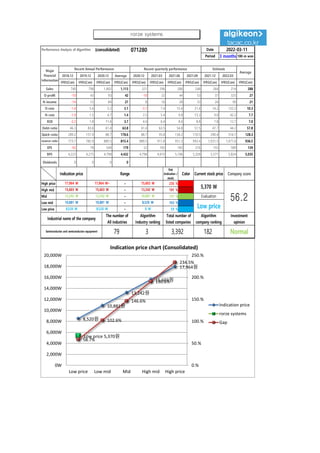
Algorithm stocks Trading Strategies (consolidated) 071280 Date
Period
Gap
(Indication /
stock)
Color
low price 8,520 W 8,520 W ~ 0 W 59 % -3,316,278 W -389
Low mid 10,881 W 10,881 W ~ 8,520 W 103 % -5,801,364 W All selling
Mid 13,242 W 13,242 W ~ 10,881 W 147 % -8,286,451 W All selling
High mid 15,603 W 15,603 W ~ 13,242 W 191 % -10,771,537 W All selling
Suggested Purchase
Amount 5,652,709 W
Number of stocks
purchased 1,053
Indication price Range Buying / Selling Buying / Selling [Stocks]
High price 17,964 W 17,964 W~ ~ 15,603 W 235 % -13,256,624 W All selling
2022-03-11
3 months
Current stock price Evaluation
Stock price rise
probability score
Investment opinion Prospective purchase amount
5,370 W Low price 60.4 Normal 10,000,000 W
36.1 28.7 42.0 37.5 34.5 34.5
2021.10.13 2021.11.10 2021.12.08 2022.01.06 2022.02.08 2022.02.08
Stock price rise
probability score
A Sector 52.7 42.4 46.6 48.6 48.7 48.7
60.4
B Sector 19.6 15.0 37.5 48.6 20.4 20.4
Total average
2021.12.08 2022.01.06 2022.02.08 2022.02.08
Total of
increase rate
Total score
A Sector -24 % 9 % 4 % 0 % 0 %
-3 % 45.3
B Sector -31 % 60 % 23 % -138 % 0 %
Total average -26 % 32 % -12 % -9 % 0 %
2021.11.10
53
42
47 49 49 49
20
15
38
49
20 20
36
29
42
38
35 35
0
10
20
30
40
50
60
2021.10.13 2021.11.10 2021.12.08 2022.01.06 2022.02.08 2022.02.08
Stock price rise probability score
A sector
B sector
Total average
-24%
9% 4% 0% 0%
-31%
60%
23%
-138%
0%
-26%
32%
-12% -9% 0%
-150%
-100%
-50%
0%
50%
100%
2021.11.10 2021.12.08 2022.01.06 2022.02.08 2022.02.08
Increase rate of stock price rise
A sector
B sector
Total average
rorze systems](data:image/gif;base64,R0lGODlhAQABAIAAAAAAAP///yH5BAEAAAAALAAAAAABAAEAAAIBRAA7)
Recommended
Recommended
More Related Content
What's hot
What's hot (20)
Similar to rorze systems 071280 Algorithm Investment Report
Similar to rorze systems 071280 Algorithm Investment Report (20)
More from 알고리즘 기업분석 컨설팅-알기컨,algikeon
More from 알고리즘 기업분석 컨설팅-알기컨,algikeon (20)
Recently uploaded
Recently uploaded (8)
rorze systems 071280 Algorithm Investment Report
- 1. Performance Analysis of Algorithm (consolidated) 071280 Date Period 3 months 100-m won 2018.12 2019.12 2020.12 Average 2020.12 2021.03 2021.06 2021.09 2021.12 2022.03 IFRS(Con) IFRS(Con) IFRS(Con) IFRS(Con) IFRS(Con) IFRS(Con) IFRS(Con) IFRS(Con) IFRS(Con) IFRS(Con) IFRS(Con) Sales 740 798 1,802 1,113 321 296 286 248 264 214 288 O-profit -10 43 93 42 -10 22 44 53 37 325 27 N-income -14 12 84 27 8 16 28 33 24 90 21 O-rate -1.4 5.4 5.2 3.1 -3.1 7.4 15.4 21.4 14.2 152.2 10.3 N-rate -1.9 1.5 4.7 1.4 2.5 5.4 9.8 13.3 9.0 42.2 7.7 ROE -2.2 1.8 11.4 3.7 4.4 6.4 8.4 8.8 7.8 12.7 7.0 Debt-ratio 46.3 83.6 61.4 63.8 61.4 63.5 54.8 51.5 47.7 44.2 57.8 Quick-ratio 289.2 157.9 88.7 178.6 88.7 95.8 158.2 170.5 290.4 516.1 128.3 reserve-ratio 773.7 782.9 889.5 815.4 889.5 911.8 951.3 993.4 1,031.5 1,071.6 936.5 EPS -92 78 549 179 52 105 183 216 155 589 139 BPS 4,223 4,275 4,798 4,432 4,798 4,910 5,106 5,328 5,571 5,824 5,035 Dividends 0 0 0 0 Major Financial Information Recent Annual Performance Recent quarterly performance Estimate Average 2022-03-11 Gap (Indication / stock) Color High price ~ 235 % High mid ~ 191 % Mid ~ 147 % Low mid ~ 103 % Low price ~ 59 % Normal 8,520 W 8,520 W 0 W Industrial name of the company The number of All industries Algorithm Industry ranking Total number of listed companies Algorithm company ranking Investment opinion Semiconductor and semiconductor equipment 79 3 3,392 182 15,603 W 15,603 W 13,242 W 13,242 W 13,242 W 10,881 W Evaluation 17,964 W 17,964 W~ 15,603 W 5,370 W 56.2 10,881 W 10,881 W 8,520 W Low price Indication price Range Current stock price Company score 8,520원 10,881원 13,242원 15,603원 17,964원 Low price 5,370원 58.7% 102.6% 146.6% 190.6% 234.5% 0.% 50.% 100.% 150.% 200.% 250.% 0W 2,000W 4,000W 6,000W 8,000W 10,000W 12,000W 14,000W 16,000W 18,000W 20,000W Low price Low mid Mid High mid High price Indication price chart (Consolidated) Indication price rorze systems Gap rorze systems
- 2. [Price for scheduled purchasing] Arbitrarily made Algorithm stocks Trading Strategies (consolidated) 071280 Date Period Gap (Indication / stock) Color low price 8,520 W 8,520 W ~ 0 W 59 % -3,316,278 W -389 Low mid 10,881 W 10,881 W ~ 8,520 W 103 % -5,801,364 W All selling Mid 13,242 W 13,242 W ~ 10,881 W 147 % -8,286,451 W All selling High mid 15,603 W 15,603 W ~ 13,242 W 191 % -10,771,537 W All selling Suggested Purchase Amount 5,652,709 W Number of stocks purchased 1,053 Indication price Range Buying / Selling Buying / Selling [Stocks] High price 17,964 W 17,964 W~ ~ 15,603 W 235 % -13,256,624 W All selling 2022-03-11 3 months Current stock price Evaluation Stock price rise probability score Investment opinion Prospective purchase amount 5,370 W Low price 60.4 Normal 10,000,000 W 36.1 28.7 42.0 37.5 34.5 34.5 2021.10.13 2021.11.10 2021.12.08 2022.01.06 2022.02.08 2022.02.08 Stock price rise probability score A Sector 52.7 42.4 46.6 48.6 48.7 48.7 60.4 B Sector 19.6 15.0 37.5 48.6 20.4 20.4 Total average 2021.12.08 2022.01.06 2022.02.08 2022.02.08 Total of increase rate Total score A Sector -24 % 9 % 4 % 0 % 0 % -3 % 45.3 B Sector -31 % 60 % 23 % -138 % 0 % Total average -26 % 32 % -12 % -9 % 0 % 2021.11.10 53 42 47 49 49 49 20 15 38 49 20 20 36 29 42 38 35 35 0 10 20 30 40 50 60 2021.10.13 2021.11.10 2021.12.08 2022.01.06 2022.02.08 2022.02.08 Stock price rise probability score A sector B sector Total average -24% 9% 4% 0% 0% -31% 60% 23% -138% 0% -26% 32% -12% -9% 0% -150% -100% -50% 0% 50% 100% 2021.11.10 2021.12.08 2022.01.06 2022.02.08 2022.02.08 Increase rate of stock price rise A sector B sector Total average rorze systems
- 3. 정보와 완전 정보 결 투자판단 있습니 위배 무단으 숙지하 Compliance notice ① The information provided by The Algorithm Company Analysis Consulting is obtained through reliable data and information and The Algorithm Company Analysis Program (TACAP), but its accuracy or completeness are not guaranteed. Furthermore, it may change over time.Therefore, we are not legally responsible for the results of the data provided by The Algorithm Company Analysis Consulting because of information errors or omissions. ② The Algorithm Company Analysis Consulting and all the information provided on it site are reference materials for investment decisions and the final responsibility of investment is up to users utilizing this information. ③ The Algorithm Company Analysis Consulting and its site do not do anything that violates the related laws such as discretionary transaction. ④ Users can not reallocate and recycle the information provided by The Algorithm Company Analysis Consulting firm let alone the information provided by its Site. ⑤ Be sure to know about application period of this algorithm analysis report in order to improve its accuracy. Tel : 070 - 4667 - 5009 Email : tacac@tacac.co.kr Homepage : tacac.co.kr Blog : tacac.blog.me SERVICES M&A, IPO, RECOVER, CORPORATE RESTRUCTURING, MANAGEMENT OF TECHNOLOGY, BUSINESS STRATEGY, FAMILY BUSINESS Request : http://tacac.co.kr/?page_id=1374 ① Consulting is o The Algorithm accuracy or com change over tim results of the d Consulting bec ② information pr investment dec up ③ do anything th transaction. ④ The Algorithm information pr ⑤ analysis report