hanmi semiconductor 042700 Algorithm Investment Report
•
1 like•124 views

This document provides a summary of financial performance and stock price analysis for a semiconductor company over several periods. It includes tables with historical sales, profit, debt and other key financial metrics. A second section shows the company's current stock price compared to different price ranges and estimates the number of shares that could be purchased within those ranges. A third section displays charts tracking the company's stock price rise probability over time and the increase rates between periods. The analysis aims to provide reference information for investment decisions in the company.
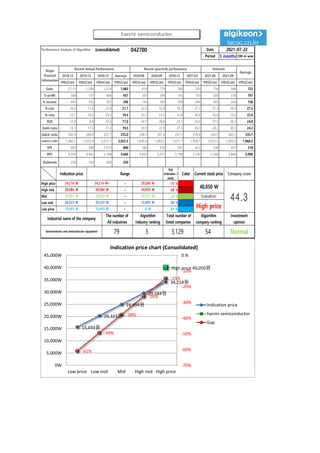
![[Price for scheduled purchasing]
Arbitrarily made
Algorithm stocks Trading Strategies (consolidated) 042700 Date
Period
Gap
(Indication /
stock)
Color
2021-07-22
3 months
Current stock price Evaluation
Stock price rise
probability score
Investment opinion Prospective purchase amount
40,050 W High price 45.3 Normal 3,500,000 W
Suggested Purchase
Amount 1,317,939 W
Number of stocks
purchased 33
Indication price Range Buying / Selling Buying / Selling [Stocks]
High price 34,214 W 34,214 W~ ~ 29,584 W -15 % 192,034 W 6
High mid 29,584 W 29,584 W ~ 24,954 W -26 % 344,410 W 12
Mid 24,954 W 24,954 W ~ 20,323 W -38 % 496,785 W 20
Low mid 20,323 W 20,323 W ~ 15,693 W -49 % 649,161 W 32
low price 15,693 W 15,693 W ~ 0 W -61 % 801,536 W 51
Stock price rise
probability score
A Sector 51.0 51.2 46.0 48.4 47.6 50.8
45.3
B Sector 28.8 35.0 37.5 48.4 26.7 26.7
Total average
2021.02.26 2021.03.29 2021.04.26 2021.05.26 2021.06.23 2021.07.21
39.9 43.1 41.7 24.6 37.1 38.7
34 % 4 %
2021.03.29 2021.04.26 2021.05.26 2021.06.23 2021.07.21
Total of
increase rate
Total score
A Sector 1 % -11 % 5 % -2 % 6 %
-6 % 48.0
B Sector 18 % 7 % 23 % -82 % 0 %
Total average 8 % -3 % -70 %
51 51
46 48 48
51
29
35 38
48
27 27
40
43 42
25
37 39
0
10
20
30
40
50
60
2021.02.26 2021.03.29 2021.04.26 2021.05.26 2021.06.23 2021.07.21
Stock price rise probability score
A sector
B sector
Total average
1%
-11%
5%
-2%
6%
18%
7%
23%
-82%
0%
8%
-3%
-70%
34%
4%
-100%
-80%
-60%
-40%
-20%
0%
20%
40%
2021.03.29 2021.04.26 2021.05.26 2021.06.23 2021.07.21
Increase rate of stock price rise
A sector
B sector
Total average
hanmi semiconductor](data:image/gif;base64,R0lGODlhAQABAIAAAAAAAP///yH5BAEAAAAALAAAAAABAAEAAAIBRAA7)
Recommended
More Related Content
What's hot
What's hot (20)
Similar to hanmi semiconductor 042700 Algorithm Investment Report
Similar to hanmi semiconductor 042700 Algorithm Investment Report (20)
More from 알고리즘 기업분석 컨설팅-알기컨,algikeon
More from 알고리즘 기업분석 컨설팅-알기컨,algikeon (20)
Recently uploaded
Recently uploaded (14)
hanmi semiconductor 042700 Algorithm Investment Report
- 1. Performance Analysis of Algorithm (consolidated) 042700 Date Period 3 months 100-m won 2018.12 2019.12 2020.12 Average 2020.06 2020.09 2020.12 2021.03 2021.06 2021.09 IFRS(Con) IFRS(Con) IFRS(Con) IFRS(Con) IFRS(Con) IFRS(Con) IFRS(Con) IFRS(Con) IFRS(Con) IFRS(Con) IFRS(Con) Sales 2,171 1,204 2,574 1,983 619 779 780 709 756 944 722 O-profit 568 137 666 457 201 249 143 193 205 278 197 N-income 493 193 501 396 143 183 100 204 265 242 158 O-rate 26.2 11.4 25.9 21.1 32.5 32.0 18.3 27.2 27.2 29.5 27.5 N-rate 22.7 16.0 19.5 19.4 23.1 23.5 12.8 28.8 35.0 25.6 22.0 ROE 22.9 8.8 19.5 17.0 24.1 26.8 22.1 26.0 27.5 26.7 24.8 Debt-ratio 14.1 17.2 27.2 19.5 20.5 22.9 27.2 26.3 28.2 30.1 24.2 Quick-ratio 242.3 284.9 237.7 255.0 238.5 247.6 237.7 218.8 243.5 283.1 235.7 reserve-ratio 1,982.7 2,022.0 2,071.7 2,025.5 1,839.4 1,983.5 2,071.7 1,978.7 2,031.5 2,085.6 1,968.3 EPS 997 390 1,013 800 289 370 202 412 536 427 318 BPS 4,359 4,442 5,198 4,666 4,802 5,012 5,198 5,342 5,588 5,846 5,088 Dividends 250 100 400 250 2021-07-22 Major Financial Information Recent Annual Performance Recent quarterly performance Estimate Average Gap (Indication / stock) Color High price ~ -15 % High mid ~ -26 % Mid ~ -38 % Low mid ~ -49 % Low price ~ -61 % Indication price Range Current stock price Company score 29,584 W 29,584 W 24,954 W 24,954 W 24,954 W 20,323 W Evaluation 34,214 W 34,214 W~ 29,584 W 40,050 W 44.3 20,323 W 20,323 W 15,693 W High price Normal 15,693 W 15,693 W 0 W Industrial name of the company The number of All industries Algorithm Industry ranking Total number of listed companies Algorithm company ranking Investment opinion Semiconductor and semiconductor equipment 79 5 3,129 54 15,693원 20,323원 24,954원 29,584원 34,214원 High price 40,050원 -61% -49% -38% -26% -15% -70% -60% -50% -40% -30% -20% -10% 0.% 0W 5,000W 10,000W 15,000W 20,000W 25,000W 30,000W 35,000W 40,000W 45,000W Low price Low mid Mid High mid High price Indication price chart (Consolidated) Indication price hanmi semiconductor Gap hanmi semiconductor
- 2. [Price for scheduled purchasing] Arbitrarily made Algorithm stocks Trading Strategies (consolidated) 042700 Date Period Gap (Indication / stock) Color 2021-07-22 3 months Current stock price Evaluation Stock price rise probability score Investment opinion Prospective purchase amount 40,050 W High price 45.3 Normal 3,500,000 W Suggested Purchase Amount 1,317,939 W Number of stocks purchased 33 Indication price Range Buying / Selling Buying / Selling [Stocks] High price 34,214 W 34,214 W~ ~ 29,584 W -15 % 192,034 W 6 High mid 29,584 W 29,584 W ~ 24,954 W -26 % 344,410 W 12 Mid 24,954 W 24,954 W ~ 20,323 W -38 % 496,785 W 20 Low mid 20,323 W 20,323 W ~ 15,693 W -49 % 649,161 W 32 low price 15,693 W 15,693 W ~ 0 W -61 % 801,536 W 51 Stock price rise probability score A Sector 51.0 51.2 46.0 48.4 47.6 50.8 45.3 B Sector 28.8 35.0 37.5 48.4 26.7 26.7 Total average 2021.02.26 2021.03.29 2021.04.26 2021.05.26 2021.06.23 2021.07.21 39.9 43.1 41.7 24.6 37.1 38.7 34 % 4 % 2021.03.29 2021.04.26 2021.05.26 2021.06.23 2021.07.21 Total of increase rate Total score A Sector 1 % -11 % 5 % -2 % 6 % -6 % 48.0 B Sector 18 % 7 % 23 % -82 % 0 % Total average 8 % -3 % -70 % 51 51 46 48 48 51 29 35 38 48 27 27 40 43 42 25 37 39 0 10 20 30 40 50 60 2021.02.26 2021.03.29 2021.04.26 2021.05.26 2021.06.23 2021.07.21 Stock price rise probability score A sector B sector Total average 1% -11% 5% -2% 6% 18% 7% 23% -82% 0% 8% -3% -70% 34% 4% -100% -80% -60% -40% -20% 0% 20% 40% 2021.03.29 2021.04.26 2021.05.26 2021.06.23 2021.07.21 Increase rate of stock price rise A sector B sector Total average hanmi semiconductor
- 3. 정보와 완전 정보 결 투자판단 있습니 위배 무단으 숙지하 Compliance notice ① The information provided by The Algorithm Company Analysis Consulting is obtained through reliable data and information and The Algorithm Company Analysis Program (TACAP), but its accuracy or completeness are not guaranteed. Furthermore, it may change over time.Therefore, we are not legally responsible for the results of the data provided by The Algorithm Company Analysis Consulting because of information errors or omissions. ② The Algorithm Company Analysis Consulting and all the information provided on it site are reference materials for investment decisions and the final responsibility of investment is up to users utilizing this information. ③ The Algorithm Company Analysis Consulting and its site do not do anything that violates the related laws such as discretionary transaction. ④ Users can not reallocate and recycle the information provided by The Algorithm Company Analysis Consulting firm let alone the information provided by its Site. ⑤ Be sure to know about application period of this algorithm analysis report in order to improve its accuracy. Tel : 070 - 4667 - 5009 Email : tacac@tacac.co.kr Homepage : tacac.co.kr Blog : tacac.blog.me SERVICES M&A, IPO, RECOVER, CORPORATE RESTRUCTURING, MANAGEMENT OF TECHNOLOGY, BUSINESS STRATEGY, FAMILY BUSINESS Request : http://tacac.co.kr/?page_id=1374 ① Consulting is o The Algorithm accuracy or com change over tim results of the d Consulting bec ② information pr investment dec up ③ do anything th transaction. ④ The Algorithm information pr ⑤ analysis report