Algorithm Performance and Stock Analysis Over 10 Quarters
•
0 likes•109 views

This document provides a summary of financial performance and stock analysis for a company called Algorithm over several periods from 2017-2021. It includes sales, operating profit, net income, operating rate, debt ratio, and other key financial metrics. It also analyzes the company's stock price probability, buy/sell recommendations, and charts the indication price range. The document evaluates the company's stock price rise probability score compared to sector averages and provides strategies for purchasing the stock.
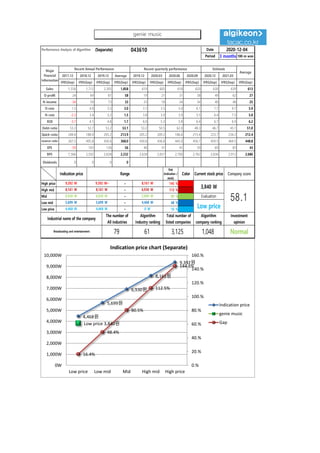
![[Price for scheduled purchasing]
Arbitrarily made
Algorithm stocks Trading Strategies (Separate) 043610 Date
Period
Gap
(Indication /
stock)
Color
2020-12-04
3 months
Current stock price Evaluation
Stock price rise
probability score
Investment opinion Prospective purchase amount
3,840 W Low price 58.4 Normal 8,800,000 W
Suggested Purchase
Amount 4,161,786 W
Number of stocks
purchased 1,084
Indication price Range Buying / Selling Buying / Selling [Stocks]
High price 9,392 W 9,392 W~ ~ 8,161 W 145 % -6,017,148 W All selling
High mid 8,161 W 8,161 W ~ 6,930 W 113 % -4,683,100 W All selling
Mid 6,930 W 6,930 W ~ 5,699 W 80 % -3,349,053 W -483
Low mid 5,699 W 5,699 W ~ 4,468 W 48 % -2,015,005 W -354
low price 4,468 W 4,468 W ~ 0 W 16 % -680,957 W -152
2020.07.09 2020.08.06 2020.09.04 2020.10.07 2020.11.05 2020.12.03
25.4 35.2 35.0
Stock price rise
probability score
A Sector 46.1 48.3 51.1 49.7 50.4 41.7
58.4B Sector 15.4 20.8 49.7 49.7 20.0 28.3
Total average 30.8 34.6 43.7
28 % -1 %
2020.08.06 2020.09.04 2020.10.07 2020.11.05 2020.12.03
Total of
increase rate
Total score
A Sector 5 % 5 % -3 % 1 % -21 %
-3 % 52.7B Sector 26 % 43 % 27 % -149 % 29 %
Total average 11 % 21 % -72 %
5% 5% -3% 1%
-21%
26%
43%
27%
-149%
29%
11% 21%
-72%
28%
-1%
-200%
-150%
-100%
-50%
0%
50%
100%
2020.08.06 2020.09.04 2020.10.07 2020.11.05 2020.12.03
Increase rate of stock price rise
A sector
B sector
Total average
genie music
46 48
51 50 50
42
15
21
36
50
20
2831
35
44
25
35 35
0
10
20
30
40
50
60
2020.07.09 2020.08.06 2020.09.04 2020.10.07 2020.11.05 2020.12.03
Stock price rise probability score
A sector
B sector
Total average](data:image/gif;base64,R0lGODlhAQABAIAAAAAAAP///yH5BAEAAAAALAAAAAABAAEAAAIBRAA7)
Recommended
Recommended
More Related Content
What's hot
What's hot (20)
Similar to Algorithm Performance and Stock Analysis Over 10 Quarters
Similar to Algorithm Performance and Stock Analysis Over 10 Quarters (20)
More from 알고리즘 기업분석 컨설팅-알기컨,algikeon
More from 알고리즘 기업분석 컨설팅-알기컨,algikeon (20)
Recently uploaded
Recently uploaded (20)
Algorithm Performance and Stock Analysis Over 10 Quarters
- 1. Performance Analysis of Algorithm (Separate) 043610 Date Period 3 months 100-m won 2017.12 2018.12 2019.12 Average 2019.12 2020.03 2020.06 2020.09 2020.12 2021.03 IFRS(Sep) IFRS(Sep) IFRS(Sep) IFRS(Sep) IFRS(Sep) IFRS(Sep) IFRS(Sep) IFRS(Sep) IFRS(Sep) IFRS(Sep) IFRS(Sep) Sales 1,556 1,712 2,305 1,858 610 605 618 620 630 639 613 O-profit 24 69 81 58 19 21 31 38 49 62 27 N-income -34 59 73 33 23 18 24 34 40 48 25 O-rate 1.5 4.0 3.5 3.0 3.1 3.5 5.0 6.1 7.7 9.7 5.9 N-rate -2.2 3.4 3.2 1.5 3.8 3.0 3.9 5.5 6.4 7.5 5.0 ROE -3.7 4.1 4.8 1.7 6.0 5.3 5.8 6.4 6.7 6.9 6.2 Debt-ratio 53.3 52.7 53.2 53.1 53.2 50.5 62.0 48.3 46.7 45.1 51.0 Quick-ratio 248.6 188.0 205.2 213.9 205.2 209.2 186.6 215.4 223.7 234.2 212.4 reserve-ratio 267.5 405.8 430.6 368.0 430.6 436.8 445.0 456.7 459.5 464.5 448.8 EPS -59 102 126 56 40 31 41 59 69 83 43 BPS 1,566 2,502 2,628 2,232 2,628 2,657 2,700 2,762 2,836 2,912 2,686 Dividends 0 0 0 0 2020-12-04 Major Financial Information Recent Annual Performance Recent quarterly performance Estimate Average Gap (Indication / stock) Color High price ~ 145 % High mid ~ 113 % Mid ~ 80 % Low mid ~ 48 % Low price ~ 16 % Indication price Range Current stock price Company score 8,161 W 8,161 W 6,930 W 6,930 W 6,930 W 5,699 W Evaluation 9,392 W 9,392 W~ 8,161 W 3,840 W 58.15,699 W 5,699 W 4,468 W Low price Normal 4,468 W 4,468 W 0 W Industrial name of the company The number of All industries Algorithm Industry ranking Total number of listed companies Algorithm company ranking Investment opinion Broadcasting and entertainment 79 61 3,125 1,048 4,468원 5,699원 6,930원 8,161원 9,392원 Low price 3,840원 16.4% 48.4% 80.5% 112.5% 144.6% 0.% 20.% 40.% 60.% 80.% 100.% 120.% 140.% 160.% 0W 1,000W 2,000W 3,000W 4,000W 5,000W 6,000W 7,000W 8,000W 9,000W 10,000W Low price Low mid Mid High mid High price Indication price chart (Separate) Indication price genie music Gap genie music
- 2. [Price for scheduled purchasing] Arbitrarily made Algorithm stocks Trading Strategies (Separate) 043610 Date Period Gap (Indication / stock) Color 2020-12-04 3 months Current stock price Evaluation Stock price rise probability score Investment opinion Prospective purchase amount 3,840 W Low price 58.4 Normal 8,800,000 W Suggested Purchase Amount 4,161,786 W Number of stocks purchased 1,084 Indication price Range Buying / Selling Buying / Selling [Stocks] High price 9,392 W 9,392 W~ ~ 8,161 W 145 % -6,017,148 W All selling High mid 8,161 W 8,161 W ~ 6,930 W 113 % -4,683,100 W All selling Mid 6,930 W 6,930 W ~ 5,699 W 80 % -3,349,053 W -483 Low mid 5,699 W 5,699 W ~ 4,468 W 48 % -2,015,005 W -354 low price 4,468 W 4,468 W ~ 0 W 16 % -680,957 W -152 2020.07.09 2020.08.06 2020.09.04 2020.10.07 2020.11.05 2020.12.03 25.4 35.2 35.0 Stock price rise probability score A Sector 46.1 48.3 51.1 49.7 50.4 41.7 58.4B Sector 15.4 20.8 49.7 49.7 20.0 28.3 Total average 30.8 34.6 43.7 28 % -1 % 2020.08.06 2020.09.04 2020.10.07 2020.11.05 2020.12.03 Total of increase rate Total score A Sector 5 % 5 % -3 % 1 % -21 % -3 % 52.7B Sector 26 % 43 % 27 % -149 % 29 % Total average 11 % 21 % -72 % 5% 5% -3% 1% -21% 26% 43% 27% -149% 29% 11% 21% -72% 28% -1% -200% -150% -100% -50% 0% 50% 100% 2020.08.06 2020.09.04 2020.10.07 2020.11.05 2020.12.03 Increase rate of stock price rise A sector B sector Total average genie music 46 48 51 50 50 42 15 21 36 50 20 2831 35 44 25 35 35 0 10 20 30 40 50 60 2020.07.09 2020.08.06 2020.09.04 2020.10.07 2020.11.05 2020.12.03 Stock price rise probability score A sector B sector Total average
- 3. may ded by Compliance notice ① The information provided by The Algorithm Company Analysis Consulting is obtained through reliable data and information and The Algorithm Company Analysis Program (TACAP), but its accuracy or completeness are not guaranteed. Furthermore, it may change over time.Therefore, we are not legally responsible for the results of the data provided by The Algorithm Company Analysis Consulting because of information errors or omissions. ② The Algorithm Company Analysis Consulting and all the information provided on it site are reference materials for investment decisions and the final responsibility of investment is up to users utilizing this information. ③ The Algorithm Company Analysis Consulting and its site do not do anything that violates the related laws such as discretionary transaction. ④ Users can not reallocate and recycle the information provided by The Algorithm Company Analysis Consulting firm let alone the information provided by its Site. ⑤ Be sure to know about application period of this algorithm analysis report in order to improve its accuracy. Tel : 070 - 4667 - 5009 Email : tacac@tacac.co.kr Homepage : tacac.co.kr Blog : tacac.blog.me SERVICES M&A, IPO, RECOVER, CORPORATE RESTRUCTURING, MANAGEMENT OF TECHNOLOGY, BUSINESS STRATEGY, FAMILY BUSINESS Request : http://tacac.co.kr/?page_id=1374