Algorithm Performance and Stock Analysis
•
0 likes•5 views

This document provides a performance analysis and stock trading strategy for Algorithm company over a 3 month period. It includes historical financial data, current stock price, indication price ranges, a purchase strategy suggesting buying 33 stocks at the current price of 125,000 won, and charts analyzing the stock's probability of rising and past increase rates. Disclaimers are provided stating the analysis is for reference only and accuracy is not guaranteed, and the user is responsible for investment decisions.
![[Price for scheduled purchasing]
Arbitrarily made
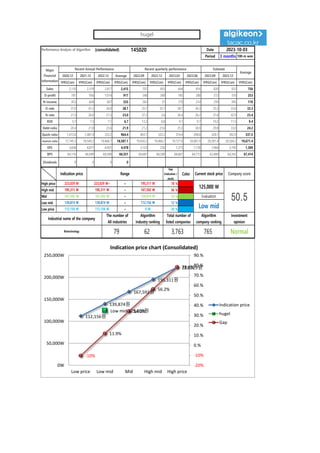
Algorithm stocks Trading Strategies (consolidated) 145020 Date
Period
Gap
(Indication /
stock)
Color
2023-10-03
3 months
Current stock price Evaluation
Stock price rise
probability score
Investment opinion Prospective purchase amount
125,000 W Low mid 52.0 Normal 9,000,000 W
Suggested Purchase
Amount 4,134,089 W
Number of stocks
purchased 33
Indication price Range Buying / Selling Buying / Selling [Stocks]
High price 223,029 W 223,029 W~ ~ 195,311 W 78 % -3,242,079 W -15
High mid 195,311 W 195,311 W ~ 167,592 W 56 % -2,325,363 W -12
Mid 167,592 W 167,592 W ~ 139,874 W 34 % -1,408,647 W -8
Low mid 139,874 W 139,874 W ~ 112,156 W 12 % -491,931 W -4
low price 112,156 W 112,156 W ~ 0 W -10 % 424,785 W 4
Stock price rise
probability score
A Sector 48.1 47.5 45.7 42.6 51.8 46.8
52.0
B Sector 35.8 12.5 42.9 42.6 46.3 44.6
Total average
2023.05.04 2023.06.05 2023.07.04 2023.08.01 2023.08.30 2023.09.27
42.0 30.0 44.3 38.8 49.0 45.7
21 % -7 %
2023.06.05 2023.07.04 2023.08.01 2023.08.30 2023.09.27
Total of
increase rate
Total score
A Sector -1 % -4 % -7 % 18 % -10 %
-2 % 47.0
B Sector -187 % 71 % -1 % 8 % -4 %
Total average -40 % 32 % -14 %
48 47 46
43
52
47
36
13
43 43
46 45
42
30
44
39
49
46
0
10
20
30
40
50
60
2023.05.04 2023.06.05 2023.07.04 2023.08.01 2023.08.30 2023.09.27
Stock price rise probability score
A sector
B sector
Total average
-1% -4% -7%
18%
-10%
-187%
71%
-1% 8% -4%
-40%
32%
-14%
21%
-7%
-200%
-150%
-100%
-50%
0%
50%
100%
2023.06.05 2023.07.04 2023.08.01 2023.08.30 2023.09.27
Increase rate of stock price rise
A sector
B sector
Total average
hugel](data:image/gif;base64,R0lGODlhAQABAIAAAAAAAP///yH5BAEAAAAALAAAAAABAAEAAAIBRAA7)
Recommended
Recommended
More Related Content
Similar to Algorithm Performance and Stock Analysis
Similar to Algorithm Performance and Stock Analysis (20)
More from 알고리즘 기업분석 컨설팅-알기컨,algikeon
More from 알고리즘 기업분석 컨설팅-알기컨,algikeon (20)
Recently uploaded
Recently uploaded (20)
Algorithm Performance and Stock Analysis
- 1. Performance Analysis of Algorithm (consolidated) 145020 Date Period 3 months 100-m won 2020.12 2021.12 2022.12 Average 2022.09 2022.12 2023.03 2023.06 2023.09 2023.12 IFRS(Con) IFRS(Con) IFRS(Con) IFRS(Con) IFRS(Con) IFRS(Con) IFRS(Con) IFRS(Con) IFRS(Con) IFRS(Con) IFRS(Con) Sales 2,110 2,319 2,817 2,415 707 855 644 816 820 922 756 O-profit 781 956 1,014 917 248 300 185 280 272 310 253 N-income 453 604 607 555 263 31 170 214 259 395 170 O-rate 37.0 41.2 36.0 38.1 35.1 35.1 28.7 34.3 33.2 33.6 33.3 N-rate 21.5 26.0 21.5 23.0 37.2 3.6 26.4 26.2 31.6 42.9 23.4 ROE 5.7 7.3 7.1 6.7 12.2 6.8 9.1 9.7 10.2 11.5 9.4 Debt-ratio 20.4 21.8 23.6 21.9 21.2 23.6 25.3 26.9 29.8 33.0 24.2 Quick-ratio 1,472.6 1,087.4 333.2 964.4 403.7 333.2 314.4 298.8 328.1 392.9 337.5 reserve-ratio 17,745.3 18,549.2 19,466.7 18,587.1 19,430.2 19,466.7 19,727.0 20,061.9 20,281.4 20,504.2 19,671.4 EPS 3,658 4,877 4,901 4,478 2,123 250 1,373 1,728 1,964 3,195 1,369 BPS 64,116 66,949 68,589 66,551 69,687 68,589 66,667 64,713 62,489 60,342 67,414 Dividends 0 0 0 0 2023-10-03 Major Financial Information Recent Annual Performance Recent quarterly performance Estimate Average Gap (Indication / stock) Color High price ~ 78 % High mid ~ 56 % Mid ~ 34 % Low mid ~ 12 % Low price ~ -10 % Indication price Range Current stock price Company score 195,311 W 195,311 W 167,592 W 167,592 W 167,592 W 139,874 W Evaluation 223,029 W 223,029 W~ 195,311 W 125,000 W 50.5 139,874 W 139,874 W 112,156 W Low mid Normal 112,156 W 112,156 W 0 W Industrial name of the company The number of All industries Algorithm Industry ranking Total number of listed companies Algorithm company ranking Investment opinion Biotechnology 79 62 3,763 765 112,156원 139,874원 167,592원 195,311원 223,029원 Low mid 125,000원 -10% 11.9% 34.1% 56.2% 78.4% -20% -10% 0.% 10.% 20.% 30.% 40.% 50.% 60.% 70.% 80.% 90.% 0W 50,000W 100,000W 150,000W 200,000W 250,000W Low price Low mid Mid High mid High price Indication price chart (Consolidated) Indication price hugel Gap hugel
- 2. [Price for scheduled purchasing] Arbitrarily made Algorithm stocks Trading Strategies (consolidated) 145020 Date Period Gap (Indication / stock) Color 2023-10-03 3 months Current stock price Evaluation Stock price rise probability score Investment opinion Prospective purchase amount 125,000 W Low mid 52.0 Normal 9,000,000 W Suggested Purchase Amount 4,134,089 W Number of stocks purchased 33 Indication price Range Buying / Selling Buying / Selling [Stocks] High price 223,029 W 223,029 W~ ~ 195,311 W 78 % -3,242,079 W -15 High mid 195,311 W 195,311 W ~ 167,592 W 56 % -2,325,363 W -12 Mid 167,592 W 167,592 W ~ 139,874 W 34 % -1,408,647 W -8 Low mid 139,874 W 139,874 W ~ 112,156 W 12 % -491,931 W -4 low price 112,156 W 112,156 W ~ 0 W -10 % 424,785 W 4 Stock price rise probability score A Sector 48.1 47.5 45.7 42.6 51.8 46.8 52.0 B Sector 35.8 12.5 42.9 42.6 46.3 44.6 Total average 2023.05.04 2023.06.05 2023.07.04 2023.08.01 2023.08.30 2023.09.27 42.0 30.0 44.3 38.8 49.0 45.7 21 % -7 % 2023.06.05 2023.07.04 2023.08.01 2023.08.30 2023.09.27 Total of increase rate Total score A Sector -1 % -4 % -7 % 18 % -10 % -2 % 47.0 B Sector -187 % 71 % -1 % 8 % -4 % Total average -40 % 32 % -14 % 48 47 46 43 52 47 36 13 43 43 46 45 42 30 44 39 49 46 0 10 20 30 40 50 60 2023.05.04 2023.06.05 2023.07.04 2023.08.01 2023.08.30 2023.09.27 Stock price rise probability score A sector B sector Total average -1% -4% -7% 18% -10% -187% 71% -1% 8% -4% -40% 32% -14% 21% -7% -200% -150% -100% -50% 0% 50% 100% 2023.06.05 2023.07.04 2023.08.01 2023.08.30 2023.09.27 Increase rate of stock price rise A sector B sector Total average hugel
- 3. 정보와 완전 정보 결 투자판단 있습니 위배 무단으 숙지하 Compliance notice ① The information provided by The Algorithm Company Analysis Consulting is obtained through reliable data and information and The Algorithm Company Analysis Program (TACAP), but its accuracy or completeness are not guaranteed. Furthermore, it may change over time.Therefore, we are not legally responsible for the results of the data provided by The Algorithm Company Analysis Consulting because of information errors or omissions. ② The Algorithm Company Analysis Consulting and all the information provided on it site are reference materials for investment decisions and the final responsibility of investment is up to users utilizing this information. ③ The Algorithm Company Analysis Consulting and its site do not do anything that violates the related laws such as discretionary transaction. ④ Users can not reallocate and recycle the information provided by The Algorithm Company Analysis Consulting firm let alone the information provided by its Site. ⑤ Be sure to know about application period of this algorithm analysis report in order to improve its accuracy. Tel : 070 - 4667 - 5009 Email : tacac@tacac.co.kr Homepage : tacac.co.kr Blog : tacac.blog.me SERVICES M&A, IPO, RECOVER, CORPORATE RESTRUCTURING, MANAGEMENT OF TECHNOLOGY, BUSINESS STRATEGY, FAMILY BUSINESS Request : http://tacac.co.kr/?page_id=1374 ① Consulting is o The Algorithm accuracy or com change over tim results of the d Consulting bec ② information pr investment dec up ③ do anything th transaction. ④ The Algorithm information pr ⑤ analysis report