Download to read offline
![[Price for scheduled purchasing]
Arbitrarily made
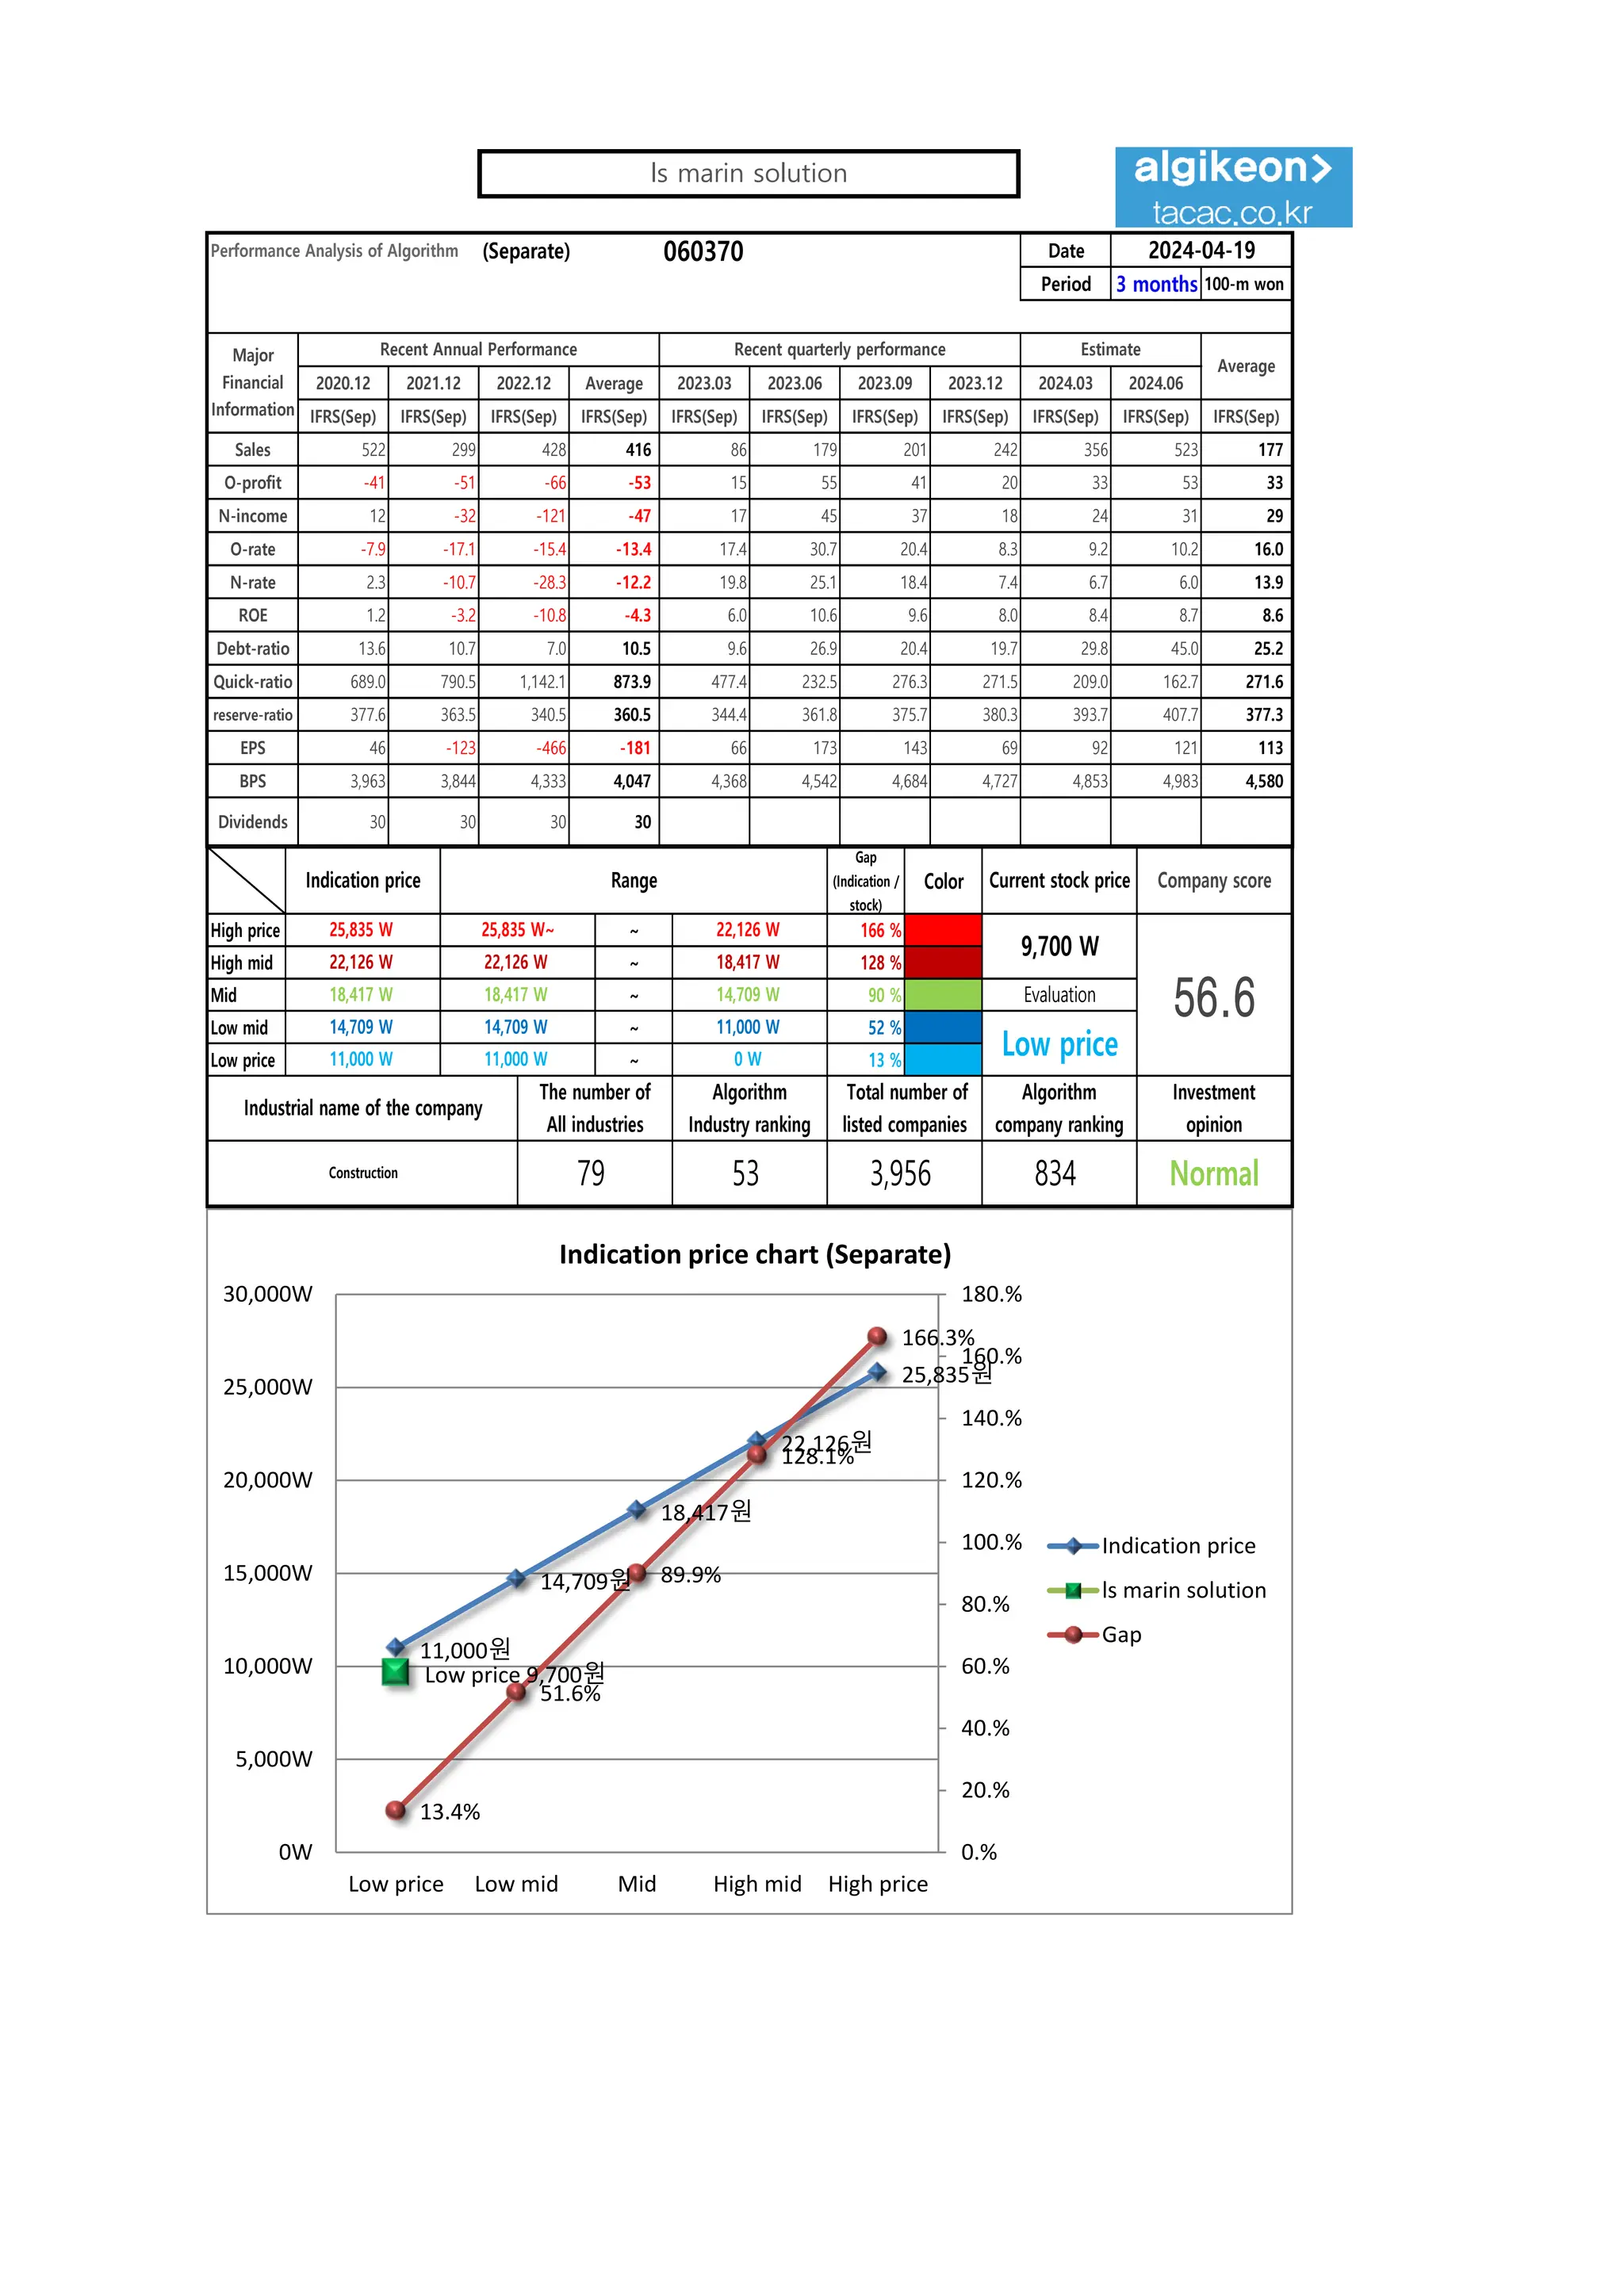
Algorithm stocks Trading Strategies (Separate) 060370 Date
Period
Gap
(Indication /
stock)
Color
low price 11,000 W 11,000 W ~ 0 W 13 % -726,369 W -66
Low mid 14,709 W 14,709 W ~ 11,000 W 52 % -2,797,950 W -190
Mid 18,417 W 18,417 W ~ 14,709 W 90 % -4,869,532 W -264
High mid 22,126 W 22,126 W ~ 18,417 W 128 % -6,941,113 W All selling
Suggested Purchase
Amount 5,418,382 W
Number of stocks
purchased 559
Indication price Range Buying / Selling Buying / Selling [Stocks]
High price 25,835 W 25,835 W~ ~ 22,126 W 166 % -9,012,695 W All selling
2024-04-19
3 months
Current stock price Evaluation
Stock price rise
probability score
Investment opinion Prospective purchase amount
9,700 W Low price 74.1 Normal 10,000,000 W
Stock price rise
probability score
A Sector 45.5 50.6 45.7 46.4 44.3 53.6
74.1
B Sector 19.2 26.3 46.4 46.4 22.5 30.8
Total average 32.3 38.4 41.2 20.0 33.4 42.2
2023.11.21 2023.12.19 2024.01.19 2024.02.20 2024.03.20 2024.04.18
2024.01.19 2024.02.20 2024.03.20 2024.04.18
Total of
increase rate
Total score
A Sector 10 % -11 % 2 % -5 % 17 %
-4 % 55.0
B Sector 27 % 28 % 21 % -106 % 27 %
Total average 16 % 7 % -106 % 40 % 21 %
2023.12.19
10%
-11%
2% -5%
17%
27% 28% 21%
-106%
27%
16%
7%
-106%
40%
21%
-150%
-100%
-50%
0%
50%
2023.12.19 2024.01.19 2024.02.20 2024.03.20 2024.04.18
Increase rate of stock price rise
A sector
B sector
Total average
ls marin solution
45
51
46 46 44
54
19
26
37
46
23
31
32
38
41
20
33
42
0
10
20
30
40
50
60
2023.11.21 2023.12.19 2024.01.19 2024.02.20 2024.03.20 2024.04.18
Stock price rise probability score
A sector
B sector
Total average](https://image.slidesharecdn.com/lsmarinesolution060370algoritminvestmentreport-240419012707-d85c8a4a/75/ls-marine-solution-060370-Algoritm-Investment-Report-2-2048.jpg)

The document provides a detailed performance analysis of an algorithm over a three-month period, including key financial metrics such as sales, profit margins, net income, and stock price evaluations. It presents investment opinions, price ranges, and various sector performance predictions, while noting the limitations and responsibilities regarding the accuracy of the data provided. Compliance and legal disclaimers are also included, emphasizing the importance of user discretion in investment decisions.


![[웹케시]webcash 053580 Algorithm Investment Report](https://cdn.slidesharecdn.com/ss_thumbnails/webcash053580algorithminvestmentreport-250925003052-f31dd73c-thumbnail.jpg?width=640&height=640&fit=bounds)

![[롯데웰푸드]lottewell food 280360 Algorithm Investment Report](https://cdn.slidesharecdn.com/ss_thumbnails/lottewellfood280360algorithminvestmentreport-251010014427-e0439c3a-thumbnail.jpg?width=640&height=640&fit=bounds)
![[동원산업]dongwon industries 006040 Algorithm Investment Report](https://cdn.slidesharecdn.com/ss_thumbnails/dongwonindustries006040algorithminvestmentreport-251003020532-5dd00f8a-thumbnail.jpg?width=640&height=640&fit=bounds)
![[동서]dongsuh 026960 Algorithm Investment Report](https://cdn.slidesharecdn.com/ss_thumbnails/dongsuh026960algorithminvestmentreport-251001020056-e986a251-thumbnail.jpg?width=640&height=640&fit=bounds)


![[쿠콘]coocon 294570 Algorithm Investment Report](https://cdn.slidesharecdn.com/ss_thumbnails/coocon294570algorithminvestmentreport-250926162409-bd6c1593-thumbnail.jpg?width=640&height=640&fit=bounds)
![[휴림로봇]hyulimrobot 090710 Algorithm Investment Report](https://cdn.slidesharecdn.com/ss_thumbnails/hyulimrobot090710algorithminvestmentreport-250923234005-7edfe548-thumbnail.jpg?width=640&height=640&fit=bounds)


![[더즌]dozn 462860 Algorithm Investment Report](https://cdn.slidesharecdn.com/ss_thumbnails/dozn462860algorithminvestmentreport-250920161038-b31c0a65-thumbnail.jpg?width=640&height=640&fit=bounds)

![[헥토파이낸셜]hectofinancial 234340 Algorithm Investment Report](https://cdn.slidesharecdn.com/ss_thumbnails/hectofinancial234340algorithminvestmentreport-250917010057-0603ecf0-thumbnail.jpg?width=640&height=640&fit=bounds)
![[한국공항]Korea Airport Service 005430 Algorithm Investment Report](https://cdn.slidesharecdn.com/ss_thumbnails/koreaairportservice005430algorithminvestmentreport-250915064019-e6873549-thumbnail.jpg?width=640&height=640&fit=bounds)
![[대상]Daesang 001680 Algorithm Investment Report](https://cdn.slidesharecdn.com/ss_thumbnails/daesang001680algorithminvestmentreport-250915063303-81c41298-thumbnail.jpg?width=640&height=640&fit=bounds)
![[삼성중공업] Samsung Heavy Industries 010140 Algorithm Investment Report](https://cdn.slidesharecdn.com/ss_thumbnails/samsungheavyindustries010140algorithminvestmentreport-250904015122-fe022f35-thumbnail.jpg?width=640&height=640&fit=bounds)
![대상 001680 알고리즘 기업분석 보고서 [알고리즘 기업분석 컨설팅-알기컨]](https://cdn.slidesharecdn.com/ss_thumbnails/001680-250303132112-443c504a-thumbnail.jpg?width=640&height=640&fit=bounds)
![[삼성전자]samsung electronics 005930 Algorithm Investment Report](https://cdn.slidesharecdn.com/ss_thumbnails/samsungelectronics005930algorithminvestmentreport-250227014600-4fa86dc7-thumbnail.jpg?width=640&height=640&fit=bounds)
![[동서]dongsuh 026960 Algorithm Investment Report](https://cdn.slidesharecdn.com/ss_thumbnails/dongsuh026960algorithminvestmentreport-250226011658-61b0afaa-thumbnail.jpg?width=640&height=640&fit=bounds)
![동원fnb 049770 알고리즘 기업분석 보고서 [알고리즘 기업분석 컨설팅-알기컨]](https://cdn.slidesharecdn.com/ss_thumbnails/fnb049770-250224032312-db728faf-thumbnail.jpg?width=640&height=640&fit=bounds)
![[SFA반도체]SFA semicon 036540 Algorithm Investment Report](https://cdn.slidesharecdn.com/ss_thumbnails/sfasemicon036540algorithminvestmentreport-250219022804-aa8f2510-thumbnail.jpg?width=640&height=640&fit=bounds)