seegene 096530 Algorithm Investment Report
•
0 likes•85 views

seegene 096530 Algorithm Investment Report
![[Price for scheduled purchasing]
Arbitrarily made
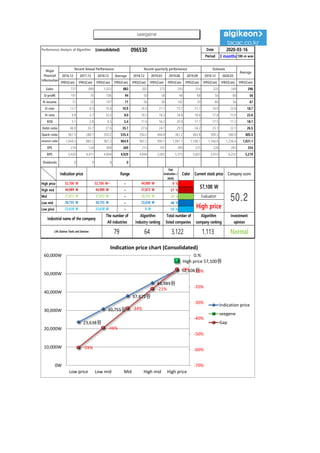
Algorithm stocks Trading Strategies (consolidated) 096530 Date
Period
Gap
(Indication /
stock)
Color
2020-03-16
3 months
Current stock price Evaluation
Stock price rise
probability score
Investment opinion Prospective purchase amount
57,100 W High price 35.6 Normal 5,000,000 W
Suggested Purchase
Amount 1,423,518 W
Number of stocks
purchased 25
Indication price Range Buying / Selling Buying / Selling [Stocks]
High price 52,106 W 52,106 W~ ~ 44,989 W -9 % 124,512 W 2
High mid 44,989 W 44,989 W ~ 37,872 W -21 % 301,937 W 7
Mid 37,872 W 37,872 W ~ 30,755 W -34 % 479,362 W 13
Low mid 30,755 W 30,755 W ~ 23,638 W -46 % 656,787 W 21
low price 23,638 W 23,638 W ~ 0 W -59 % 834,212 W 35
Stock price rise
probability score
A Sector 52.0 52.5 45.8 49.8 43.2 47.6
35.6B Sector 31.7 37.5 38.3 49.8 27.5 47.1
Total average
2019.10.18 2019.11.15 2019.12.13 2020.01.15 2020.02.14 2020.03.13
41.8 45.0 42.1 42.5 35.4 47.4
-20 % 25 %
2019.11.15 2019.12.13 2020.01.15 2020.02.14 2020.03.13
Total of
increase rate
Total score
A Sector 1 % -15 % 8 % -15 % 9 %
1 % 49.7B Sector 16 % 2 % 23 % -81 % 42 %
Total average 7 % -7 % 1 %
52 53
46
50
43
48
32
38 38
50
28
47
42
45
42 43
35
47
0
10
20
30
40
50
60
2019.10.18 2019.11.15 2019.12.13 2020.01.15 2020.02.14 2020.03.13
Stock price rise probability score
A sector
B sector
Total average
1%
-15%
8%
-15%
9%
16%
2%
23%
-81%
42%
7%
-7%
1%
-20%
25%
-100%
-80%
-60%
-40%
-20%
0%
20%
40%
60%
2019.11.15 2019.12.13 2020.01.15 2020.02.14 2020.03.13
Increase rate of stock price rise
A sector
B sector
Total average
seegene](data:image/gif;base64,R0lGODlhAQABAIAAAAAAAP///yH5BAEAAAAALAAAAAABAAEAAAIBRAA7)
Recommended
Recommended
More Related Content
What's hot
What's hot (20)
Similar to seegene 096530 Algorithm Investment Report
Similar to seegene 096530 Algorithm Investment Report (20)
More from 알고리즘 기업분석 컨설팅-알기컨,algikeon
More from 알고리즘 기업분석 컨설팅-알기컨,algikeon (20)
Recently uploaded
Recently uploaded (20)
seegene 096530 Algorithm Investment Report
- 1. Performance Analysis of Algorithm (consolidated) 096530 Date Period 3 months 100-m won 2016.12 2017.12 2018.12 Average 2018.12 2019.03 2019.06 2019.09 2019.12 2020.03 IFRS(Con) IFRS(Con) IFRS(Con) IFRS(Con) IFRS(Con) IFRS(Con) IFRS(Con) IFRS(Con) IFRS(Con) IFRS(Con) IFRS(Con) Sales 737 889 1,023 883 303 275 293 314 335 349 296 O-profit 101 76 106 94 50 58 46 68 56 80 56 N-income 72 33 107 71 56 50 102 59 60 56 67 O-rate 13.7 8.5 10.4 10.9 16.5 21.1 15.7 21.7 16.9 22.8 18.7 N-rate 9.8 3.7 10.5 8.0 18.5 18.2 34.8 18.8 17.8 15.9 22.6 ROE 5.1 2.8 8.3 5.4 17.4 16.3 20.9 17.7 17.5 17.2 18.1 Debt-ratio 46.0 33.7 27.6 35.7 27.6 24.7 29.5 24.2 23.1 22.1 26.5 Quick-ratio 967.3 288.7 350.2 535.4 350.2 446.8 361.2 463.8 509.3 560.9 405.5 reserve-ratio 1,044.3 883.2 967.2 964.9 967.2 990.1 1,061.1 1,106.1 1,166.8 1,236.4 1,031.1 EPS 274 126 408 269 213 191 389 225 226 283 254 BPS 5,420 4,471 4,894 4,929 4,894 5,005 5,375 5,603 5,919 6,253 5,219 Dividends 0 0 0 0 2020-03-16 Major Financial Information Recent Annual Performance Recent quarterly performance Estimate Average Gap (Indication / stock) Color High price ~ -9 % High mid ~ -21 % Mid ~ -34 % Low mid ~ -46 % Low price ~ -59 % Indication price Range Current stock price Company score 44,989 W 44,989 W 37,872 W 37,872 W 37,872 W 30,755 W Evaluation 52,106 W 52,106 W~ 44,989 W 57,100 W 50.230,755 W 30,755 W 23,638 W High price Normal 23,638 W 23,638 W 0 W Industrial name of the company The number of All industries Algorithm Industry ranking Total number of listed companies Algorithm company ranking Investment opinion Life Science Tools and Services 79 64 3,122 1,113 23,638원 30,755원 37,872원 44,989원 52,106원 High price 57,100원 -59% -46% -34% -21% -9% -70% -60% -50% -40% -30% -20% -10% 0.% 0W 10,000W 20,000W 30,000W 40,000W 50,000W 60,000W Low price Low mid Mid High mid High price Indication price chart (Consolidated) Indication price seegene Gap seegene
- 2. [Price for scheduled purchasing] Arbitrarily made Algorithm stocks Trading Strategies (consolidated) 096530 Date Period Gap (Indication / stock) Color 2020-03-16 3 months Current stock price Evaluation Stock price rise probability score Investment opinion Prospective purchase amount 57,100 W High price 35.6 Normal 5,000,000 W Suggested Purchase Amount 1,423,518 W Number of stocks purchased 25 Indication price Range Buying / Selling Buying / Selling [Stocks] High price 52,106 W 52,106 W~ ~ 44,989 W -9 % 124,512 W 2 High mid 44,989 W 44,989 W ~ 37,872 W -21 % 301,937 W 7 Mid 37,872 W 37,872 W ~ 30,755 W -34 % 479,362 W 13 Low mid 30,755 W 30,755 W ~ 23,638 W -46 % 656,787 W 21 low price 23,638 W 23,638 W ~ 0 W -59 % 834,212 W 35 Stock price rise probability score A Sector 52.0 52.5 45.8 49.8 43.2 47.6 35.6B Sector 31.7 37.5 38.3 49.8 27.5 47.1 Total average 2019.10.18 2019.11.15 2019.12.13 2020.01.15 2020.02.14 2020.03.13 41.8 45.0 42.1 42.5 35.4 47.4 -20 % 25 % 2019.11.15 2019.12.13 2020.01.15 2020.02.14 2020.03.13 Total of increase rate Total score A Sector 1 % -15 % 8 % -15 % 9 % 1 % 49.7B Sector 16 % 2 % 23 % -81 % 42 % Total average 7 % -7 % 1 % 52 53 46 50 43 48 32 38 38 50 28 47 42 45 42 43 35 47 0 10 20 30 40 50 60 2019.10.18 2019.11.15 2019.12.13 2020.01.15 2020.02.14 2020.03.13 Stock price rise probability score A sector B sector Total average 1% -15% 8% -15% 9% 16% 2% 23% -81% 42% 7% -7% 1% -20% 25% -100% -80% -60% -40% -20% 0% 20% 40% 60% 2019.11.15 2019.12.13 2020.01.15 2020.02.14 2020.03.13 Increase rate of stock price rise A sector B sector Total average seegene
- 3. 정보와 완전 정보 결 투자판단 있습니 위배 무단으 숙지하 Compliance notice ① The information provided by The Algorithm Company Analysis Consulting is obtained through reliable data and information and The Algorithm Company Analysis Program (TACAP), but its accuracy or completeness are not guaranteed. Furthermore, it may change over time.Therefore, we are not legally responsible for the results of the data provided by The Algorithm Company Analysis Consulting because of information errors or omissions. ② The Algorithm Company Analysis Consulting and all the information provided on it site are reference materials for investment decisions and the final responsibility of investment is up to users utilizing this information. ③ The Algorithm Company Analysis Consulting and its site do not do anything that violates the related laws such as discretionary transaction. ④ Users can not reallocate and recycle the information provided by The Algorithm Company Analysis Consulting firm let alone the information provided by its Site. ⑤ Be sure to know about application period of this algorithm analysis report in order to improve its accuracy. Tel : 070 - 4667 - 5009 Email : tacac@tacac.co.kr Homepage : tacac.co.kr Blog : tacac.blog.me SERVICES M&A, IPO, RECOVER, CORPORATE RESTRUCTURING, MANAGEMENT OF TECHNOLOGY, BUSINESS STRATEGY, FAMILY BUSINESS Request : http://tacac.co.kr/?page_id=1374 ① Consulting is o The Algorithm accuracy or com change over tim results of the d Consulting bec ② information pr investment dec up ③ do anything th transaction. ④ The Algorithm information pr ⑤ analysis report