ajinextek 059120 Algorithm Investment Report
•
1 like•37 views

This document provides a quarterly performance and financial analysis of an algorithm company from 2018 to 2021. It includes sales, operating profit, net income, profit margins, debt ratios, and stock price metrics. An indication price chart shows the company's current stock price is below the indication price range, suggesting it is undervalued. A proposed purchase schedule outlines buying algorithm stocks over the next 3 months if the price reaches certain thresholds. Trend analyses of sector stock price rise probabilities and increase rates are also presented.
![[Price for scheduled purchasing]
Arbitrarily made
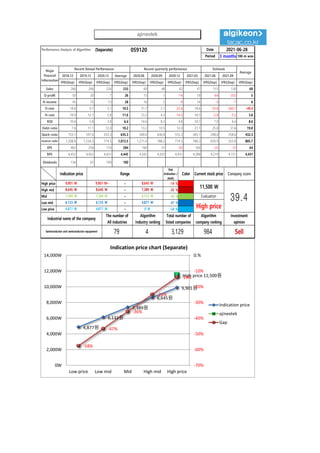
Algorithm stocks Trading Strategies (Separate) 059120 Date
Period
Gap
(Indication /
stock)
Color
2021-06-28
3 months
Current stock price Evaluation
Stock price rise
probability score
Investment opinion Prospective purchase amount
11,500 W High price 39.9 Sell 2,500,000 W
Suggested Purchase
Amount 482,781 W
Number of stocks
purchased 42
Indication price Range Buying / Selling Buying / Selling [Stocks]
High price 9,901 W 9,901 W~ ~ 8,645 W -14 % 67,144 W 7
High mid 8,645 W 8,645 W ~ 7,389 W -25 % 119,866 W 14
Mid 7,389 W 7,389 W ~ 6,133 W -36 % 172,587 W 23
Low mid 6,133 W 6,133 W ~ 4,877 W -47 % 225,309 W 37
low price 4,877 W 4,877 W ~ 0 W -58 % 278,030 W 57
2021.01.29 2021.03.03 2021.03.31 2021.04.28 2021.05.28 2021.06.25
30.4 38.4 31.3
Stock price rise
probability score
A Sector 44.9 54.6 44.7 63.0 50.1 32.2
39.9
B Sector 15.6 37.9 63.0 63.0 26.7 30.4
Total average 30.3 46.3 38.4
21 % -23 %
2021.03.03 2021.03.31 2021.04.28 2021.05.28 2021.06.25
Total of
increase rate
Total score
A Sector 18 % -22 % 29 % -26 % -56 %
-3 % 45.0
B Sector 59 % -18 % 49 % -136 % 12 %
Total average 35 % -20 % -26 %
18%
-22%
29%
-26%
-56%
59%
-18%
49%
-136%
12%
35%
-20% -26%
21%
-23%
-150%
-100%
-50%
0%
50%
100%
2021.03.03 2021.03.31 2021.04.28 2021.05.28 2021.06.25
Increase rate of stock price rise
A sector
B sector
Total average
ajinextek
45
55
45
63
50
32
16
38
32
63
27
30
30
46
38
30
38
31
0
10
20
30
40
50
60
70
2021.01.29 2021.03.03 2021.03.31 2021.04.28 2021.05.28 2021.06.25
Stock price rise probability score
A sector
B sector
Total average](data:image/gif;base64,R0lGODlhAQABAIAAAAAAAP///yH5BAEAAAAALAAAAAABAAEAAAIBRAA7)
Recommended
Recommended
More Related Content
What's hot
What's hot (20)
Similar to ajinextek 059120 Algorithm Investment Report
Similar to ajinextek 059120 Algorithm Investment Report (20)
More from 알고리즘 기업분석 컨설팅-알기컨,algikeon
More from 알고리즘 기업분석 컨설팅-알기컨,algikeon (20)
Recently uploaded
Recently uploaded (8)
ajinextek 059120 Algorithm Investment Report
- 1. Performance Analysis of Algorithm (Separate) 059120 Date Period 3 months 100-m won 2018.12 2019.12 2020.12 Average 2020.06 2020.09 2020.12 2021.03 2021.06 2021.09 IFRS(Sep) IFRS(Sep) IFRS(Sep) IFRS(Sep) IFRS(Sep) IFRS(Sep) IFRS(Sep) IFRS(Sep) IFRS(Sep) IFRS(Sep) IFRS(Sep) Sales 266 206 226 233 69 48 62 97 115 136 69 O-profit 50 20 7 26 15 1 -14 18 -64 -355 5 N-income 45 25 13 28 16 2 -9 16 -3 -7 6 O-rate 18.8 9.7 3.1 10.5 21.7 2.1 -22.6 18.6 -55.6 -260.7 -49.4 N-rate 16.9 12.1 5.8 11.6 23.2 4.2 -14.5 16.5 -2.8 -5.2 3.6 ROE 10.4 5.8 3.0 6.4 14.6 8.2 4.8 10.7 7.0 6.4 8.6 Debt-ratio 7.6 11.1 12.0 10.2 13.2 10.5 12.0 21.1 25.8 31.6 19.0 Quick-ratio 753.1 597.6 555.3 635.3 500.0 636.8 555.3 345.1 298.0 258.6 432.3 reserve-ratio 1,208.6 1,234.3 774.5 1,072.5 1,271.4 788.2 774.5 786.3 659.9 553.8 805.7 EPS 462 256 133 284 164 21 -92 164 -33 -72 64 BPS 4,452 4,452 4,431 4,445 4,503 4,503 4,431 4,288 4,219 4,151 4,431 Dividends 134 67 100 100 2021-06-28 Major Financial Information Recent Annual Performance Recent quarterly performance Estimate Average Gap (Indication / stock) Color High price ~ -14 % High mid ~ -25 % Mid ~ -36 % Low mid ~ -47 % Low price ~ -58 % Indication price Range Current stock price Company score 8,645 W 8,645 W 7,389 W 7,389 W 7,389 W 6,133 W Evaluation 9,901 W 9,901 W~ 8,645 W 11,500 W 39.4 6,133 W 6,133 W 4,877 W High price Sell 4,877 W 4,877 W 0 W Industrial name of the company The number of All industries Algorithm Industry ranking Total number of listed companies Algorithm company ranking Investment opinion Semiconductor and semiconductor equipment 79 4 3,129 984 4,877원 6,133원 7,389원 8,645원 9,901원 High price 11,500원 -58% -47% -36% -25% -14% -70% -60% -50% -40% -30% -20% -10% 0.% 0W 2,000W 4,000W 6,000W 8,000W 10,000W 12,000W 14,000W Low price Low mid Mid High mid High price Indication price chart (Separate) Indication price ajinextek Gap ajinextek
- 2. [Price for scheduled purchasing] Arbitrarily made Algorithm stocks Trading Strategies (Separate) 059120 Date Period Gap (Indication / stock) Color 2021-06-28 3 months Current stock price Evaluation Stock price rise probability score Investment opinion Prospective purchase amount 11,500 W High price 39.9 Sell 2,500,000 W Suggested Purchase Amount 482,781 W Number of stocks purchased 42 Indication price Range Buying / Selling Buying / Selling [Stocks] High price 9,901 W 9,901 W~ ~ 8,645 W -14 % 67,144 W 7 High mid 8,645 W 8,645 W ~ 7,389 W -25 % 119,866 W 14 Mid 7,389 W 7,389 W ~ 6,133 W -36 % 172,587 W 23 Low mid 6,133 W 6,133 W ~ 4,877 W -47 % 225,309 W 37 low price 4,877 W 4,877 W ~ 0 W -58 % 278,030 W 57 2021.01.29 2021.03.03 2021.03.31 2021.04.28 2021.05.28 2021.06.25 30.4 38.4 31.3 Stock price rise probability score A Sector 44.9 54.6 44.7 63.0 50.1 32.2 39.9 B Sector 15.6 37.9 63.0 63.0 26.7 30.4 Total average 30.3 46.3 38.4 21 % -23 % 2021.03.03 2021.03.31 2021.04.28 2021.05.28 2021.06.25 Total of increase rate Total score A Sector 18 % -22 % 29 % -26 % -56 % -3 % 45.0 B Sector 59 % -18 % 49 % -136 % 12 % Total average 35 % -20 % -26 % 18% -22% 29% -26% -56% 59% -18% 49% -136% 12% 35% -20% -26% 21% -23% -150% -100% -50% 0% 50% 100% 2021.03.03 2021.03.31 2021.04.28 2021.05.28 2021.06.25 Increase rate of stock price rise A sector B sector Total average ajinextek 45 55 45 63 50 32 16 38 32 63 27 30 30 46 38 30 38 31 0 10 20 30 40 50 60 70 2021.01.29 2021.03.03 2021.03.31 2021.04.28 2021.05.28 2021.06.25 Stock price rise probability score A sector B sector Total average
- 3. may ded by Compliance notice ① The information provided by The Algorithm Company Analysis Consulting is obtained through reliable data and information and The Algorithm Company Analysis Program (TACAP), but its accuracy or completeness are not guaranteed. Furthermore, it may change over time.Therefore, we are not legally responsible for the results of the data provided by The Algorithm Company Analysis Consulting because of information errors or omissions. ② The Algorithm Company Analysis Consulting and all the information provided on it site are reference materials for investment decisions and the final responsibility of investment is up to users utilizing this information. ③ The Algorithm Company Analysis Consulting and its site do not do anything that violates the related laws such as discretionary transaction. ④ Users can not reallocate and recycle the information provided by The Algorithm Company Analysis Consulting firm let alone the information provided by its Site. ⑤ Be sure to know about application period of this algorithm analysis report in order to improve its accuracy. Tel : 070 - 4667 - 5009 Email : tacac@tacac.co.kr Homepage : tacac.co.kr Blog : tacac.blog.me SERVICES M&A, IPO, RECOVER, CORPORATE RESTRUCTURING, MANAGEMENT OF TECHNOLOGY, BUSINESS STRATEGY, FAMILY BUSINESS Request : http://tacac.co.kr/?page_id=1374