humasis 205470 Algorithm Investment Report
•
0 likes•83 views

This document provides financial and performance data for the Algorithm company over several periods from 2017 to 2020. It includes quarterly sales, operating profit, net income, operating rate, net rate, ROE, debt ratio, quick ratio, and reserve ratio. It also lists the company's industry, ranking, and stock price information, including the current stock price, indication price range, and investment opinion. A section on trading strategies suggests purchase amounts and number of stocks to buy at different price points. Charts show the company's stock price rise probability scores and increase rates over time compared to sector averages.
![[Price for scheduled purchasing]
Arbitrarily made
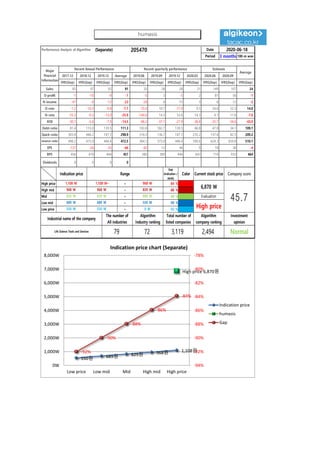
Algorithm stocks Trading Strategies (Separate) 205470 Date
Period
Gap
(Indication /
stock)
Color
2020-06-18
3 months
Current stock price Evaluation
Stock price rise
probability score
Investment opinion Prospective purchase amount
6,870 W High price 48.7 Normal 2,000,000 W
Suggested Purchase
Amount 440,174 W
Number of stocks
purchased 64
Indication price Range Buying / Selling Buying / Selling [Stocks]
High price 1,108 W 1,108 W~ ~ 968 W -84 % 369,202 W 333
High mid 968 W 968 W ~ 829 W -86 % 378,133 W 391
Mid 829 W 829 W ~ 689 W -88 % 387,065 W 467
Low mid 689 W 689 W ~ 550 W -90 % 395,997 W 574
low price 550 W 550 W ~ 0 W -92 % 404,928 W 736
2020.01.21 2020.02.20 2020.03.19 2020.04.17 2020.05.20 2020.06.17
43.3 34.0 36.6
Stock price rise
probability score
A Sector 61.8 48.2 38.9 47.1 50.5 50.8
48.7B Sector 36.7 12.7 47.1 47.1 17.5 22.5
Total average 49.3 30.4 34.3
-27 % 7 %
2020.02.20 2020.03.19 2020.04.17 2020.05.20 2020.06.17
Total of
increase rate
Total score
A Sector -28 % -24 % 17 % 7 % 0 %
-10 % 44.3B Sector -189 % 57 % 37 % -169 % 22 %
Total average -62 % 11 % 21 %
-28% -24%
17% 7% 0%
-189%
57%
37%
-169%
22%
-62%
11% 21%
-27%
7%
-250%
-200%
-150%
-100%
-50%
0%
50%
100%
2020.02.20 2020.03.19 2020.04.17 2020.05.20 2020.06.17
Increase rate of stock price rise
A sector
B sector
Total average
humasis
62
48
39
47
51 51
37
13
30
47
18
23
49
30
34
43
34 37
0
10
20
30
40
50
60
70
2020.01.21 2020.02.20 2020.03.19 2020.04.17 2020.05.20 2020.06.17
Stock price rise probability score
A sector
B sector
Total average](data:image/gif;base64,R0lGODlhAQABAIAAAAAAAP///yH5BAEAAAAALAAAAAABAAEAAAIBRAA7)
Recommended
Recommended
More Related Content
What's hot
What's hot (20)
Similar to humasis 205470 Algorithm Investment Report
Similar to humasis 205470 Algorithm Investment Report (20)
More from 알고리즘 기업분석 컨설팅-알기컨,algikeon
More from 알고리즘 기업분석 컨설팅-알기컨,algikeon (20)
Recently uploaded
Recently uploaded (8)
humasis 205470 Algorithm Investment Report
- 1. Performance Analysis of Algorithm (Separate) 205470 Date Period 3 months 100-m won 2017.12 2018.12 2019.12 Average 2019.06 2019.09 2019.12 2020.03 2020.06 2020.09 IFRS(Sep) IFRS(Sep) IFRS(Sep) IFRS(Sep) IFRS(Sep) IFRS(Sep) IFRS(Sep) IFRS(Sep) IFRS(Sep) IFRS(Sep) IFRS(Sep) Sales 85 97 92 91 20 28 28 21 149 107 24 O-profit -1 -10 -9 -7 -5 3 -5 2 81 56 -1 N-income -47 -9 -12 -23 -28 4 15 3 6 12 -2 O-rate -1.2 -10.3 -9.8 -7.1 -25.0 10.7 -17.9 9.5 54.6 52.3 14.0 N-rate -55.3 -9.3 -13.0 -25.9 -140.0 14.3 53.6 14.3 4.1 11.6 -7.0 ROE -30.1 -5.6 -7.9 -14.5 -86.2 -37.1 -27.9 -36.4 -35.7 -34.6 -43.0 Debt-ratio 81.4 113.0 139.5 111.3 183.8 182.7 139.5 66.8 47.8 34.1 109.1 Quick-ratio 303.4 446.2 147.1 298.9 516.3 136.7 147.1 235.2 137.6 82.5 209.2 reserve-ratio 496.2 475.0 446.4 472.5 364.3 375.0 446.4 590.6 624.3 659.8 510.1 EPS -137 -26 -35 -66 -82 12 44 9 18 36 -4 BPS 456 470 444 457 380 389 444 643 774 933 464 Dividends 0 0 0 0 2020-06-18 Major Financial Information Recent Annual Performance Recent quarterly performance Estimate Average Gap (Indication / stock) Color High price ~ -84 % High mid ~ -86 % Mid ~ -88 % Low mid ~ -90 % Low price ~ -92 % Indication price Range Current stock price Company score 968 W 968 W 829 W 829 W 829 W 689 W Evaluation 1,108 W 1,108 W~ 968 W 6,870 W 45.7689 W 689 W 550 W High price Normal 550 W 550 W 0 W Industrial name of the company The number of All industries Algorithm Industry ranking Total number of listed companies Algorithm company ranking Investment opinion Life Science Tools and Services 79 72 3,119 2,494 550원 689원 829원 968원 1,108원 High price 6,870원 -92% -90% -88% -86% -84% -94% -92% -90% -88% -86% -84% -82% -80% -78% 0W 1,000W 2,000W 3,000W 4,000W 5,000W 6,000W 7,000W 8,000W Low price Low mid Mid High mid High price Indication price chart (Separate) Indication price humasis Gap humasis
- 2. [Price for scheduled purchasing] Arbitrarily made Algorithm stocks Trading Strategies (Separate) 205470 Date Period Gap (Indication / stock) Color 2020-06-18 3 months Current stock price Evaluation Stock price rise probability score Investment opinion Prospective purchase amount 6,870 W High price 48.7 Normal 2,000,000 W Suggested Purchase Amount 440,174 W Number of stocks purchased 64 Indication price Range Buying / Selling Buying / Selling [Stocks] High price 1,108 W 1,108 W~ ~ 968 W -84 % 369,202 W 333 High mid 968 W 968 W ~ 829 W -86 % 378,133 W 391 Mid 829 W 829 W ~ 689 W -88 % 387,065 W 467 Low mid 689 W 689 W ~ 550 W -90 % 395,997 W 574 low price 550 W 550 W ~ 0 W -92 % 404,928 W 736 2020.01.21 2020.02.20 2020.03.19 2020.04.17 2020.05.20 2020.06.17 43.3 34.0 36.6 Stock price rise probability score A Sector 61.8 48.2 38.9 47.1 50.5 50.8 48.7B Sector 36.7 12.7 47.1 47.1 17.5 22.5 Total average 49.3 30.4 34.3 -27 % 7 % 2020.02.20 2020.03.19 2020.04.17 2020.05.20 2020.06.17 Total of increase rate Total score A Sector -28 % -24 % 17 % 7 % 0 % -10 % 44.3B Sector -189 % 57 % 37 % -169 % 22 % Total average -62 % 11 % 21 % -28% -24% 17% 7% 0% -189% 57% 37% -169% 22% -62% 11% 21% -27% 7% -250% -200% -150% -100% -50% 0% 50% 100% 2020.02.20 2020.03.19 2020.04.17 2020.05.20 2020.06.17 Increase rate of stock price rise A sector B sector Total average humasis 62 48 39 47 51 51 37 13 30 47 18 23 49 30 34 43 34 37 0 10 20 30 40 50 60 70 2020.01.21 2020.02.20 2020.03.19 2020.04.17 2020.05.20 2020.06.17 Stock price rise probability score A sector B sector Total average
- 3. may ded by Compliance notice ① The information provided by The Algorithm Company Analysis Consulting is obtained through reliable data and information and The Algorithm Company Analysis Program (TACAP), but its accuracy or completeness are not guaranteed. Furthermore, it may change over time.Therefore, we are not legally responsible for the results of the data provided by The Algorithm Company Analysis Consulting because of information errors or omissions. ② The Algorithm Company Analysis Consulting and all the information provided on it site are reference materials for investment decisions and the final responsibility of investment is up to users utilizing this information. ③ The Algorithm Company Analysis Consulting and its site do not do anything that violates the related laws such as discretionary transaction. ④ Users can not reallocate and recycle the information provided by The Algorithm Company Analysis Consulting firm let alone the information provided by its Site. ⑤ Be sure to know about application period of this algorithm analysis report in order to improve its accuracy. Tel : 070 - 4667 - 5009 Email : tacac@tacac.co.kr Homepage : tacac.co.kr Blog : tacac.blog.me SERVICES M&A, IPO, RECOVER, CORPORATE RESTRUCTURING, MANAGEMENT OF TECHNOLOGY, BUSINESS STRATEGY, FAMILY BUSINESS Request : http://tacac.co.kr/?page_id=1374