bi nex 053030 Algorithm Investment Report
•
0 likes•75 views

This document provides performance and financial data for an algorithm company over several periods from 2017-2021. It includes metrics like sales, operating profit, net income, debt ratio, and stock price. It also evaluates the company's current stock price compared to an indication price range and assigns a probability score for the stock price rising. Finally, it provides strategies for purchasing the company's stocks over the next period based on the analysis.
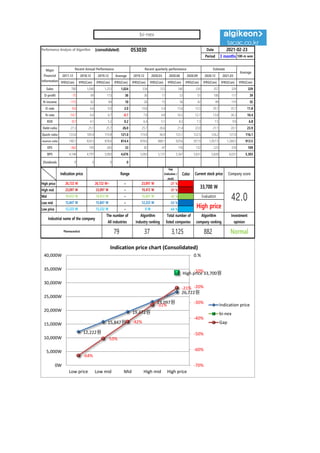
![[Price for scheduled purchasing]
Arbitrarily made
Algorithm stocks Trading Strategies (consolidated) 053030 Date
Period
Gap
(Indication /
stock)
Color
2021-02-23
3 months
Current stock price Evaluation
Stock price rise
probability score
Investment opinion Prospective purchase amount
33,700 W High price 45.8 Normal 2,500,000 W
Suggested Purchase
Amount 808,900 W
Number of stocks
purchased 24
Indication price Range Buying / Selling Buying / Selling [Stocks]
High price 26,722 W 26,722 W~ ~ 23,097 W -21 % 167,493 W 6
High mid 23,097 W 23,097 W ~ 19,472 W -31 % 254,502 W 11
Mid 19,472 W 19,472 W ~ 15,847 W -42 % 341,512 W 18
Low mid 15,847 W 15,847 W ~ 12,222 W -53 % 428,521 W 27
low price 12,222 W 12,222 W ~ 0 W -64 % 515,531 W 42
Stock price rise
probability score
A Sector 48.0 49.7 52.6 50.8 48.7 48.9
45.8
B Sector 20.4 35.0 58.8 50.8 17.5 12.9
Total average
2020.09.22 2020.10.26 2020.11.23 2020.12.21 2021.01.21 2021.02.22
34.2 42.4 55.7 13.8 33.1 30.9
58 % -7 %
2020.10.26 2020.11.23 2020.12.21 2021.01.21 2021.02.22
Total of
increase rate
Total score
A Sector 4 % 5 % -4 % -4 % 0 %
-42 % 48.3
B Sector 42 % 40 % -16 % -190 % -35 %
Total average 19 % 24 % -305 %
48 50 53 51 49 49
20
35
59
51
18
13
34
42
56
14
33 31
0
10
20
30
40
50
60
70
2020.09.22 2020.10.26 2020.11.23 2020.12.21 2021.01.21 2021.02.22
Stock price rise probability score
A sector
B sector
Total average
4% 5% -4% -4% 0%
42% 40%
-16%
-190%
-35%
19% 24%
-305%
58%
-7%
-350%
-300%
-250%
-200%
-150%
-100%
-50%
0%
50%
100%
2020.10.26 2020.11.23 2020.12.21 2021.01.21 2021.02.22
Increase rate of stock price rise
A sector
B sector
Total average
bi-nex](data:image/gif;base64,R0lGODlhAQABAIAAAAAAAP///yH5BAEAAAAALAAAAAABAAEAAAIBRAA7)
Recommended
Recommended
More Related Content
What's hot
What's hot (20)
Similar to bi nex 053030 Algorithm Investment Report
Similar to bi nex 053030 Algorithm Investment Report (20)
More from 알고리즘 기업분석 컨설팅-알기컨,algikeon
More from 알고리즘 기업분석 컨설팅-알기컨,algikeon (20)
Recently uploaded
Recently uploaded (8)
bi nex 053030 Algorithm Investment Report
- 1. Performance Analysis of Algorithm (consolidated) 053030 Date Period 3 months 100-m won 2017.12 2018.12 2019.12 Average 2019.12 2020.03 2020.06 2020.09 2020.12 2021.03 IFRS(Con) IFRS(Con) IFRS(Con) IFRS(Con) IFRS(Con) IFRS(Con) IFRS(Con) IFRS(Con) IFRS(Con) IFRS(Con) IFRS(Con) Sales 780 1,040 1,253 1,024 334 312 340 330 357 329 329 O-profit -75 69 113 36 36 17 53 51 106 117 39 N-income -115 62 84 10 26 15 56 42 49 119 35 O-rate -9.6 6.6 9.0 2.0 10.8 5.4 15.6 15.5 29.7 35.7 11.8 N-rate -14.7 6.0 6.7 -0.7 7.8 4.8 16.5 12.7 13.8 36.3 10.4 ROE -8.7 4.1 5.2 0.2 6.4 5.1 8.2 7.3 7.5 9.9 6.8 Debt-ratio 27.3 25.1 25.7 26.0 25.7 26.6 21.4 22.0 21.1 20.1 23.9 Quick-ratio 133.6 109.4 119.8 121.0 119.8 96.9 125.1 122.5 126.2 131.0 116.1 reserve-ratio 740.1 824.5 878.6 814.4 878.6 888.1 929.6 957.9 1,057.5 1,268.5 913.5 EPS -362 195 265 33 82 47 176 132 223 376 109 BPS 4,148 4,797 5,083 4,676 5,083 5,131 5,367 5,631 5,828 6,031 5,303 Dividends 0 0 0 0 2021-02-23 Major Financial Information Recent Annual Performance Recent quarterly performance Estimate Average Gap (Indication / stock) Color High price ~ -21 % High mid ~ -31 % Mid ~ -42 % Low mid ~ -53 % Low price ~ -64 % Indication price Range Current stock price Company score 23,097 W 23,097 W 19,472 W 19,472 W 19,472 W 15,847 W Evaluation 26,722 W 26,722 W~ 23,097 W 33,700 W 42.0 15,847 W 15,847 W 12,222 W High price Normal 12,222 W 12,222 W 0 W Industrial name of the company The number of All industries Algorithm Industry ranking Total number of listed companies Algorithm company ranking Investment opinion Pharmaceutical 79 37 3,125 882 12,222원 15,847원 19,472원 23,097원 26,722원 High price 33,700원 -64% -53% -42% -31% -21% -70% -60% -50% -40% -30% -20% -10% 0.% 0W 5,000W 10,000W 15,000W 20,000W 25,000W 30,000W 35,000W 40,000W Low price Low mid Mid High mid High price Indication price chart (Consolidated) Indication price bi-nex Gap bi-nex
- 2. [Price for scheduled purchasing] Arbitrarily made Algorithm stocks Trading Strategies (consolidated) 053030 Date Period Gap (Indication / stock) Color 2021-02-23 3 months Current stock price Evaluation Stock price rise probability score Investment opinion Prospective purchase amount 33,700 W High price 45.8 Normal 2,500,000 W Suggested Purchase Amount 808,900 W Number of stocks purchased 24 Indication price Range Buying / Selling Buying / Selling [Stocks] High price 26,722 W 26,722 W~ ~ 23,097 W -21 % 167,493 W 6 High mid 23,097 W 23,097 W ~ 19,472 W -31 % 254,502 W 11 Mid 19,472 W 19,472 W ~ 15,847 W -42 % 341,512 W 18 Low mid 15,847 W 15,847 W ~ 12,222 W -53 % 428,521 W 27 low price 12,222 W 12,222 W ~ 0 W -64 % 515,531 W 42 Stock price rise probability score A Sector 48.0 49.7 52.6 50.8 48.7 48.9 45.8 B Sector 20.4 35.0 58.8 50.8 17.5 12.9 Total average 2020.09.22 2020.10.26 2020.11.23 2020.12.21 2021.01.21 2021.02.22 34.2 42.4 55.7 13.8 33.1 30.9 58 % -7 % 2020.10.26 2020.11.23 2020.12.21 2021.01.21 2021.02.22 Total of increase rate Total score A Sector 4 % 5 % -4 % -4 % 0 % -42 % 48.3 B Sector 42 % 40 % -16 % -190 % -35 % Total average 19 % 24 % -305 % 48 50 53 51 49 49 20 35 59 51 18 13 34 42 56 14 33 31 0 10 20 30 40 50 60 70 2020.09.22 2020.10.26 2020.11.23 2020.12.21 2021.01.21 2021.02.22 Stock price rise probability score A sector B sector Total average 4% 5% -4% -4% 0% 42% 40% -16% -190% -35% 19% 24% -305% 58% -7% -350% -300% -250% -200% -150% -100% -50% 0% 50% 100% 2020.10.26 2020.11.23 2020.12.21 2021.01.21 2021.02.22 Increase rate of stock price rise A sector B sector Total average bi-nex
- 3. 정보와 완전 정보 결 투자판단 있습니 위배 무단으 숙지하 Compliance notice ① The information provided by The Algorithm Company Analysis Consulting is obtained through reliable data and information and The Algorithm Company Analysis Program (TACAP), but its accuracy or completeness are not guaranteed. Furthermore, it may change over time.Therefore, we are not legally responsible for the results of the data provided by The Algorithm Company Analysis Consulting because of information errors or omissions. ② The Algorithm Company Analysis Consulting and all the information provided on it site are reference materials for investment decisions and the final responsibility of investment is up to users utilizing this information. ③ The Algorithm Company Analysis Consulting and its site do not do anything that violates the related laws such as discretionary transaction. ④ Users can not reallocate and recycle the information provided by The Algorithm Company Analysis Consulting firm let alone the information provided by its Site. ⑤ Be sure to know about application period of this algorithm analysis report in order to improve its accuracy. Tel : 070 - 4667 - 5009 Email : tacac@tacac.co.kr Homepage : tacac.co.kr Blog : tacac.blog.me SERVICES M&A, IPO, RECOVER, CORPORATE RESTRUCTURING, MANAGEMENT OF TECHNOLOGY, BUSINESS STRATEGY, FAMILY BUSINESS Request : http://tacac.co.kr/?page_id=1374 ① Consulting is o The Algorithm accuracy or com change over tim results of the d Consulting bec ② information pr investment dec up ③ do anything th transaction. ④ The Algorithm information pr ⑤ analysis report