daesang 001680 Algorithm Investment Report
•
0 likes•58 views

This document provides financial and performance data for a company over several quarters and years, including sales, operating profit, net income, debt ratios, and stock prices. It also includes analysis of the company's stock price prediction scores compared to industry averages, as well as investment opinions and recommendations based on the company's current stock price relative to predicted price ranges.
![[Price for scheduled purchasing]
Arbitrarily made
Algorithm stocks Trading Strategies (consolidated) 001680 Date
Period
Gap
(Indication /
stock)
Color
low price 33,764 W 33,764 W ~ 0 W 30 % -1,505,195 W -45
Low mid 40,103 W 40,103 W ~ 33,764 W 55 % -2,718,373 W -68
Mid 46,442 W 46,442 W ~ 40,103 W 79 % -3,931,552 W -85
High mid 52,780 W 52,780 W ~ 46,442 W 104 % -5,144,731 W All selling
Suggested Purchase
Amount 4,957,140 W
Number of stocks
purchased 191
Indication price Range Buying / Selling Buying / Selling [Stocks]
High price 59,119 W 59,119 W~ ~ 52,780 W 128 % -6,357,909 W All selling
2021-04-09
3 months
Current stock price Evaluation
Stock price rise
probability score
Investment opinion Prospective purchase amount
25,900 W Low price 48.8 Normal 10,000,000 W
39.2 47.2 40.8 39.2 38.9 40.4
2020.11.11 2020.12.09 2021.01.11 2021.02.08 2021.03.11 2021.04.08
Stock price rise
probability score
A Sector 46.2 46.6 48.6 44.3 46.5 47.5
48.8
B Sector 32.1 47.9 32.9 44.3 31.3 33.3
Total average
2021.01.11 2021.02.08 2021.03.11 2021.04.08
Total of
increase rate
Total score
A Sector 1 % 4 % -10 % 5 % 2 %
0 % 47.0
B Sector 33 % -46 % 26 % -42 % 6 %
Total average 17 % -16 % -4 % -1 % 4 %
2020.12.09
46 47 49
44 46 48
32
48
33
44
31 33
39
47
41 39 39 40
0
10
20
30
40
50
60
2020.11.11 2020.12.09 2021.01.11 2021.02.08 2021.03.11 2021.04.08
Stock price rise probability score
A sector
B sector
Total average
1% 4%
-10%
5% 2%
33%
-46%
26%
-42%
6%
17%
-16%
-4% -1%
4%
-60%
-40%
-20%
0%
20%
40%
2020.12.09 2021.01.11 2021.02.08 2021.03.11 2021.04.08
Increase rate of stock price rise
A sector
B sector
Total average
daesang](data:image/gif;base64,R0lGODlhAQABAIAAAAAAAP///yH5BAEAAAAALAAAAAABAAEAAAIBRAA7)
Recommended
Recommended
More Related Content
What's hot
What's hot (20)
Similar to daesang 001680 Algorithm Investment Report
Similar to daesang 001680 Algorithm Investment Report (20)
More from 알고리즘 기업분석 컨설팅-알기컨,algikeon
More from 알고리즘 기업분석 컨설팅-알기컨,algikeon (20)
Recently uploaded
Recently uploaded (8)
daesang 001680 Algorithm Investment Report
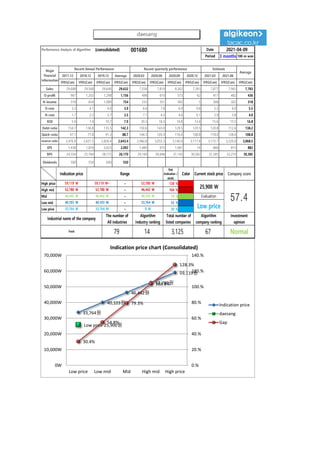
- 1. Performance Analysis of Algorithm (consolidated) 001680 Date Period 3 months 100-m won 2017.12 2018.12 2019.12 Average 2020.03 2020.06 2020.09 2020.12 2021.03 2021.06 IFRS(Con) IFRS(Con) IFRS(Con) IFRS(Con) IFRS(Con) IFRS(Con) IFRS(Con) IFRS(Con) IFRS(Con) IFRS(Con) IFRS(Con) Sales 29,688 29,568 29,640 29,632 7,558 7,819 8,362 7,393 7,877 7,965 7,783 O-profit 967 1,202 1,298 1,156 498 610 573 62 417 482 436 N-income 518 654 1,089 754 533 351 382 5 308 302 318 O-rate 3.3 4.1 4.4 3.9 6.6 7.8 6.9 0.8 5.3 6.0 5.5 N-rate 1.7 2.2 3.7 2.5 7.1 4.5 4.6 0.1 3.9 3.8 4.0 ROE 5.9 7.0 10.7 7.9 20.3 16.5 16.8 13.4 15.6 15.5 16.8 Debt-ratio 154.7 136.8 135.5 142.3 150.6 143.0 129.5 129.5 120.8 112.6 138.2 Quick-ratio 97.1 77.8 91.3 88.7 104.5 105.9 116.0 108.8 118.0 128.4 108.8 reserve-ratio 2,476.4 2,627.5 2,826.4 2,643.4 2,960.8 3,055.3 3,140.0 3,117.8 3,172.7 3,229.0 3,068.5 EPS 1,438 1,816 3,023 2,092 1,480 975 1,061 14 866 815 882 BPS 24,554 25,784 28,172 26,170 29,169 30,646 31,143 30,582 31,385 32,210 30,385 Dividends 500 550 600 550 Major Financial Information Recent Annual Performance Recent quarterly performance Estimate Average 2021-04-09 Gap (Indication / stock) Color High price ~ 128 % High mid ~ 104 % Mid ~ 79 % Low mid ~ 55 % Low price ~ 30 % Normal 33,764 W 33,764 W 0 W Industrial name of the company The number of All industries Algorithm Industry ranking Total number of listed companies Algorithm company ranking Investment opinion Food 79 14 3,125 67 52,780 W 52,780 W 46,442 W 46,442 W 46,442 W 40,103 W Evaluation 59,119 W 59,119 W~ 52,780 W 25,900 W 57.4 40,103 W 40,103 W 33,764 W Low price Indication price Range Current stock price Company score 33,764원 40,103원 46,442원 52,780원 59,119원 Low price 25,900원 30.4% 54.8% 79.3% 103.8% 128.3% 0.% 20.% 40.% 60.% 80.% 100.% 120.% 140.% 0W 10,000W 20,000W 30,000W 40,000W 50,000W 60,000W 70,000W Low price Low mid Mid High mid High price Indication price chart (Consolidated) Indication price daesang Gap daesang
- 2. [Price for scheduled purchasing] Arbitrarily made Algorithm stocks Trading Strategies (consolidated) 001680 Date Period Gap (Indication / stock) Color low price 33,764 W 33,764 W ~ 0 W 30 % -1,505,195 W -45 Low mid 40,103 W 40,103 W ~ 33,764 W 55 % -2,718,373 W -68 Mid 46,442 W 46,442 W ~ 40,103 W 79 % -3,931,552 W -85 High mid 52,780 W 52,780 W ~ 46,442 W 104 % -5,144,731 W All selling Suggested Purchase Amount 4,957,140 W Number of stocks purchased 191 Indication price Range Buying / Selling Buying / Selling [Stocks] High price 59,119 W 59,119 W~ ~ 52,780 W 128 % -6,357,909 W All selling 2021-04-09 3 months Current stock price Evaluation Stock price rise probability score Investment opinion Prospective purchase amount 25,900 W Low price 48.8 Normal 10,000,000 W 39.2 47.2 40.8 39.2 38.9 40.4 2020.11.11 2020.12.09 2021.01.11 2021.02.08 2021.03.11 2021.04.08 Stock price rise probability score A Sector 46.2 46.6 48.6 44.3 46.5 47.5 48.8 B Sector 32.1 47.9 32.9 44.3 31.3 33.3 Total average 2021.01.11 2021.02.08 2021.03.11 2021.04.08 Total of increase rate Total score A Sector 1 % 4 % -10 % 5 % 2 % 0 % 47.0 B Sector 33 % -46 % 26 % -42 % 6 % Total average 17 % -16 % -4 % -1 % 4 % 2020.12.09 46 47 49 44 46 48 32 48 33 44 31 33 39 47 41 39 39 40 0 10 20 30 40 50 60 2020.11.11 2020.12.09 2021.01.11 2021.02.08 2021.03.11 2021.04.08 Stock price rise probability score A sector B sector Total average 1% 4% -10% 5% 2% 33% -46% 26% -42% 6% 17% -16% -4% -1% 4% -60% -40% -20% 0% 20% 40% 2020.12.09 2021.01.11 2021.02.08 2021.03.11 2021.04.08 Increase rate of stock price rise A sector B sector Total average daesang
- 3. 정보와 완전 정보 결 투자판단 있습니 위배 무단으 숙지하 Compliance notice ① The information provided by The Algorithm Company Analysis Consulting is obtained through reliable data and information and The Algorithm Company Analysis Program (TACAP), but its accuracy or completeness are not guaranteed. Furthermore, it may change over time.Therefore, we are not legally responsible for the results of the data provided by The Algorithm Company Analysis Consulting because of information errors or omissions. ② The Algorithm Company Analysis Consulting and all the information provided on it site are reference materials for investment decisions and the final responsibility of investment is up to users utilizing this information. ③ The Algorithm Company Analysis Consulting and its site do not do anything that violates the related laws such as discretionary transaction. ④ Users can not reallocate and recycle the information provided by The Algorithm Company Analysis Consulting firm let alone the information provided by its Site. ⑤ Be sure to know about application period of this algorithm analysis report in order to improve its accuracy. Tel : 070 - 4667 - 5009 Email : tacac@tacac.co.kr Homepage : tacac.co.kr Blog : tacac.blog.me SERVICES M&A, IPO, RECOVER, CORPORATE RESTRUCTURING, MANAGEMENT OF TECHNOLOGY, BUSINESS STRATEGY, FAMILY BUSINESS Request : http://tacac.co.kr/?page_id=1374 ① Consulting is o The Algorithm accuracy or com change over tim results of the d Consulting bec ② information pr investment dec up ③ do anything th transaction. ④ The Algorithm information pr ⑤ analysis report