eugene technology 084370 Algorithm Investment Report
•
1 like•210 views

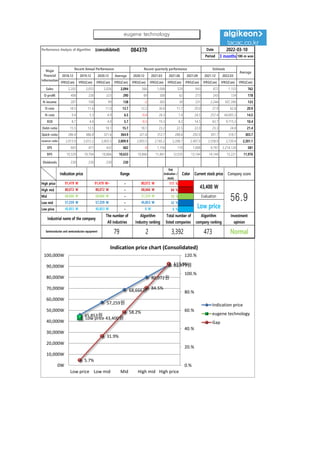
This document provides a performance analysis of an algorithm (consolidated) over several time periods. It includes financial information such as sales, operating profit, net income, debt ratio, and earnings per share. It also evaluates the company's stock price against indication prices of low, mid, and high levels. Additional sections analyze stock price rise probabilities for different sectors and provide investment opinions and prospective purchase amounts.
![[Price for scheduled purchasing]
Arbitrarily made
Algorithm stocks Trading Strategies (consolidated) 084370 Date
Period
Gap
(Indication /
stock)
Color
low price 45,853 W 45,853 W ~ 0 W 6 % -266,789 W -6
Low mid 57,259 W 57,259 W ~ 45,853 W 32 % -1,507,608 W -26
Mid 68,666 W 68,666 W ~ 57,259 W 58 % -2,748,427 W -40
High mid 80,072 W 80,072 W ~ 68,666 W 84 % -3,989,246 W -50
Suggested Purchase
Amount 4,721,128 W
Number of stocks
purchased 109
Indication price Range Buying / Selling Buying / Selling [Stocks]
High price 91,479 W 91,479 W~ ~ 80,072 W 111 % -5,230,065 W All selling
2022-03-10
3 months
Current stock price Evaluation
Stock price rise
probability score
Investment opinion Prospective purchase amount
43,400 W Low price 47.5 Normal 10,000,000 W
38.0 48.9 39.0 34.2 42.3 38.4
2021.10.12 2021.11.09 2021.12.07 2022.01.05 2022.02.07 2022.03.08
Stock price rise
probability score
A Sector 41.8 46.1 45.4 52.1 50.1 37.6
47.5
B Sector 34.2 51.7 32.5 52.1 34.6 39.2
Total average
2021.12.07 2022.01.05 2022.02.07 2022.03.08
Total of
increase rate
Total score
A Sector 9 % -2 % 13 % -4 % -33 %
-2 % 45.0
B Sector 34 % -59 % 38 % -51 % 12 %
Total average 22 % -25 % -14 % 19 % -10 %
2021.11.09
42
46 45
52 50
38
34
52
33
52
35
39
38
49
39
34
42
38
0
10
20
30
40
50
60
2021.10.12 2021.11.09 2021.12.07 2022.01.05 2022.02.07 2022.03.08
Stock price rise probability score
A sector
B sector
Total average
9%
-2%
13%
-4%
-33%
34%
-59%
38%
-51%
12%
22%
-25%
-14%
19%
-10%
-80%
-60%
-40%
-20%
0%
20%
40%
60%
2021.11.09 2021.12.07 2022.01.05 2022.02.07 2022.03.08
Increase rate of stock price rise
A sector
B sector
Total average
eugene technology](data:image/gif;base64,R0lGODlhAQABAIAAAAAAAP///yH5BAEAAAAALAAAAAABAAEAAAIBRAA7)
Recommended
Recommended
More Related Content
What's hot
What's hot (20)
Similar to eugene technology 084370 Algorithm Investment Report
Similar to eugene technology 084370 Algorithm Investment Report (20)
More from 알고리즘 기업분석 컨설팅-알기컨,algikeon
More from 알고리즘 기업분석 컨설팅-알기컨,algikeon (20)
Recently uploaded
Recently uploaded (8)
eugene technology 084370 Algorithm Investment Report
- 1. Performance Analysis of Algorithm (consolidated) 084370 Date Period 3 months 100-m won 2018.12 2019.12 2020.12 Average 2020.12 2021.03 2021.06 2021.09 2021.12 2022.03 IFRS(Con) IFRS(Con) IFRS(Con) IFRS(Con) IFRS(Con) IFRS(Con) IFRS(Con) IFRS(Con) IFRS(Con) IFRS(Con) IFRS(Con) Sales 2,202 2,055 2,026 2,094 566 1,008 529 943 872 1,153 762 O-profit 408 238 223 290 69 308 62 273 243 724 178 N-income 207 108 99 138 -2 265 39 231 2,244 507,390 133 O-rate 18.5 11.6 11.0 13.7 12.2 30.6 11.7 29.0 27.9 62.8 20.9 N-rate 9.4 5.3 4.9 6.5 -0.4 26.3 7.4 24.5 257.4 44,005.3 14.5 ROE 8.7 4.4 4.0 5.7 -0.3 19.3 8.2 14.5 63.7 9,715.3 10.4 Debt-ratio 15.5 13.5 18.1 15.7 18.1 23.2 22.5 22.0 23.3 24.8 21.4 Quick-ratio 286.4 486.8 321.6 364.9 321.6 312.7 288.6 292.0 301.7 318.7 303.7 reserve-ratio 2,013.9 2,012.2 2,003.5 2,009.9 2,003.5 2,185.2 2,208.7 2,407.0 2,558.9 2,720.4 2,201.1 EPS 903 471 432 602 -9 1,156 170 1,008 9,791 2,214,124 581 BPS 10,329 10,704 10,866 10,633 10,866 11,861 12,035 13,144 14,144 15,221 11,976 Dividends 230 230 230 230 Major Financial Information Recent Annual Performance Recent quarterly performance Estimate Average 2022-03-10 Gap (Indication / stock) Color High price ~ 111 % High mid ~ 84 % Mid ~ 58 % Low mid ~ 32 % Low price ~ 6 % Normal 45,853 W 45,853 W 0 W Industrial name of the company The number of All industries Algorithm Industry ranking Total number of listed companies Algorithm company ranking Investment opinion Semiconductor and semiconductor equipment 79 2 3,392 473 80,072 W 80,072 W 68,666 W 68,666 W 68,666 W 57,259 W Evaluation 91,479 W 91,479 W~ 80,072 W 43,400 W 56.9 57,259 W 57,259 W 45,853 W Low price Indication price Range Current stock price Company score 45,853원 57,259원 68,666원 80,072원 91,479원 Low price 43,400원 5.7% 31.9% 58.2% 84.5% 110.8% 0.% 20.% 40.% 60.% 80.% 100.% 120.% 0W 10,000W 20,000W 30,000W 40,000W 50,000W 60,000W 70,000W 80,000W 90,000W 100,000W Low price Low mid Mid High mid High price Indication price chart (Consolidated) Indication price eugene technology Gap eugene technology
- 2. [Price for scheduled purchasing] Arbitrarily made Algorithm stocks Trading Strategies (consolidated) 084370 Date Period Gap (Indication / stock) Color low price 45,853 W 45,853 W ~ 0 W 6 % -266,789 W -6 Low mid 57,259 W 57,259 W ~ 45,853 W 32 % -1,507,608 W -26 Mid 68,666 W 68,666 W ~ 57,259 W 58 % -2,748,427 W -40 High mid 80,072 W 80,072 W ~ 68,666 W 84 % -3,989,246 W -50 Suggested Purchase Amount 4,721,128 W Number of stocks purchased 109 Indication price Range Buying / Selling Buying / Selling [Stocks] High price 91,479 W 91,479 W~ ~ 80,072 W 111 % -5,230,065 W All selling 2022-03-10 3 months Current stock price Evaluation Stock price rise probability score Investment opinion Prospective purchase amount 43,400 W Low price 47.5 Normal 10,000,000 W 38.0 48.9 39.0 34.2 42.3 38.4 2021.10.12 2021.11.09 2021.12.07 2022.01.05 2022.02.07 2022.03.08 Stock price rise probability score A Sector 41.8 46.1 45.4 52.1 50.1 37.6 47.5 B Sector 34.2 51.7 32.5 52.1 34.6 39.2 Total average 2021.12.07 2022.01.05 2022.02.07 2022.03.08 Total of increase rate Total score A Sector 9 % -2 % 13 % -4 % -33 % -2 % 45.0 B Sector 34 % -59 % 38 % -51 % 12 % Total average 22 % -25 % -14 % 19 % -10 % 2021.11.09 42 46 45 52 50 38 34 52 33 52 35 39 38 49 39 34 42 38 0 10 20 30 40 50 60 2021.10.12 2021.11.09 2021.12.07 2022.01.05 2022.02.07 2022.03.08 Stock price rise probability score A sector B sector Total average 9% -2% 13% -4% -33% 34% -59% 38% -51% 12% 22% -25% -14% 19% -10% -80% -60% -40% -20% 0% 20% 40% 60% 2021.11.09 2021.12.07 2022.01.05 2022.02.07 2022.03.08 Increase rate of stock price rise A sector B sector Total average eugene technology
- 3. 정보와 완전 정보 결 투자판단 있습니 위배 무단으 숙지하 Compliance notice ① The information provided by The Algorithm Company Analysis Consulting is obtained through reliable data and information and The Algorithm Company Analysis Program (TACAP), but its accuracy or completeness are not guaranteed. Furthermore, it may change over time.Therefore, we are not legally responsible for the results of the data provided by The Algorithm Company Analysis Consulting because of information errors or omissions. ② The Algorithm Company Analysis Consulting and all the information provided on it site are reference materials for investment decisions and the final responsibility of investment is up to users utilizing this information. ③ The Algorithm Company Analysis Consulting and its site do not do anything that violates the related laws such as discretionary transaction. ④ Users can not reallocate and recycle the information provided by The Algorithm Company Analysis Consulting firm let alone the information provided by its Site. ⑤ Be sure to know about application period of this algorithm analysis report in order to improve its accuracy. Tel : 070 - 4667 - 5009 Email : tacac@tacac.co.kr Homepage : tacac.co.kr Blog : tacac.blog.me SERVICES M&A, IPO, RECOVER, CORPORATE RESTRUCTURING, MANAGEMENT OF TECHNOLOGY, BUSINESS STRATEGY, FAMILY BUSINESS Request : http://tacac.co.kr/?page_id=1374 ① Consulting is o The Algorithm accuracy or com change over tim results of the d Consulting bec ② information pr investment dec up ③ do anything th transaction. ④ The Algorithm information pr ⑤ analysis report