samsung sdi 006400 Algorithm Investment Report
•
1 like•230 views

This document provides quarterly financial performance and stock price data for a company over several years. It also includes the company's current stock price, an algorithm's indication of the stock's fair price range, the gap between the current and indication prices, and a suggested investment strategy. Additional sections show the algorithm's historical success rates for different sectors and provide legal disclaimers about the information.
![[Price for scheduled purchasing]
Arbitrarily made
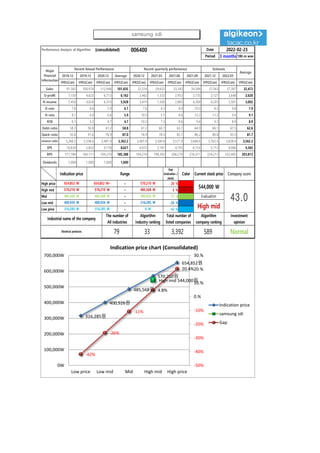
Algorithm stocks Trading Strategies (consolidated) 006400 Date
Period
Gap
(Indication /
stock)
Color
low price 316,285 W 316,285 W ~ 0 W -42 % 458,710 W 1
Low mid 400,926 W 400,926 W ~ 316,285 W -26 % 288,207 W 1
Mid 485,568 W 485,568 W ~ 400,926 W -11 % 117,705 W 0
High mid 570,210 W 570,210 W ~ 485,568 W 5 % -52,797 W -0
Suggested Purchase
Amount 1,095,834 W
Number of stocks
purchased 2
Indication price Range Buying / Selling Buying / Selling [Stocks]
High price 654,852 W 654,852 W~ ~ 570,210 W 20 % -223,300 W -0
2022-02-23
3 months
Current stock price Evaluation
Stock price rise
probability score
Investment opinion Prospective purchase amount
544,000 W High mid 47.9 Normal 3,000,000 W
41.0 45.0 44.3 59.2 41.0 42.0
2021.09.27 2021.10.27 2021.11.24 2021.12.22 2022.01.20 2022.02.22
Stock price rise
probability score
A Sector 46.6 50.9 42.7 43.7 51.5 48.2
47.9
B Sector 35.4 39.2 45.8 43.7 30.4 35.8
Total average
2021.11.24 2021.12.22 2022.01.20 2022.02.22
Total of
increase rate
Total score
A Sector 8 % -19 % 2 % 15 % -7 %
-2 % 47.3
B Sector 10 % 15 % -5 % -44 % 15 %
Total average 9 % -2 % 25 % -44 % 2 %
2021.10.27
47
51
43 44
51
48
35
39
46 44
30
36
41
45 44
59
41 42
0
10
20
30
40
50
60
70
2021.09.27 2021.10.27 2021.11.24 2021.12.22 2022.01.20 2022.02.22
Stock price rise probability score
A sector
B sector
Total average
8%
-19%
2%
15%
-7%
10%
15%
-5%
-44%
15%
9%
-2%
25%
-44%
2%
-50%
-40%
-30%
-20%
-10%
0%
10%
20%
30%
2021.10.27 2021.11.24 2021.12.22 2022.01.20 2022.02.22
Increase rate of stock price rise
A sector
B sector
Total average
samsung sdi](data:image/gif;base64,R0lGODlhAQABAIAAAAAAAP///yH5BAEAAAAALAAAAAABAAEAAAIBRAA7)
Recommended
Recommended
More Related Content
What's hot
What's hot (20)
Similar to samsung sdi 006400 Algorithm Investment Report
Similar to samsung sdi 006400 Algorithm Investment Report (20)
More from 알고리즘 기업분석 컨설팅-알기컨,algikeon
More from 알고리즘 기업분석 컨설팅-알기컨,algikeon (20)
Recently uploaded
Recently uploaded (8)
samsung sdi 006400 Algorithm Investment Report
- 1. Performance Analysis of Algorithm (consolidated) 006400 Date Period 3 months 100-m won 2018.12 2019.12 2020.12 Average 2020.12 2021.03 2021.06 2021.09 2021.12 2022.03 IFRS(Con) IFRS(Con) IFRS(Con) IFRS(Con) IFRS(Con) IFRS(Con) IFRS(Con) IFRS(Con) IFRS(Con) IFRS(Con) IFRS(Con) Sales 91,583 100,974 112,948 101,835 32,514 29,632 33,343 34,398 37,563 37,387 32,472 O-profit 7,150 4,622 6,713 6,162 2,462 1,332 2,952 3,735 3,127 3,648 2,620 N-income 7,450 4,024 6,310 5,928 3,419 1,500 2,883 4,204 4,203 3,501 3,002 O-rate 7.8 4.6 5.9 6.1 7.6 4.5 8.9 10.9 8.3 9.8 7.9 N-rate 8.1 4.0 5.6 5.9 10.5 5.1 8.6 12.2 11.2 9.4 9.1 ROE 6.1 3.2 4.7 4.7 10.2 7.3 8.6 9.4 9.3 8.9 8.9 Debt-ratio 58.3 56.8 61.2 58.8 61.2 60.7 63.7 64.9 66.1 67.5 62.6 Quick-ratio 92.6 91.6 76.9 87.0 76.9 78.3 85.7 86.2 89.8 93.5 81.7 reserve-ratio 3,266.2 3,338.6 3,481.9 3,362.2 3,481.9 3,500.8 3,577.9 3,688.6 3,762.4 3,838.4 3,562.3 EPS 10,834 5,852 9,176 8,621 4,972 2,181 4,193 6,114 5,712 4,966 4,365 BPS 177,784 184,111 194,270 185,388 194,270 198,392 206,279 216,311 224,213 232,405 203,813 Dividends 1,000 1,000 1,000 1,000 Major Financial Information Recent Annual Performance Recent quarterly performance Estimate Average 2022-02-23 Gap (Indication / stock) Color High price ~ 20 % High mid ~ 5 % Mid ~ -11 % Low mid ~ -26 % Low price ~ -42 % Normal 316,285 W 316,285 W 0 W Industrial name of the company The number of All industries Algorithm Industry ranking Total number of listed companies Algorithm company ranking Investment opinion Electrical products 79 33 3,392 589 570,210 W 570,210 W 485,568 W 485,568 W 485,568 W 400,926 W Evaluation 654,852 W 654,852 W~ 570,210 W 544,000 W 43.0 400,926 W 400,926 W 316,285 W High mid Indication price Range Current stock price Company score 316,285원 400,926원 485,568원 570,210원 654,852원 High mid 544,000원 -42% -26% -11% 4.8% 20.4% -50% -40% -30% -20% -10% 0.% 10.% 20.% 30.% 0W 100,000W 200,000W 300,000W 400,000W 500,000W 600,000W 700,000W Low price Low mid Mid High mid High price Indication price chart (Consolidated) Indication price samsung sdi Gap samsung sdi
- 2. [Price for scheduled purchasing] Arbitrarily made Algorithm stocks Trading Strategies (consolidated) 006400 Date Period Gap (Indication / stock) Color low price 316,285 W 316,285 W ~ 0 W -42 % 458,710 W 1 Low mid 400,926 W 400,926 W ~ 316,285 W -26 % 288,207 W 1 Mid 485,568 W 485,568 W ~ 400,926 W -11 % 117,705 W 0 High mid 570,210 W 570,210 W ~ 485,568 W 5 % -52,797 W -0 Suggested Purchase Amount 1,095,834 W Number of stocks purchased 2 Indication price Range Buying / Selling Buying / Selling [Stocks] High price 654,852 W 654,852 W~ ~ 570,210 W 20 % -223,300 W -0 2022-02-23 3 months Current stock price Evaluation Stock price rise probability score Investment opinion Prospective purchase amount 544,000 W High mid 47.9 Normal 3,000,000 W 41.0 45.0 44.3 59.2 41.0 42.0 2021.09.27 2021.10.27 2021.11.24 2021.12.22 2022.01.20 2022.02.22 Stock price rise probability score A Sector 46.6 50.9 42.7 43.7 51.5 48.2 47.9 B Sector 35.4 39.2 45.8 43.7 30.4 35.8 Total average 2021.11.24 2021.12.22 2022.01.20 2022.02.22 Total of increase rate Total score A Sector 8 % -19 % 2 % 15 % -7 % -2 % 47.3 B Sector 10 % 15 % -5 % -44 % 15 % Total average 9 % -2 % 25 % -44 % 2 % 2021.10.27 47 51 43 44 51 48 35 39 46 44 30 36 41 45 44 59 41 42 0 10 20 30 40 50 60 70 2021.09.27 2021.10.27 2021.11.24 2021.12.22 2022.01.20 2022.02.22 Stock price rise probability score A sector B sector Total average 8% -19% 2% 15% -7% 10% 15% -5% -44% 15% 9% -2% 25% -44% 2% -50% -40% -30% -20% -10% 0% 10% 20% 30% 2021.10.27 2021.11.24 2021.12.22 2022.01.20 2022.02.22 Increase rate of stock price rise A sector B sector Total average samsung sdi
- 3. 정보와 완전 정보 결 투자판단 있습니 위배 무단으 숙지하 Compliance notice ① The information provided by The Algorithm Company Analysis Consulting is obtained through reliable data and information and The Algorithm Company Analysis Program (TACAP), but its accuracy or completeness are not guaranteed. Furthermore, it may change over time.Therefore, we are not legally responsible for the results of the data provided by The Algorithm Company Analysis Consulting because of information errors or omissions. ② The Algorithm Company Analysis Consulting and all the information provided on it site are reference materials for investment decisions and the final responsibility of investment is up to users utilizing this information. ③ The Algorithm Company Analysis Consulting and its site do not do anything that violates the related laws such as discretionary transaction. ④ Users can not reallocate and recycle the information provided by The Algorithm Company Analysis Consulting firm let alone the information provided by its Site. ⑤ Be sure to know about application period of this algorithm analysis report in order to improve its accuracy. Tel : 070 - 4667 - 5009 Email : tacac@tacac.co.kr Homepage : tacac.co.kr Blog : tacac.blog.me SERVICES M&A, IPO, RECOVER, CORPORATE RESTRUCTURING, MANAGEMENT OF TECHNOLOGY, BUSINESS STRATEGY, FAMILY BUSINESS Request : http://tacac.co.kr/?page_id=1374 ① Consulting is o The Algorithm accuracy or com change over tim results of the d Consulting bec ② information pr investment dec up ③ do anything th transaction. ④ The Algorithm information pr ⑤ analysis report