ecoprobm 247540 Algorithm Investment Report
•
1 like•132 views

This document provides a performance analysis and stock price evaluation for a company called Algorithm. It includes consolidated financial information over several quarters and years that shows trends in sales, profits, debt levels, and other metrics. The document also evaluates Algorithm's current stock price compared to an indication price range derived from the analysis, and provides a stock purchasing strategy based on buying at different price points within that range.
![[Price for scheduled purchasing]
Arbitrarily made
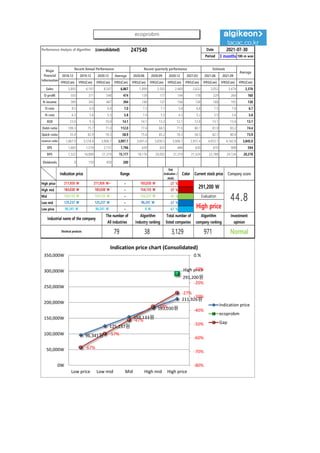
Algorithm stocks Trading Strategies (consolidated) 247540 Date
Period
Gap
(Indication /
stock)
Color
2021-07-30
3 months
Current stock price Evaluation
Stock price rise
probability score
Investment opinion Prospective purchase amount
291,200 W High price 27.1 Normal 3,000,000 W
Suggested Purchase
Amount 833,826 W
Number of stocks
purchased 3
Indication price Range Buying / Selling Buying / Selling [Stocks]
High price 211,926 W 211,926 W~ ~ 183,030 W -27 % 226,995 W 1
High mid 183,030 W 183,030 W ~ 154,133 W -37 % 309,737 W 2
Mid 154,133 W 154,133 W ~ 125,237 W -47 % 392,478 W 3
Low mid 125,237 W 125,237 W ~ 96,341 W -57 % 475,220 W 4
low price 96,341 W 96,341 W ~ 0 W -67 % 557,961 W 6
Stock price rise
probability score
A Sector 46.1 51.0 48.3 50.6 51.1 50.7
27.1
B Sector 35.0 21.3 30.0 50.6 45.8 31.7
Total average
2021.03.09 2021.04.06 2021.05.04 2021.06.03 2021.07.01 2021.07.29
40.6 36.1 39.2 25.4 48.5 41.2
48 % -18 %
2021.04.06 2021.05.04 2021.06.03 2021.07.01 2021.07.29
Total of
increase rate
Total score
A Sector 9 % -5 % 5 % 1 % -1 %
-6 % 44.0
B Sector -65 % 29 % 41 % -10 % -45 %
Total average -12 % 8 % -54 %
46
51 48 51 51 51
35
21
30
51
46
32
41
36
39
25
48
41
0
10
20
30
40
50
60
2021.03.09 2021.04.06 2021.05.04 2021.06.03 2021.07.01 2021.07.29
Stock price rise probability score
A sector
B sector
Total average
9%
-5%
5% 1% -1%
-65%
29%
41%
-10%
-45%
-12%
8%
-54%
48%
-18%
-80%
-60%
-40%
-20%
0%
20%
40%
60%
2021.04.06 2021.05.04 2021.06.03 2021.07.01 2021.07.29
Increase rate of stock price rise
A sector
B sector
Total average
ecoprobm](data:image/gif;base64,R0lGODlhAQABAIAAAAAAAP///yH5BAEAAAAALAAAAAABAAEAAAIBRAA7)
Recommended
Recommended
More Related Content
What's hot
What's hot (20)
Similar to ecoprobm 247540 Algorithm Investment Report
Similar to ecoprobm 247540 Algorithm Investment Report (20)
More from 알고리즘 기업분석 컨설팅-알기컨,algikeon
More from 알고리즘 기업분석 컨설팅-알기컨,algikeon (20)
Recently uploaded
Recently uploaded (8)
ecoprobm 247540 Algorithm Investment Report
- 1. Performance Analysis of Algorithm (consolidated) 247540 Date Period 3 months 100-m won 2018.12 2019.12 2020.12 Average 2020.06 2020.09 2020.12 2021.03 2021.06 2021.09 IFRS(Con) IFRS(Con) IFRS(Con) IFRS(Con) IFRS(Con) IFRS(Con) IFRS(Con) IFRS(Con) IFRS(Con) IFRS(Con) IFRS(Con) Sales 5,892 6,161 8,547 6,867 1,899 2,502 2,469 2,632 3,052 3,474 2,376 O-profit 503 371 548 474 139 177 144 178 229 264 160 N-income 369 345 467 394 140 137 106 138 168 195 130 O-rate 8.5 6.0 6.4 7.0 7.3 7.1 5.8 6.8 7.5 7.6 6.7 N-rate 6.3 5.6 5.5 5.8 7.4 5.5 4.3 5.2 5.5 5.6 5.6 ROE 23.0 9.3 10.0 14.1 14.1 13.2 12.1 12.8 13.1 13.4 13.1 Debt-ratio 189.3 75.7 71.0 112.0 77.4 68.5 71.0 80.7 81.9 83.2 74.4 Quick-ratio 35.4 62.9 78.3 58.9 75.6 85.2 78.3 56.5 62.1 80.4 73.9 reserve-ratio 1,867.9 3,518.4 3,906.7 3,097.7 3,691.4 3,830.5 3,906.7 3,951.4 4,053.1 4,162.8 3,845.0 EPS 1,683 1,574 2,131 1,796 639 625 484 630 870 908 594 BPS 7,322 16,889 21,319 15,177 18,176 20,092 21,319 21,524 22,788 24,126 20,278 Dividends 0 150 450 200 2021-07-30 Major Financial Information Recent Annual Performance Recent quarterly performance Estimate Average Gap (Indication / stock) Color High price ~ -27 % High mid ~ -37 % Mid ~ -47 % Low mid ~ -57 % Low price ~ -67 % Indication price Range Current stock price Company score 183,030 W 183,030 W 154,133 W 154,133 W 154,133 W 125,237 W Evaluation 211,926 W 211,926 W~ 183,030 W 291,200 W 44.8 125,237 W 125,237 W 96,341 W High price Normal 96,341 W 96,341 W 0 W Industrial name of the company The number of All industries Algorithm Industry ranking Total number of listed companies Algorithm company ranking Investment opinion Electrical products 79 38 3,129 971 96,341원 125,237원 154,133원 183,030원 211,926원 High price 291,200원 -67% -57% -47% -37% -27% -80% -70% -60% -50% -40% -30% -20% -10% 0.% 0W 50,000W 100,000W 150,000W 200,000W 250,000W 300,000W 350,000W Low price Low mid Mid High mid High price Indication price chart (Consolidated) Indication price ecoprobm Gap ecoprobm
- 2. [Price for scheduled purchasing] Arbitrarily made Algorithm stocks Trading Strategies (consolidated) 247540 Date Period Gap (Indication / stock) Color 2021-07-30 3 months Current stock price Evaluation Stock price rise probability score Investment opinion Prospective purchase amount 291,200 W High price 27.1 Normal 3,000,000 W Suggested Purchase Amount 833,826 W Number of stocks purchased 3 Indication price Range Buying / Selling Buying / Selling [Stocks] High price 211,926 W 211,926 W~ ~ 183,030 W -27 % 226,995 W 1 High mid 183,030 W 183,030 W ~ 154,133 W -37 % 309,737 W 2 Mid 154,133 W 154,133 W ~ 125,237 W -47 % 392,478 W 3 Low mid 125,237 W 125,237 W ~ 96,341 W -57 % 475,220 W 4 low price 96,341 W 96,341 W ~ 0 W -67 % 557,961 W 6 Stock price rise probability score A Sector 46.1 51.0 48.3 50.6 51.1 50.7 27.1 B Sector 35.0 21.3 30.0 50.6 45.8 31.7 Total average 2021.03.09 2021.04.06 2021.05.04 2021.06.03 2021.07.01 2021.07.29 40.6 36.1 39.2 25.4 48.5 41.2 48 % -18 % 2021.04.06 2021.05.04 2021.06.03 2021.07.01 2021.07.29 Total of increase rate Total score A Sector 9 % -5 % 5 % 1 % -1 % -6 % 44.0 B Sector -65 % 29 % 41 % -10 % -45 % Total average -12 % 8 % -54 % 46 51 48 51 51 51 35 21 30 51 46 32 41 36 39 25 48 41 0 10 20 30 40 50 60 2021.03.09 2021.04.06 2021.05.04 2021.06.03 2021.07.01 2021.07.29 Stock price rise probability score A sector B sector Total average 9% -5% 5% 1% -1% -65% 29% 41% -10% -45% -12% 8% -54% 48% -18% -80% -60% -40% -20% 0% 20% 40% 60% 2021.04.06 2021.05.04 2021.06.03 2021.07.01 2021.07.29 Increase rate of stock price rise A sector B sector Total average ecoprobm
- 3. 정보와 완전 정보 결 투자판단 있습니 위배 무단으 숙지하 Compliance notice ① The information provided by The Algorithm Company Analysis Consulting is obtained through reliable data and information and The Algorithm Company Analysis Program (TACAP), but its accuracy or completeness are not guaranteed. Furthermore, it may change over time.Therefore, we are not legally responsible for the results of the data provided by The Algorithm Company Analysis Consulting because of information errors or omissions. ② The Algorithm Company Analysis Consulting and all the information provided on it site are reference materials for investment decisions and the final responsibility of investment is up to users utilizing this information. ③ The Algorithm Company Analysis Consulting and its site do not do anything that violates the related laws such as discretionary transaction. ④ Users can not reallocate and recycle the information provided by The Algorithm Company Analysis Consulting firm let alone the information provided by its Site. ⑤ Be sure to know about application period of this algorithm analysis report in order to improve its accuracy. Tel : 070 - 4667 - 5009 Email : tacac@tacac.co.kr Homepage : tacac.co.kr Blog : tacac.blog.me SERVICES M&A, IPO, RECOVER, CORPORATE RESTRUCTURING, MANAGEMENT OF TECHNOLOGY, BUSINESS STRATEGY, FAMILY BUSINESS Request : http://tacac.co.kr/?page_id=1374 ① Consulting is o The Algorithm accuracy or com change over tim results of the d Consulting bec ② information pr investment dec up ③ do anything th transaction. ④ The Algorithm information pr ⑤ analysis report