nibec 138610 Algorithm Investment Report
•
1 like•167 views

nibec 138610 Algorithm Investment Report
![[Price for scheduled purchasing]
Arbitrarily made
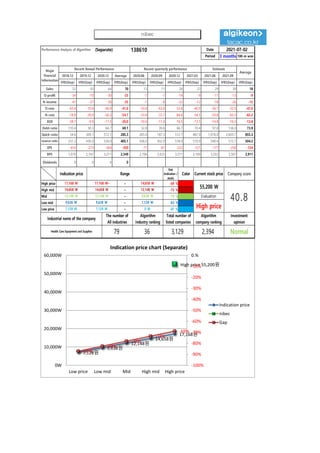
Algorithm stocks Trading Strategies (Separate) 138610 Date
Period
Gap
(Indication /
stock)
Color
2021-07-02
3 months
Current stock price Evaluation
Stock price rise
probability score
Investment opinion Prospective purchase amount
55,200 W High price 42.7 Normal 3,000,000 W
Suggested Purchase
Amount 620,960 W
Number of stocks
purchased 11
Indication price Range Buying / Selling Buying / Selling [Stocks]
High price 17,168 W 17,168 W~ ~ 14,658 W -69 % 427,838 W 25
High mid 14,658 W 14,658 W ~ 12,148 W -73 % 456,071 W 31
Mid 12,148 W 12,148 W ~ 9,638 W -78 % 484,304 W 40
Low mid 9,638 W 9,638 W ~ 7,128 W -83 % 512,537 W 53
low price 7,128 W 7,128 W ~ 0 W -87 % 540,770 W 76
2021.02.04 2021.03.09 2021.04.06 2021.05.04 2021.06.03 2021.07.01
24.2 47.3 37.2
Stock price rise
probability score
A Sector 43.5 49.0 45.8 48.1 52.5 53.2
42.7
B Sector 28.3 40.0 48.1 48.1 42.1 21.3
Total average 35.9 44.5 48.3
49 % -27 %
2021.03.09 2021.04.06 2021.05.04 2021.06.03 2021.07.01
Total of
increase rate
Total score
A Sector 11 % -7 % 5 % 8 % 1 %
-10 % 47.3
B Sector 29 % 21 % -6 % -14 % -98 %
Total average 19 % 8 % -100 %
11%
-7%
5% 8% 1%
29% 21%
-6% -14%
-98%
19%
8%
-100%
49%
-27%
-150%
-100%
-50%
0%
50%
100%
2021.03.09 2021.04.06 2021.05.04 2021.06.03 2021.07.01
Increase rate of stock price rise
A sector
B sector
Total average
nibec
44
49
46 48
53 53
28
40
51
48
42
21
36
45
48
24
47
37
0
10
20
30
40
50
60
2021.02.04 2021.03.09 2021.04.06 2021.05.04 2021.06.03 2021.07.01
Stock price rise probability score
A sector
B sector
Total average](data:image/gif;base64,R0lGODlhAQABAIAAAAAAAP///yH5BAEAAAAALAAAAAABAAEAAAIBRAA7)
Recommended
Recommended
More Related Content
What's hot
What's hot (20)
Similar to nibec 138610 Algorithm Investment Report
Similar to nibec 138610 Algorithm Investment Report (20)
More from 알고리즘 기업분석 컨설팅-알기컨,algikeon
More from 알고리즘 기업분석 컨설팅-알기컨,algikeon (20)
Recently uploaded
Recently uploaded (20)
nibec 138610 Algorithm Investment Report
- 1. Performance Analysis of Algorithm (Separate) 138610 Date Period 3 months 100-m won 2018.12 2019.12 2020.12 Average 2020.06 2020.09 2020.12 2021.03 2021.06 2021.09 IFRS(Sep) IFRS(Sep) IFRS(Sep) IFRS(Sep) IFRS(Sep) IFRS(Sep) IFRS(Sep) IFRS(Sep) IFRS(Sep) IFRS(Sep) IFRS(Sep) Sales 52 93 64 70 13 11 26 22 29 39 18 O-profit -34 -10 -30 -25 -7 -7 -14 -9 -11 -13 -9 N-income -41 -27 -36 -35 -7 -8 -22 -12 -18 -26 -12 O-rate -65.4 -10.8 -46.9 -41.0 -53.8 -63.6 -53.8 -40.9 -36.7 -32.9 -47.0 N-rate -78.8 -29.0 -56.3 -54.7 -53.8 -72.7 -84.6 -54.5 -59.8 -65.5 -65.2 ROE -38.7 -9.9 -11.3 -20.0 -10.4 -11.4 -16.5 -13.5 -14.8 -16.3 -13.8 Debt-ratio 110.4 30.3 66.7 69.1 32.8 39.6 66.7 70.4 97.8 136.0 73.9 Quick-ratio 34.6 309.1 512.1 285.3 265.0 187.3 512.1 487.9 1,076.0 2,603.7 855.3 reserve-ratio 231.3 450.0 534.0 405.1 436.0 432.0 534.0 510.0 540.4 572.7 504.2 EPS -414 -273 -364 -350 -71 -81 -222 -121 -177 -258 -124 BPS 1,070 2,767 3,211 2,349 2,706 2,625 3,211 3,100 3,202 3,307 2,911 Dividends 0 0 0 0 2021-07-02 Major Financial Information Recent Annual Performance Recent quarterly performance Estimate Average Gap (Indication / stock) Color High price ~ -69 % High mid ~ -73 % Mid ~ -78 % Low mid ~ -83 % Low price ~ -87 % Indication price Range Current stock price Company score 14,658 W 14,658 W 12,148 W 12,148 W 12,148 W 9,638 W Evaluation 17,168 W 17,168 W~ 14,658 W 55,200 W 40.8 9,638 W 9,638 W 7,128 W High price Normal 7,128 W 7,128 W 0 W Industrial name of the company The number of All industries Algorithm Industry ranking Total number of listed companies Algorithm company ranking Investment opinion Health Care Equipment and Supplies 79 36 3,129 2,394 7,128원 9,638원 12,148원 14,658원 17,168원 High price 55,200원 -87% -83% -78% -73% -69% -100% -90% -80% -70% -60% -50% -40% -30% -20% -10% 0.% 0W 10,000W 20,000W 30,000W 40,000W 50,000W 60,000W Low price Low mid Mid High mid High price Indication price chart (Separate) Indication price nibec Gap nibec
- 2. [Price for scheduled purchasing] Arbitrarily made Algorithm stocks Trading Strategies (Separate) 138610 Date Period Gap (Indication / stock) Color 2021-07-02 3 months Current stock price Evaluation Stock price rise probability score Investment opinion Prospective purchase amount 55,200 W High price 42.7 Normal 3,000,000 W Suggested Purchase Amount 620,960 W Number of stocks purchased 11 Indication price Range Buying / Selling Buying / Selling [Stocks] High price 17,168 W 17,168 W~ ~ 14,658 W -69 % 427,838 W 25 High mid 14,658 W 14,658 W ~ 12,148 W -73 % 456,071 W 31 Mid 12,148 W 12,148 W ~ 9,638 W -78 % 484,304 W 40 Low mid 9,638 W 9,638 W ~ 7,128 W -83 % 512,537 W 53 low price 7,128 W 7,128 W ~ 0 W -87 % 540,770 W 76 2021.02.04 2021.03.09 2021.04.06 2021.05.04 2021.06.03 2021.07.01 24.2 47.3 37.2 Stock price rise probability score A Sector 43.5 49.0 45.8 48.1 52.5 53.2 42.7 B Sector 28.3 40.0 48.1 48.1 42.1 21.3 Total average 35.9 44.5 48.3 49 % -27 % 2021.03.09 2021.04.06 2021.05.04 2021.06.03 2021.07.01 Total of increase rate Total score A Sector 11 % -7 % 5 % 8 % 1 % -10 % 47.3 B Sector 29 % 21 % -6 % -14 % -98 % Total average 19 % 8 % -100 % 11% -7% 5% 8% 1% 29% 21% -6% -14% -98% 19% 8% -100% 49% -27% -150% -100% -50% 0% 50% 100% 2021.03.09 2021.04.06 2021.05.04 2021.06.03 2021.07.01 Increase rate of stock price rise A sector B sector Total average nibec 44 49 46 48 53 53 28 40 51 48 42 21 36 45 48 24 47 37 0 10 20 30 40 50 60 2021.02.04 2021.03.09 2021.04.06 2021.05.04 2021.06.03 2021.07.01 Stock price rise probability score A sector B sector Total average
- 3. may ded by Compliance notice ① The information provided by The Algorithm Company Analysis Consulting is obtained through reliable data and information and The Algorithm Company Analysis Program (TACAP), but its accuracy or completeness are not guaranteed. Furthermore, it may change over time.Therefore, we are not legally responsible for the results of the data provided by The Algorithm Company Analysis Consulting because of information errors or omissions. ② The Algorithm Company Analysis Consulting and all the information provided on it site are reference materials for investment decisions and the final responsibility of investment is up to users utilizing this information. ③ The Algorithm Company Analysis Consulting and its site do not do anything that violates the related laws such as discretionary transaction. ④ Users can not reallocate and recycle the information provided by The Algorithm Company Analysis Consulting firm let alone the information provided by its Site. ⑤ Be sure to know about application period of this algorithm analysis report in order to improve its accuracy. Tel : 070 - 4667 - 5009 Email : tacac@tacac.co.kr Homepage : tacac.co.kr Blog : tacac.blog.me SERVICES M&A, IPO, RECOVER, CORPORATE RESTRUCTURING, MANAGEMENT OF TECHNOLOGY, BUSINESS STRATEGY, FAMILY BUSINESS Request : http://tacac.co.kr/?page_id=1374