


The document presents an overview of Statistical Process Control (SPC) and the foundational concepts of Total Quality Management, focusing on statistical tools like control charts, histograms, and Pareto charts. It details the importance of understanding populations and samples in statistics, as well as key statistical terms such as mean, variance, and normal distribution. The content aims to equip readers with essential statistical knowledge for effective data analysis and decision-making.
Overview of Total Quality Management in EEE; Introduction to Statistical Process Control (SPC).
Discussion on the seven basic tools of quality, including cause-and-effect diagrams, control charts, and Pareto charts.
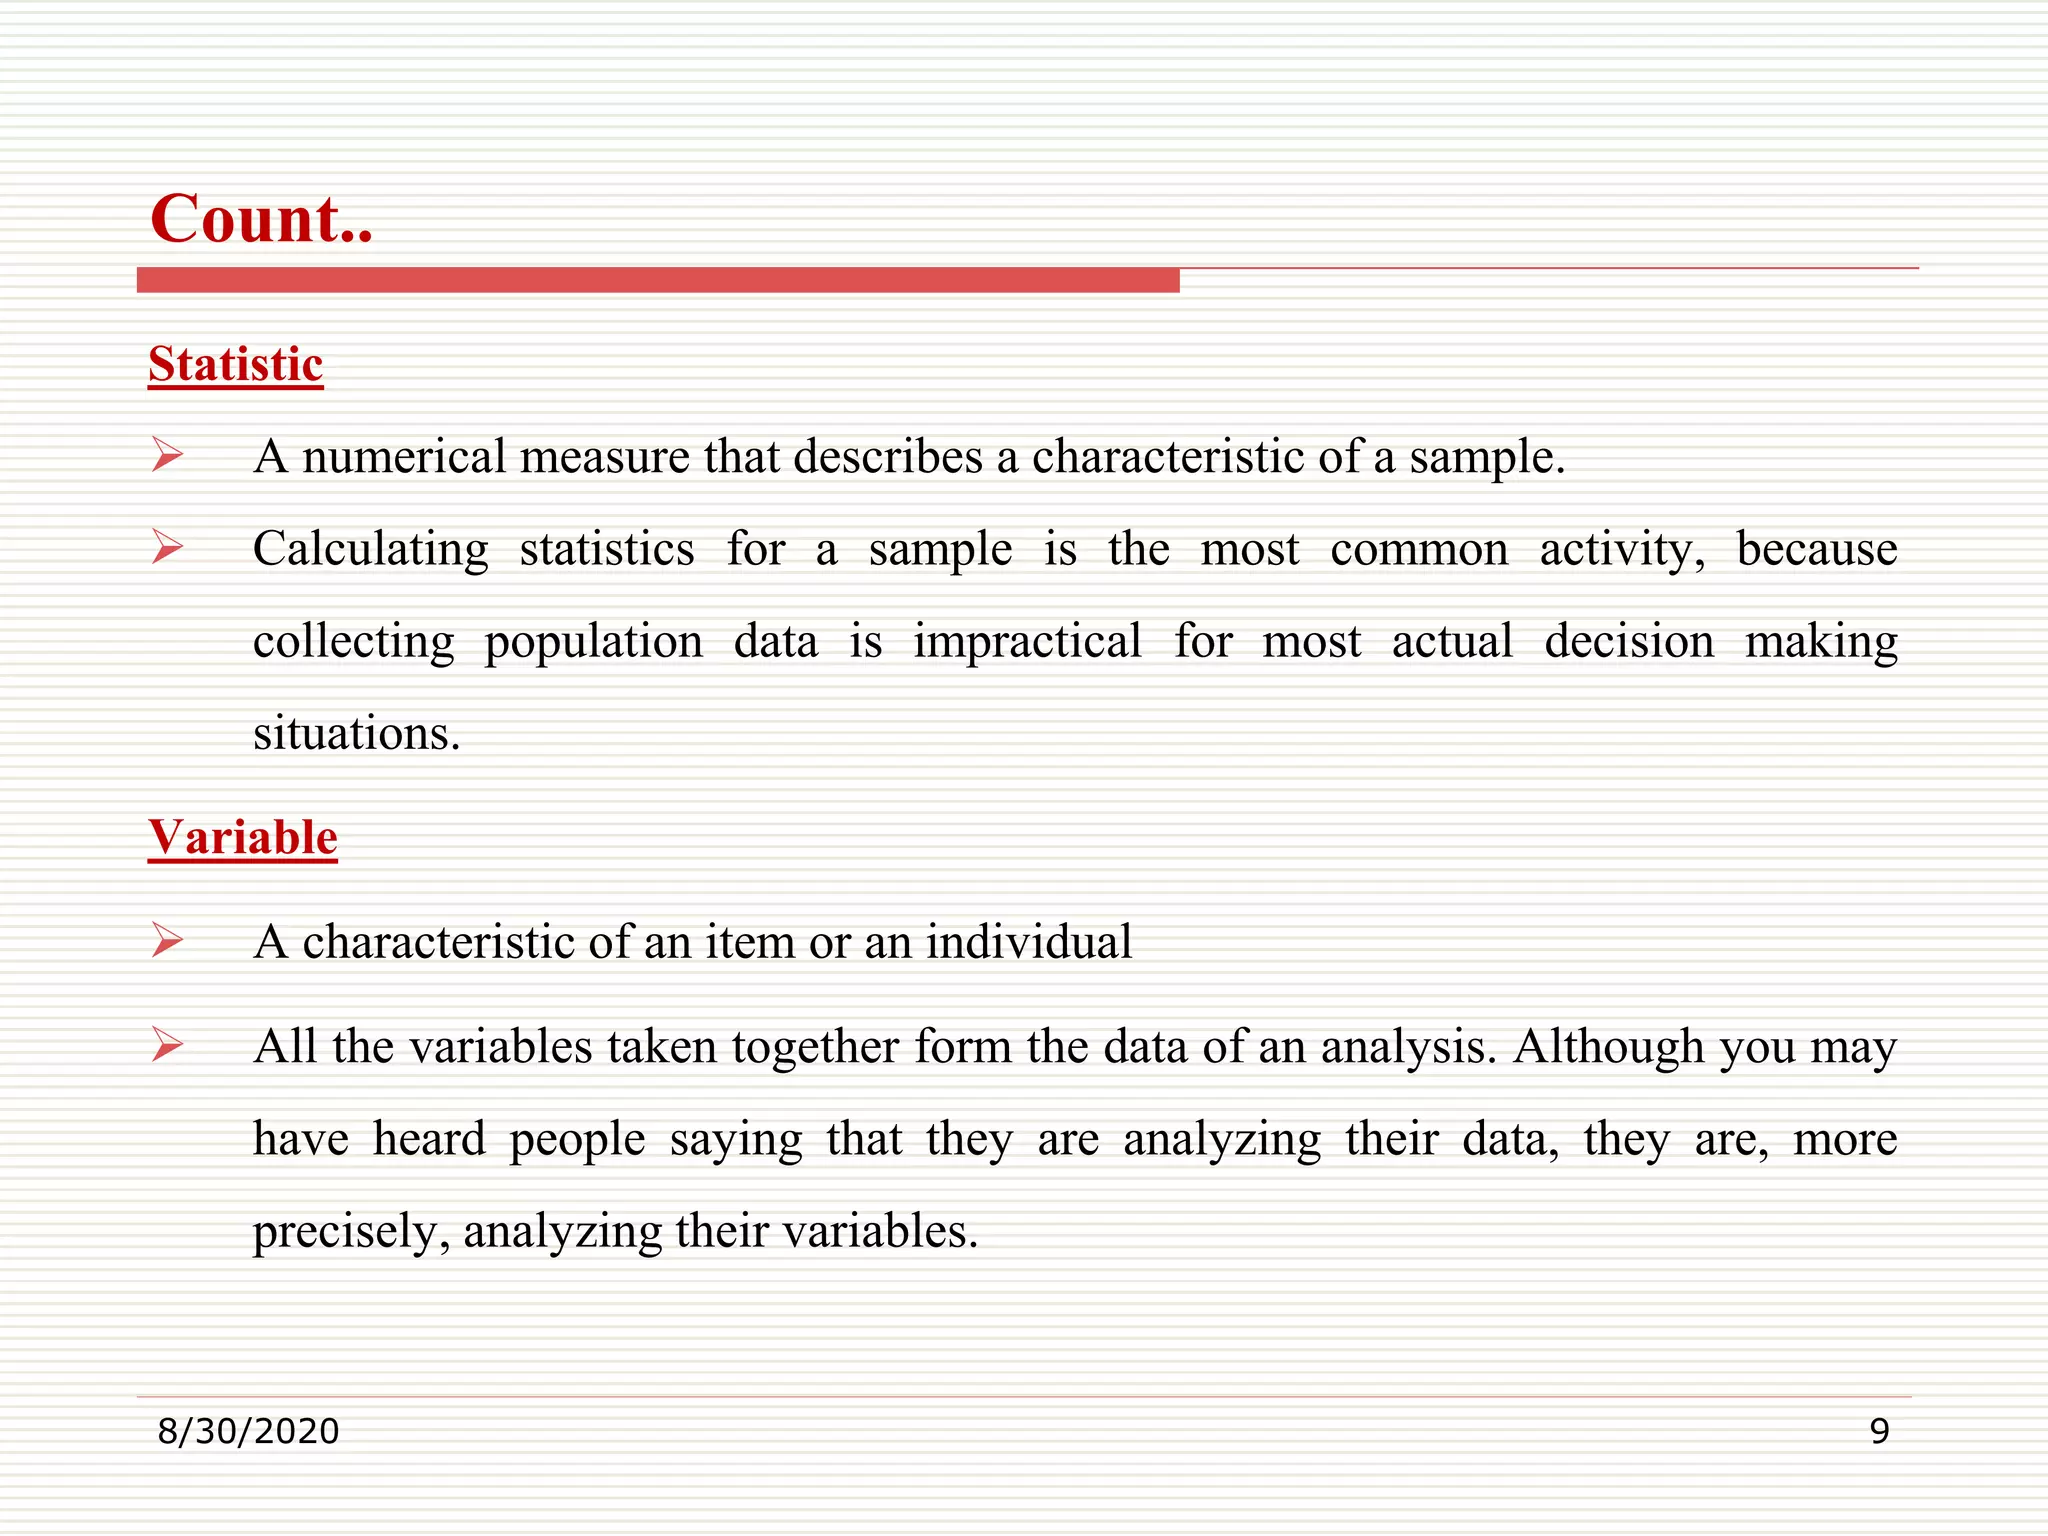
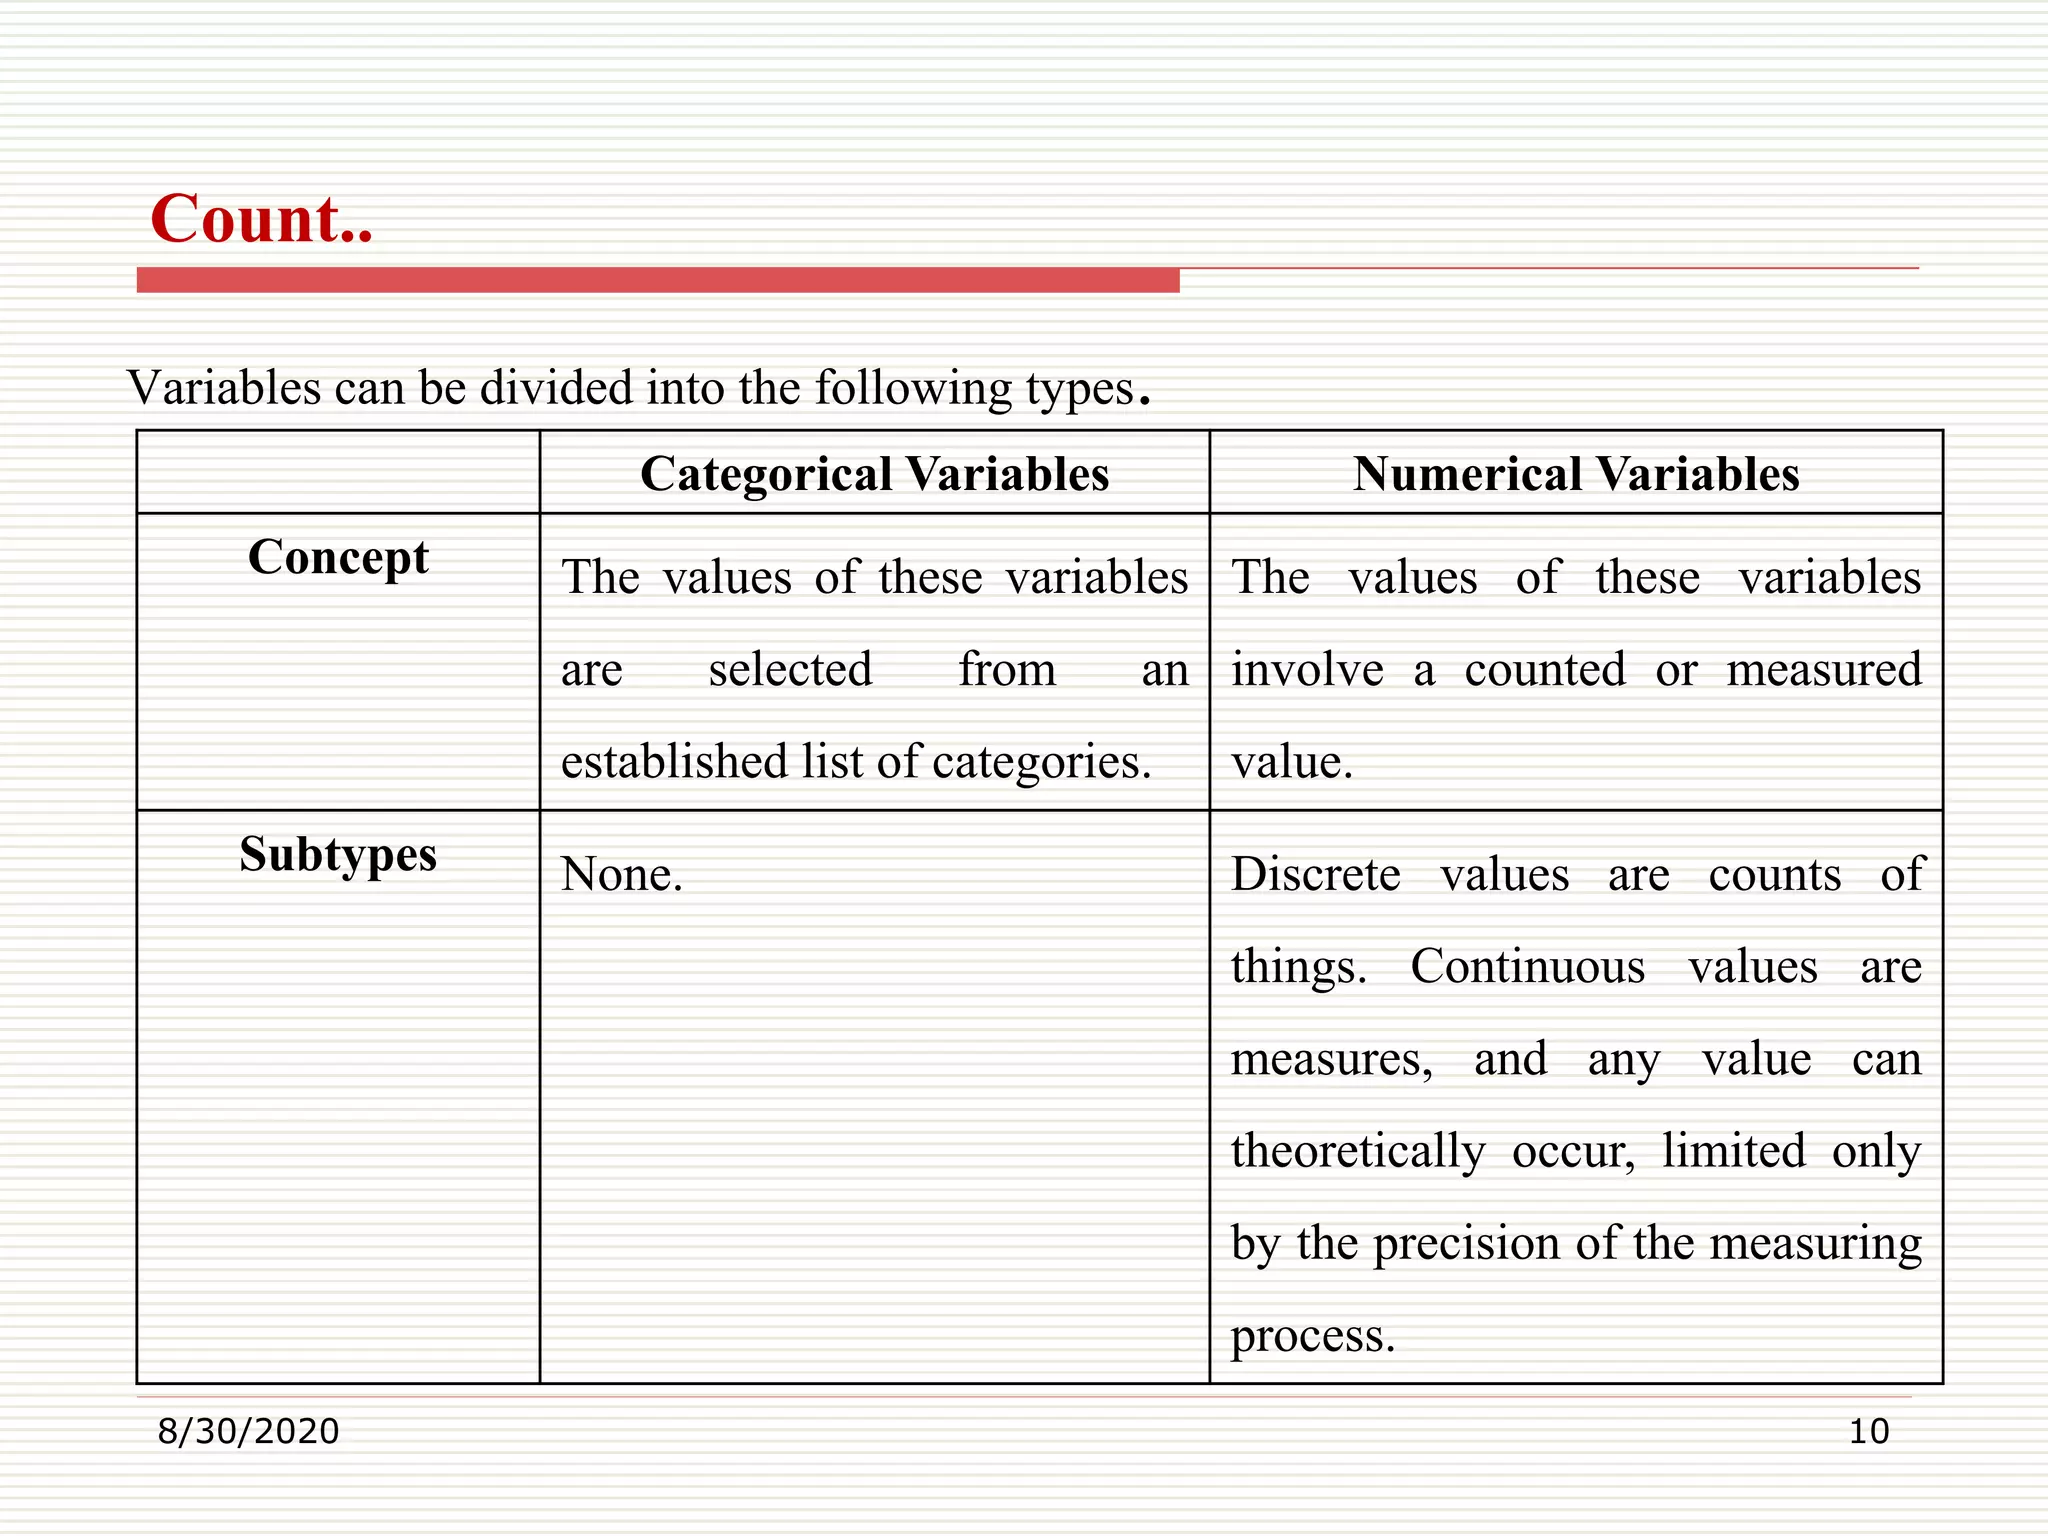
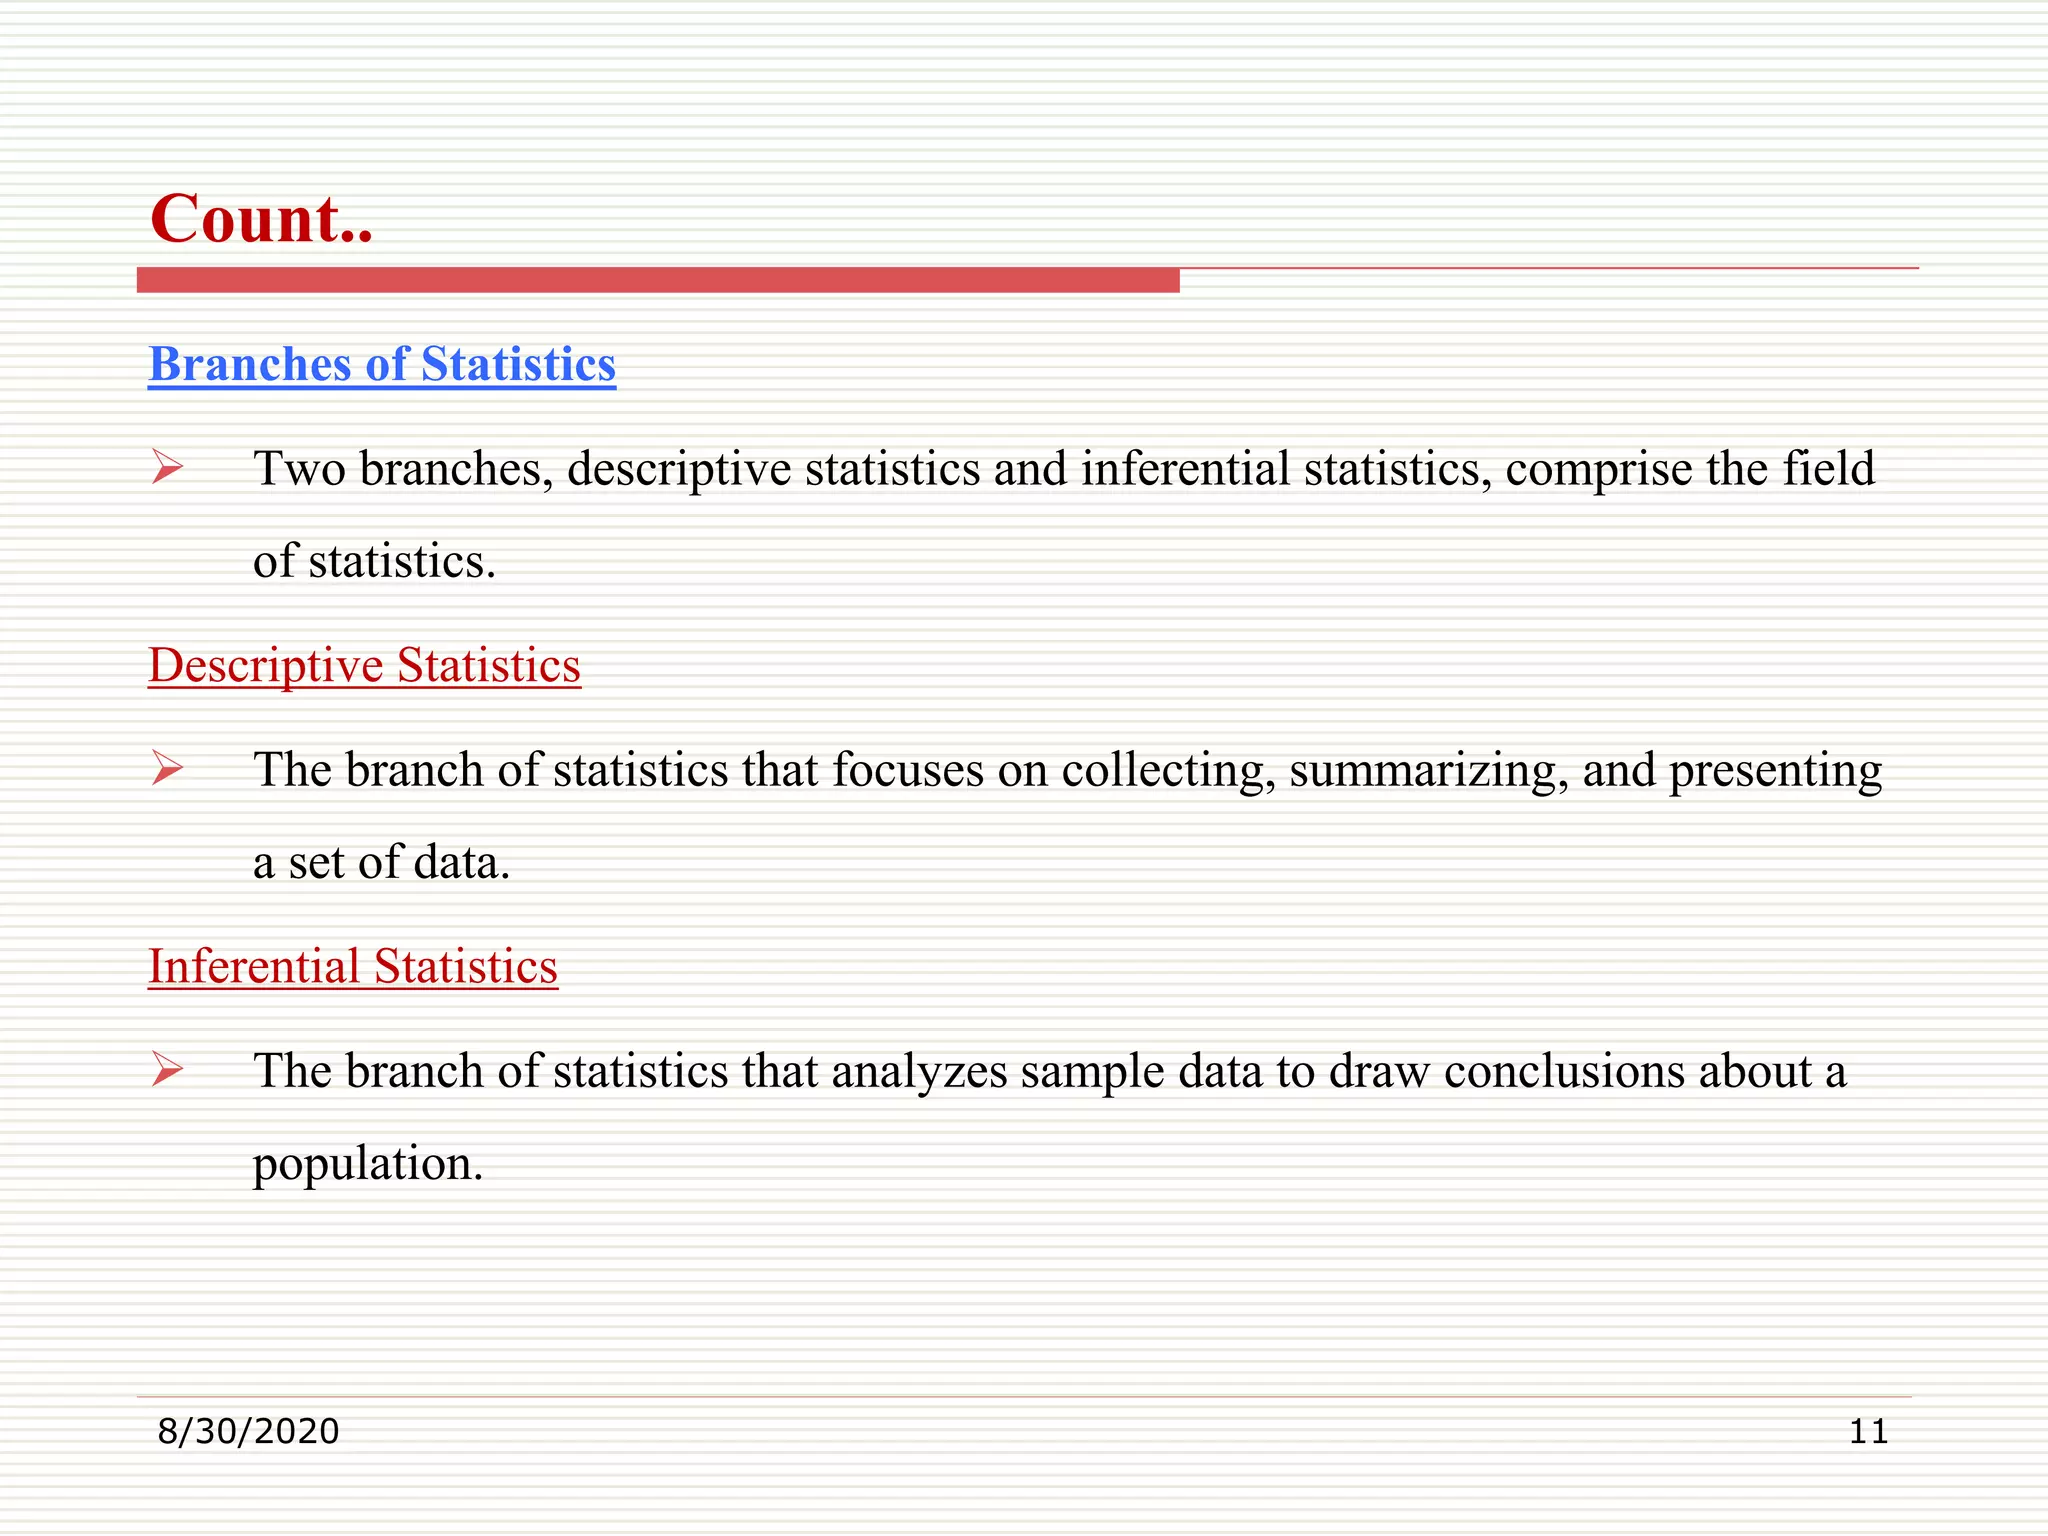
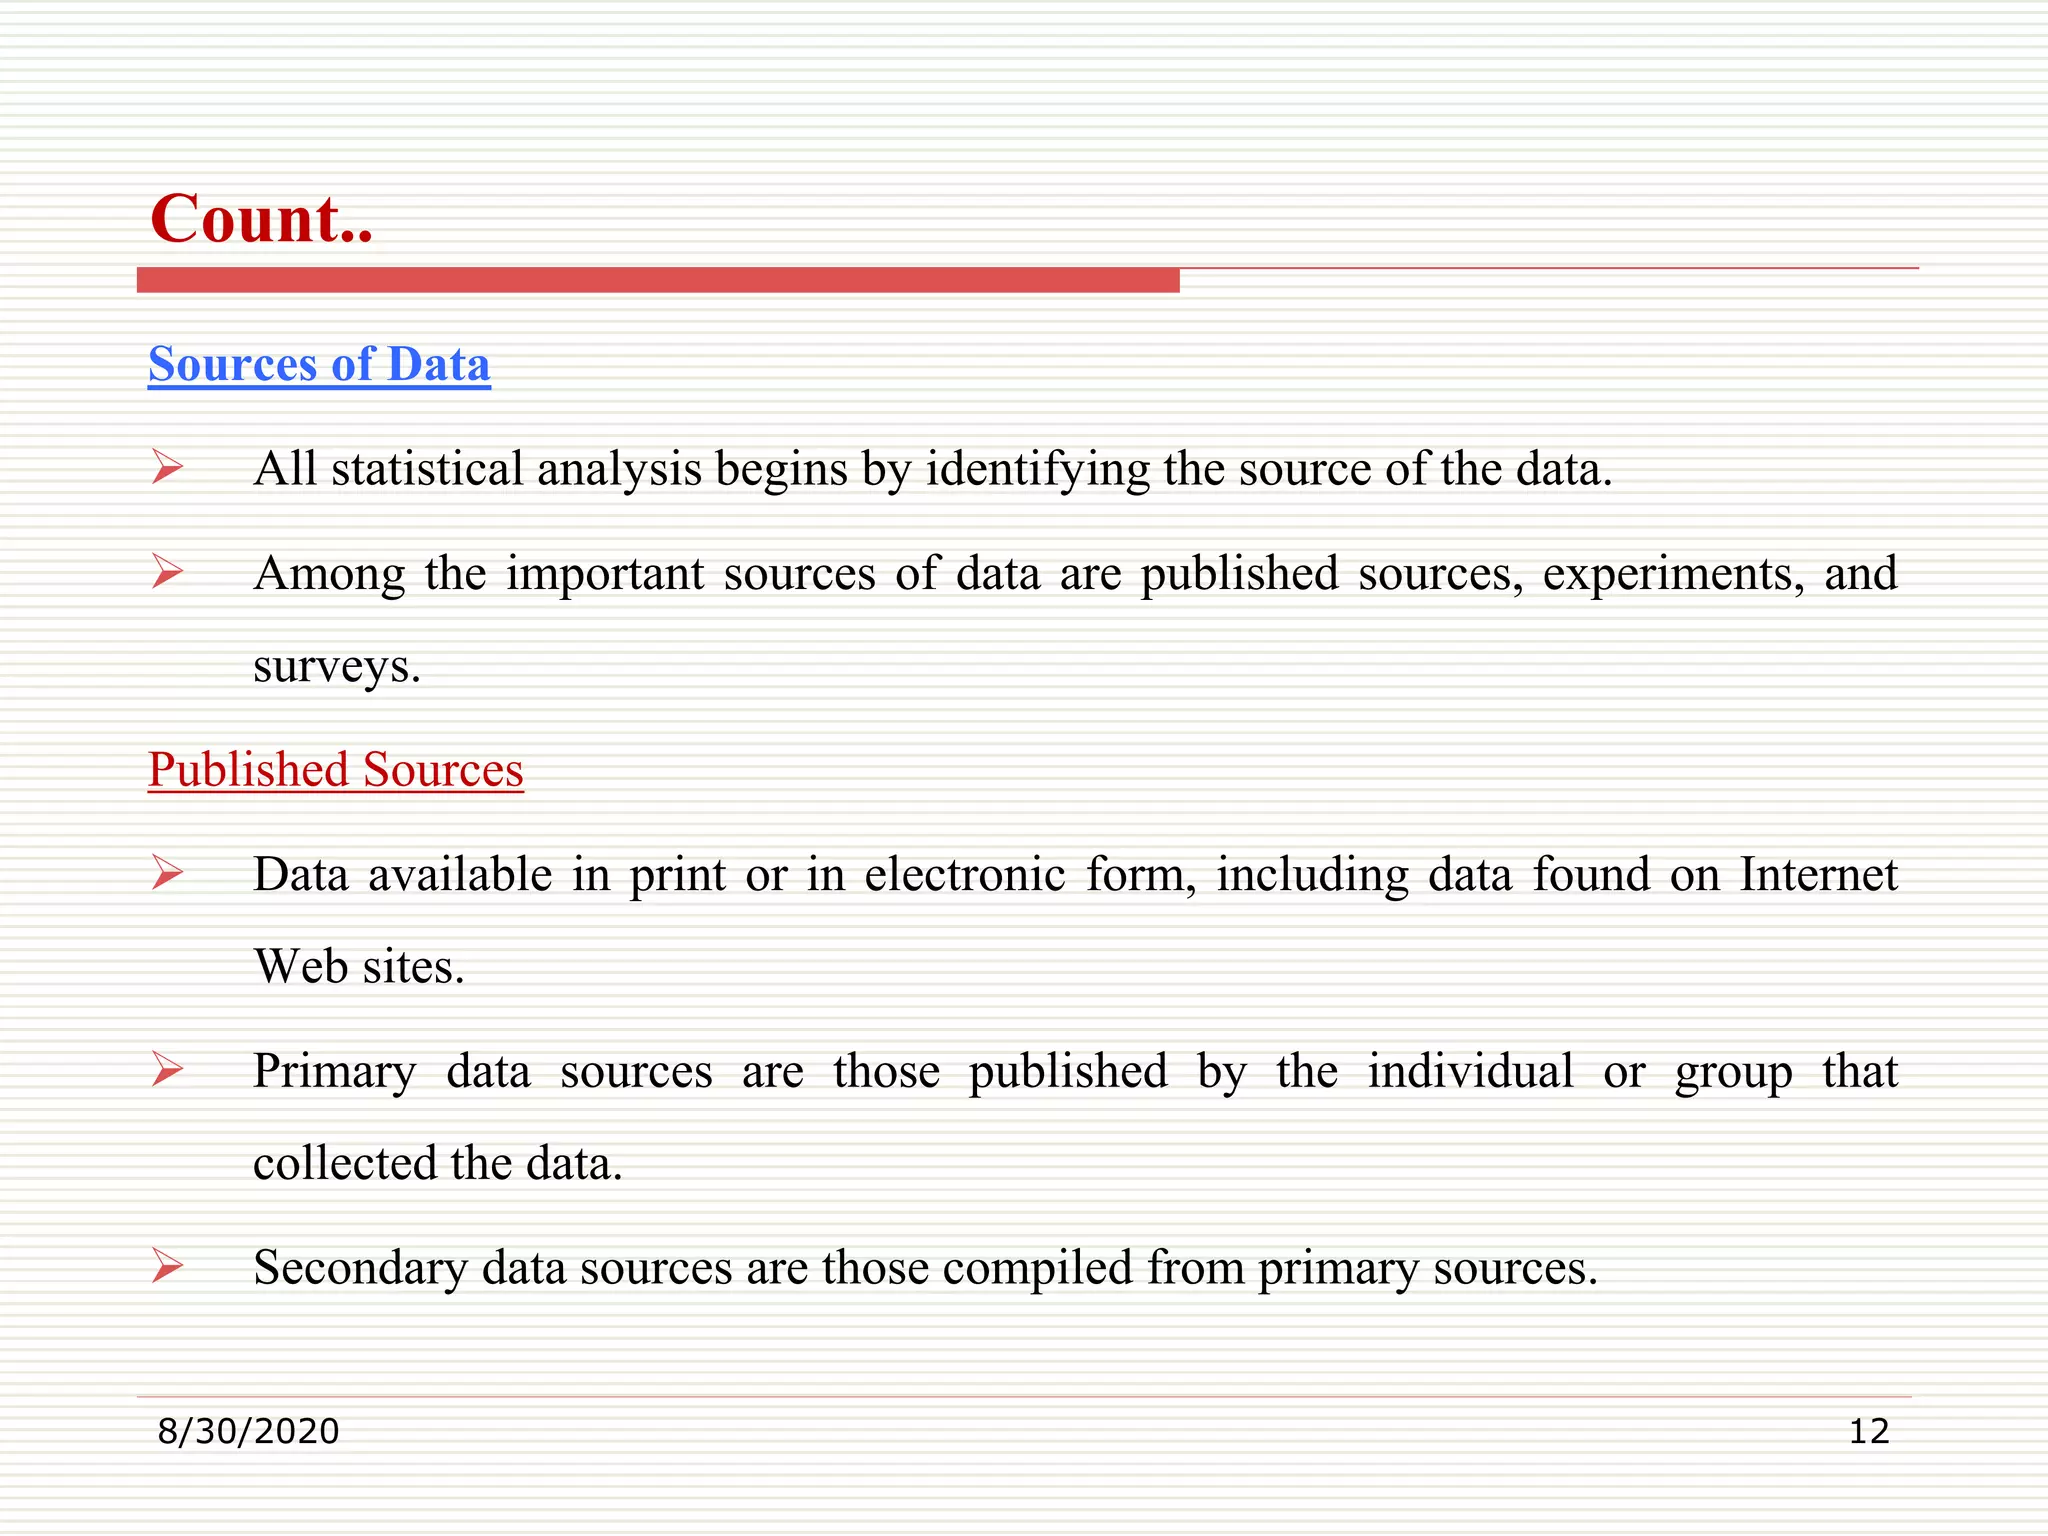
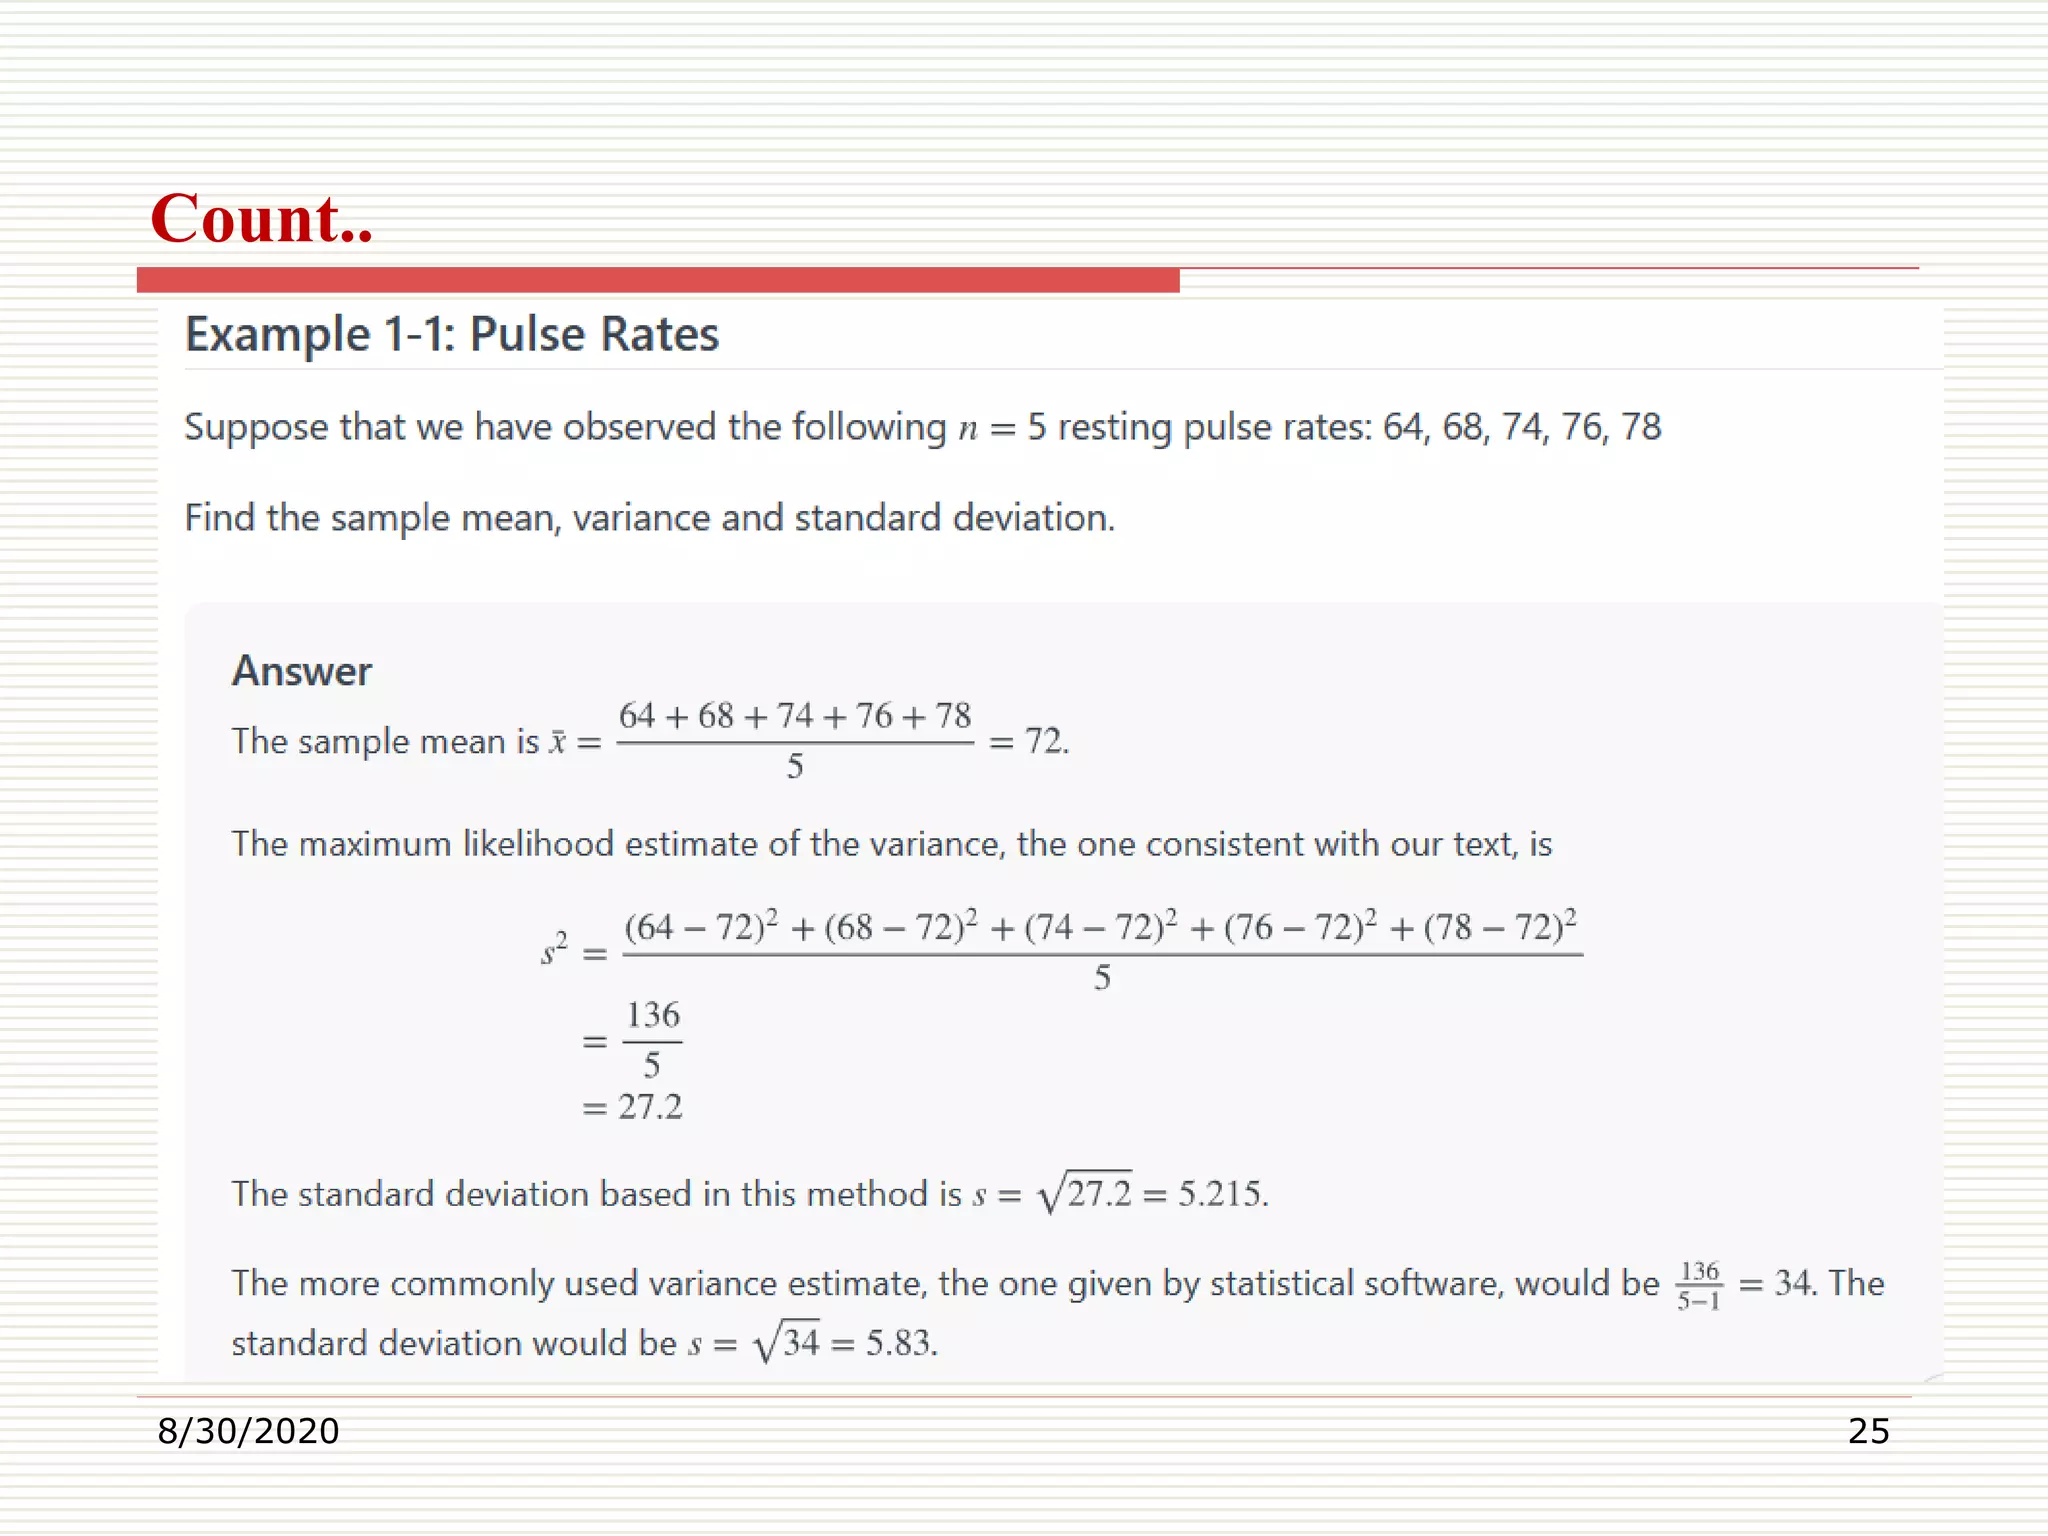
Importance of statistics; examples illustrate its role in decision-making; introduction to statistical vocabulary.
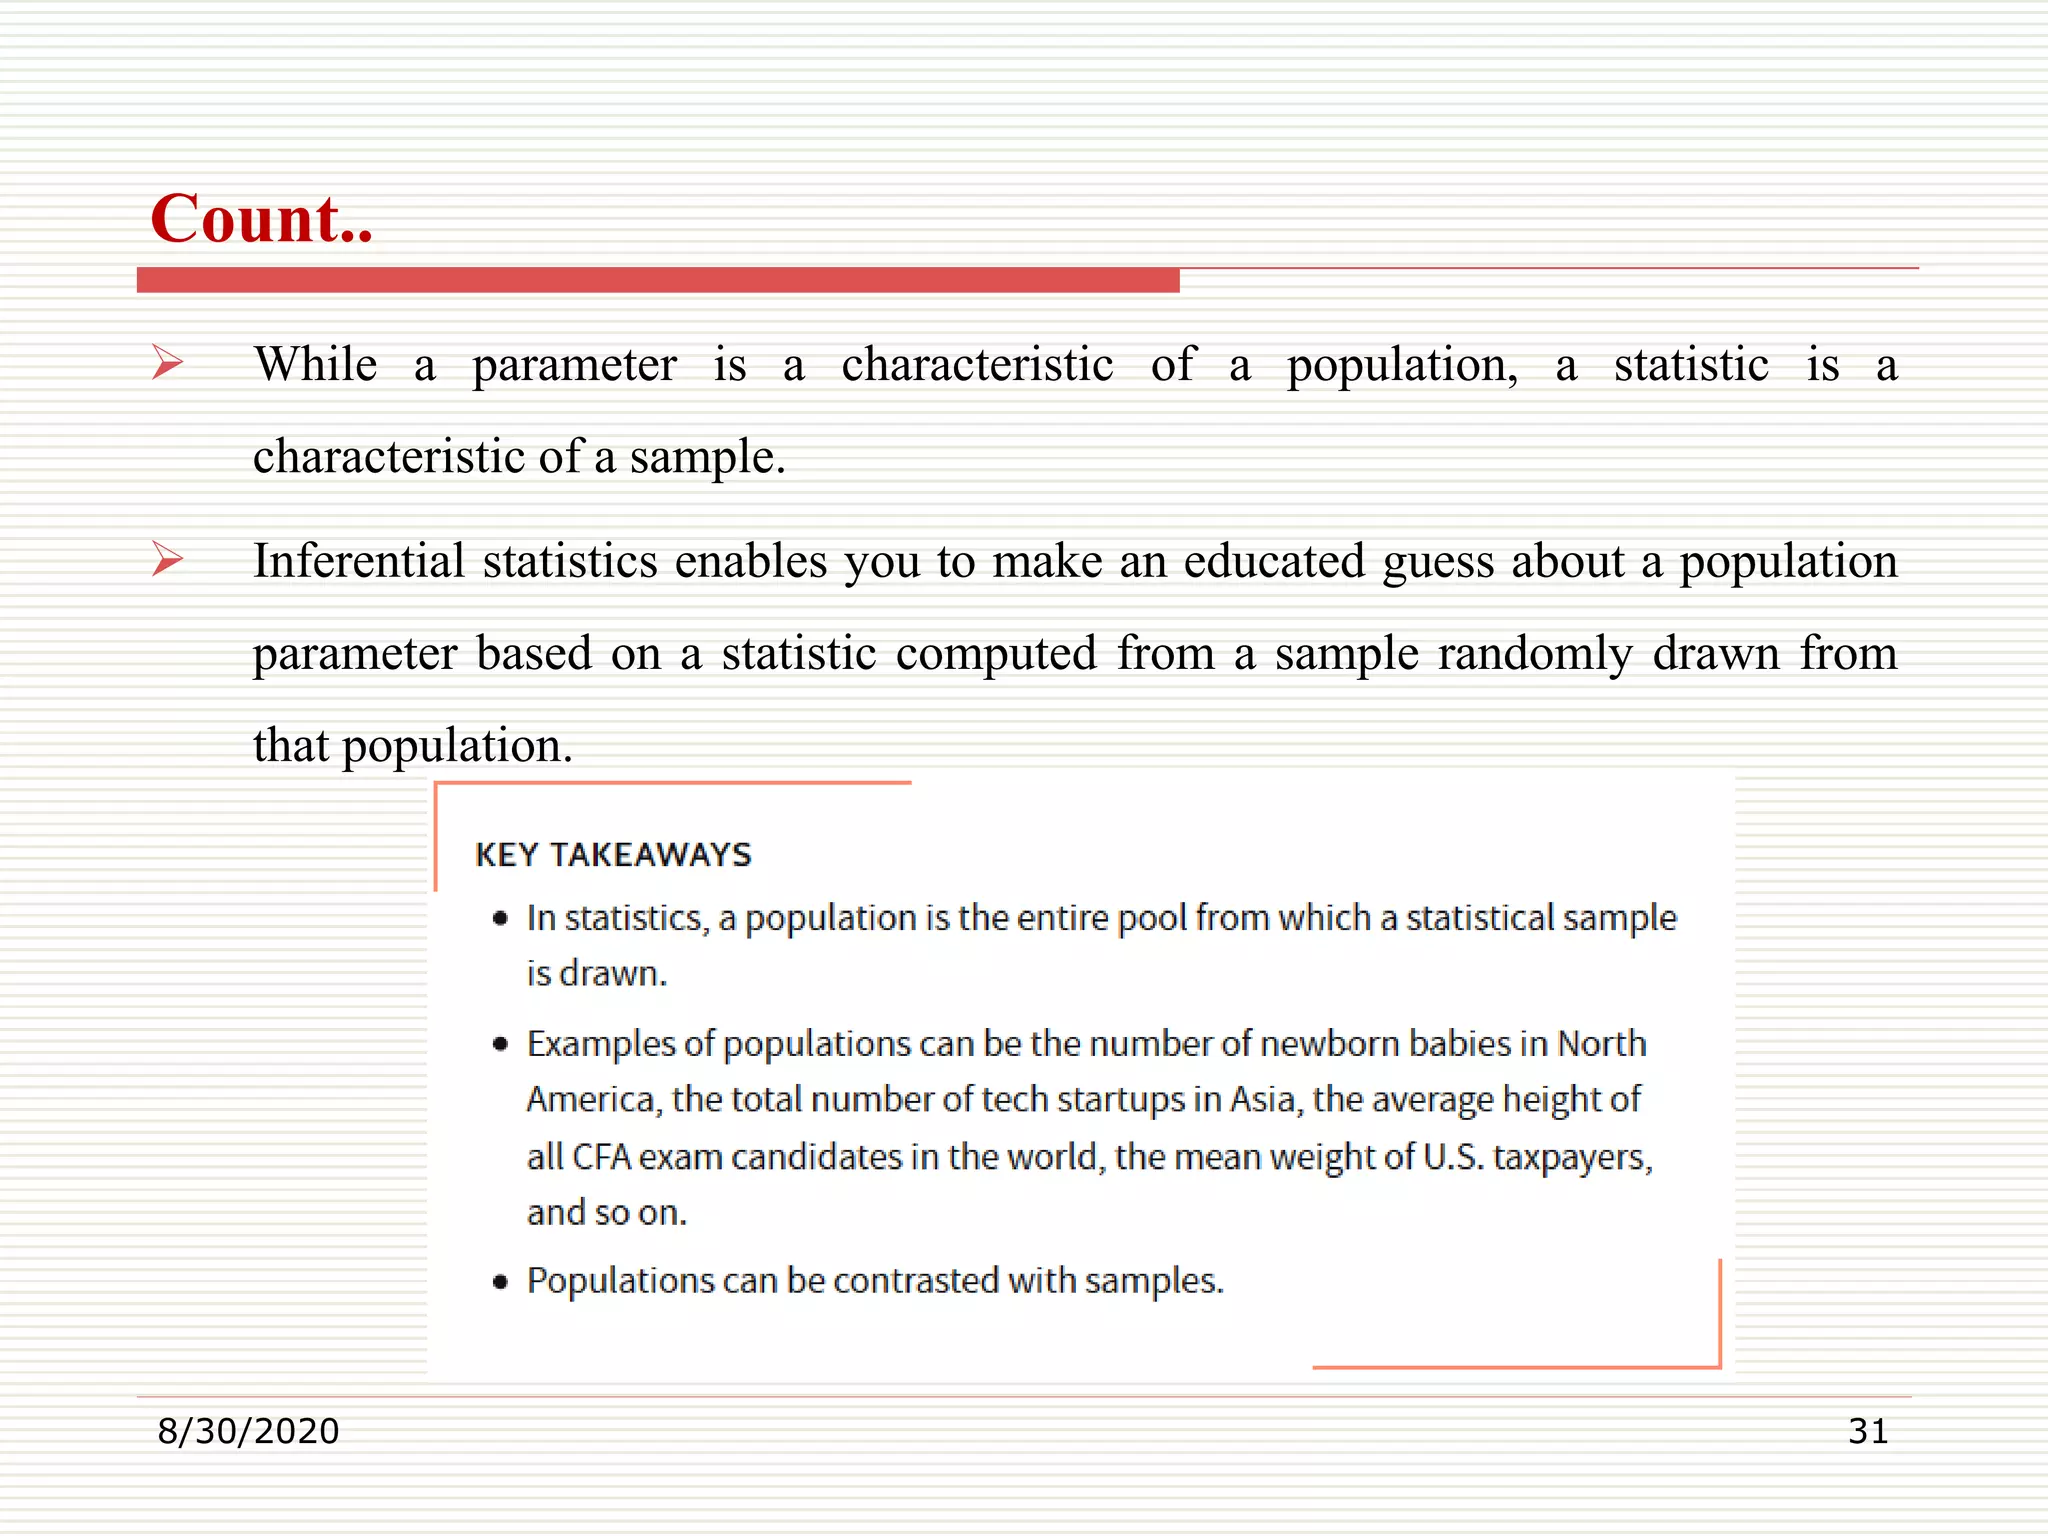
Definitions and characteristics of populations and samples; importance of samples in statistical analysis.
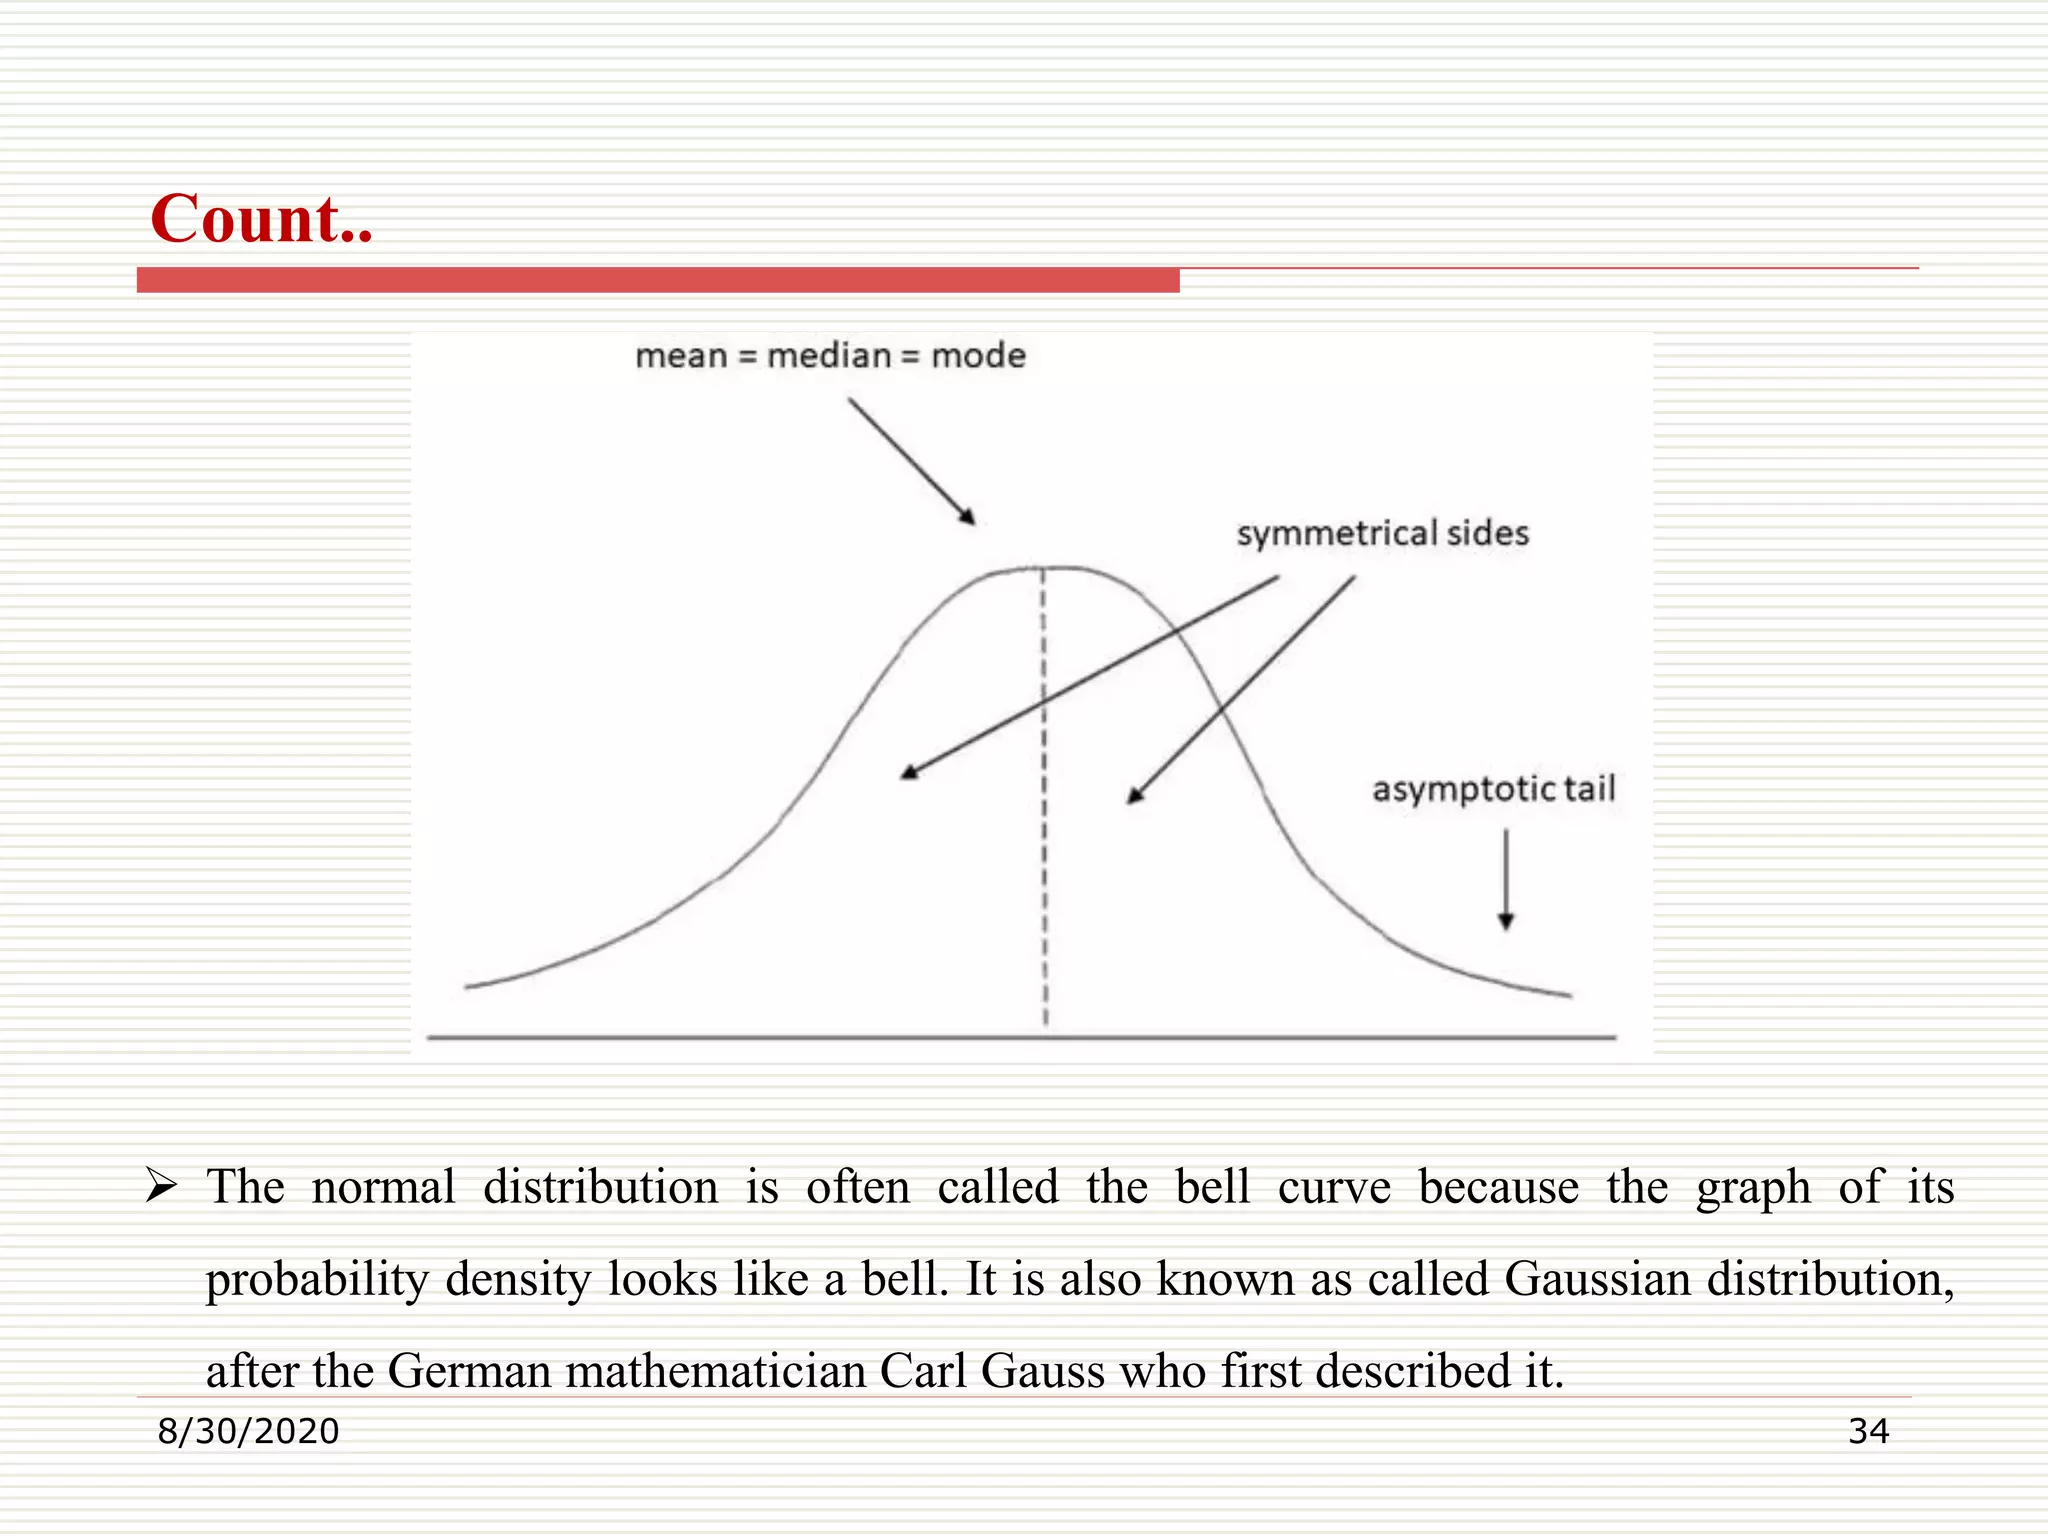
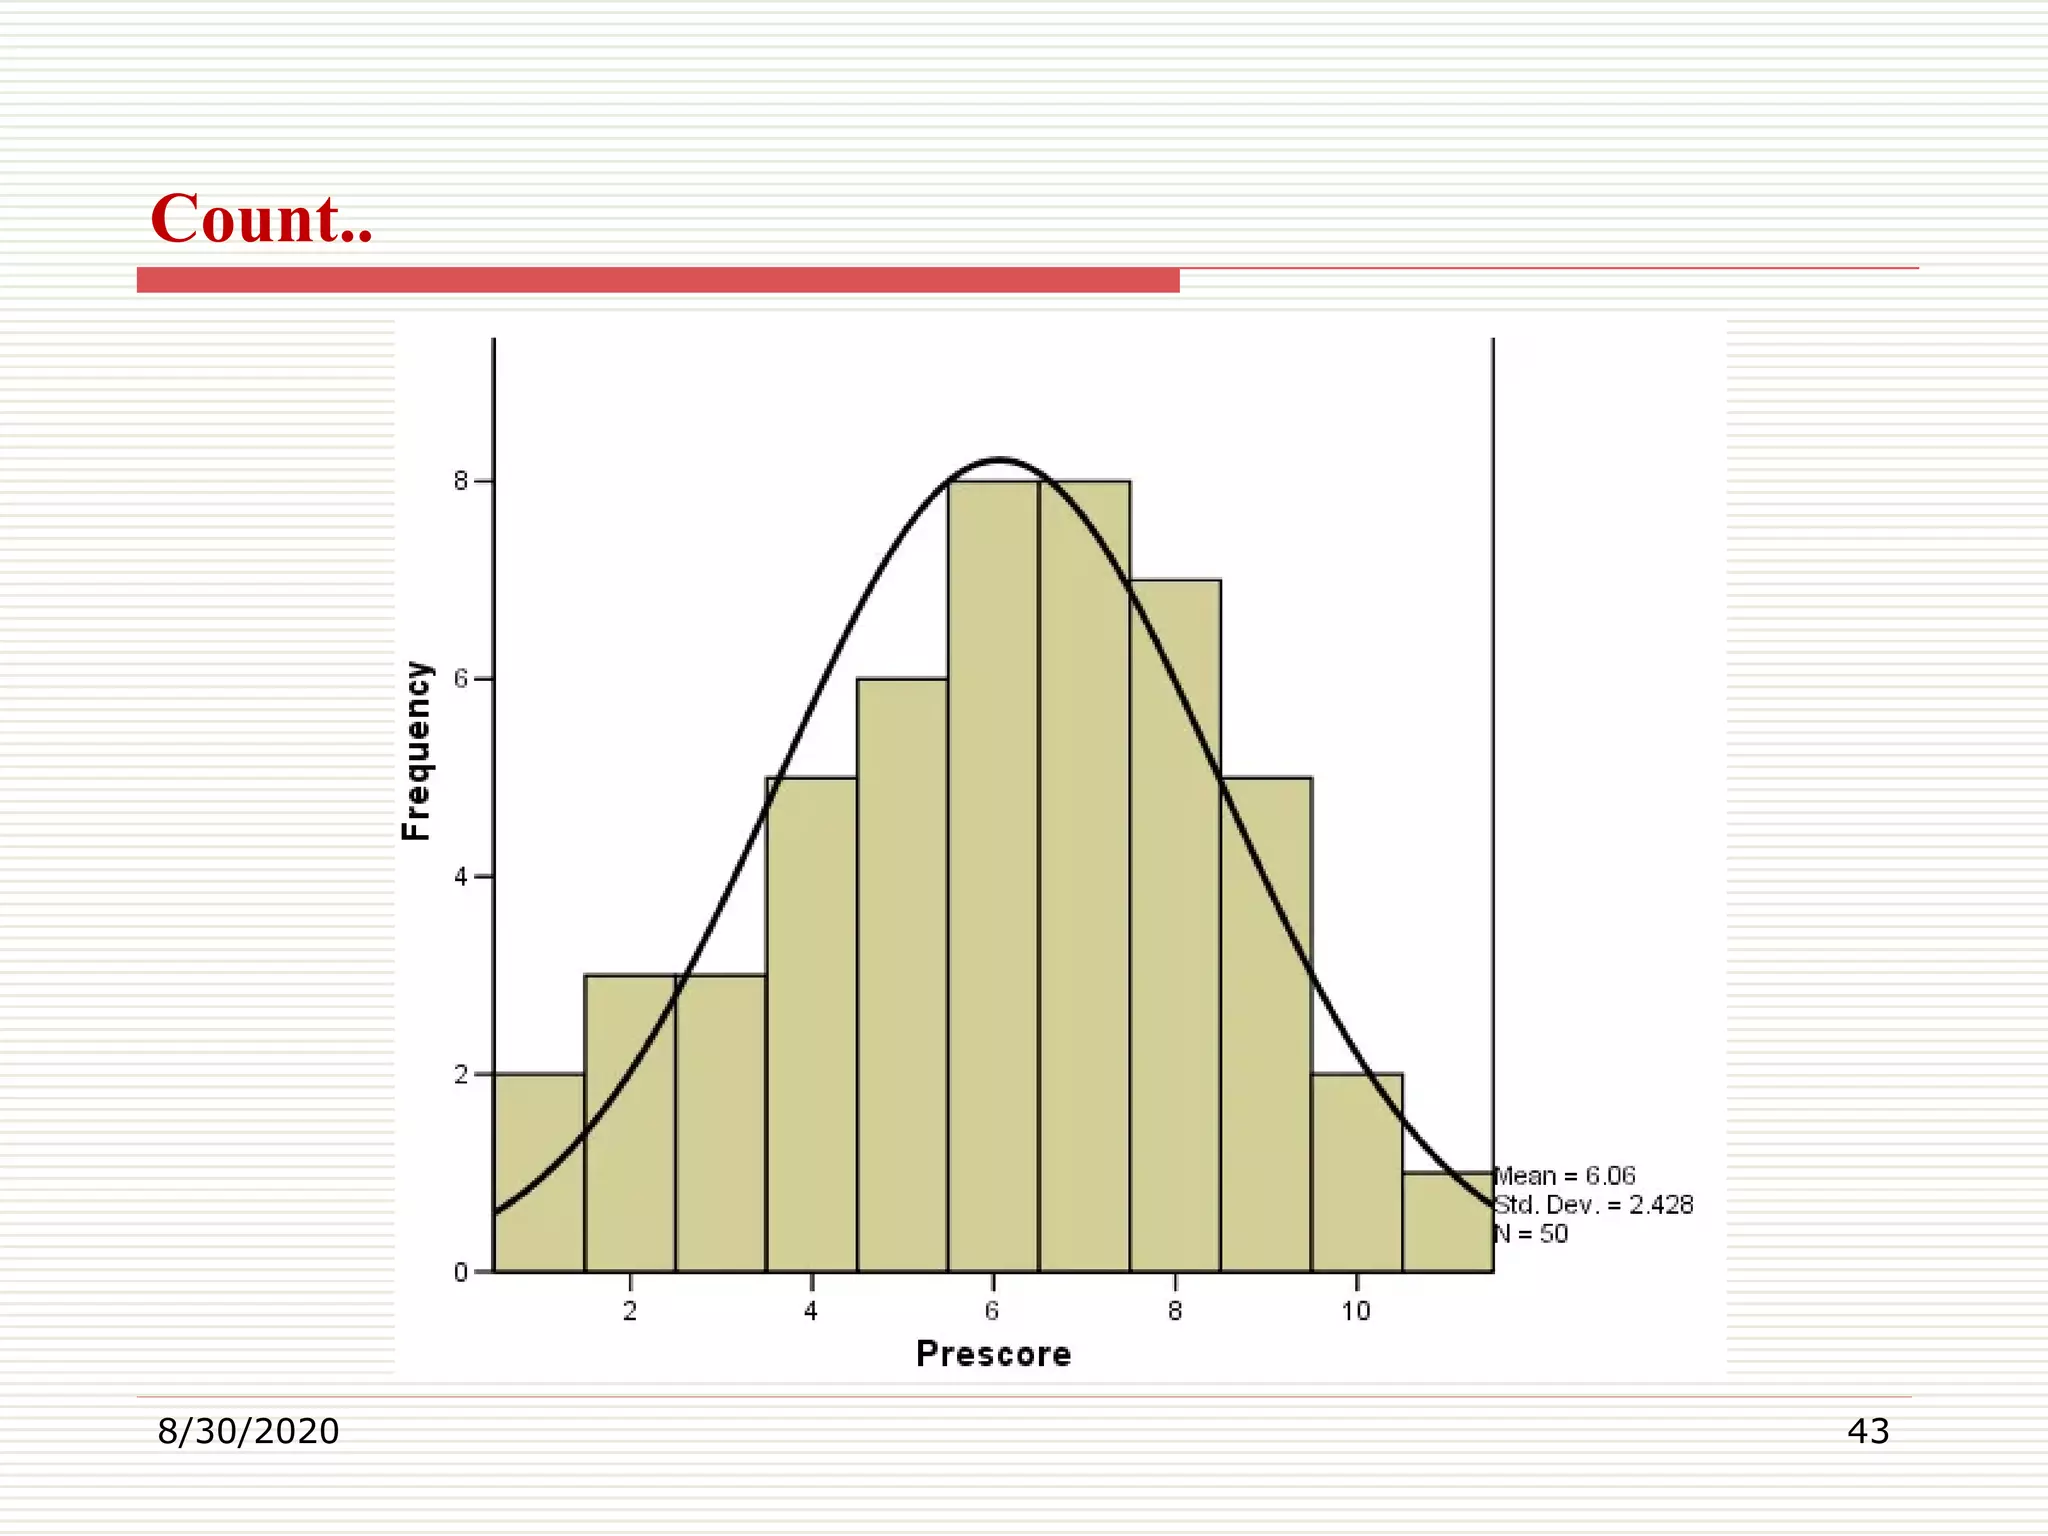
Properties and importance of the normal distribution; bell curve representation of data.
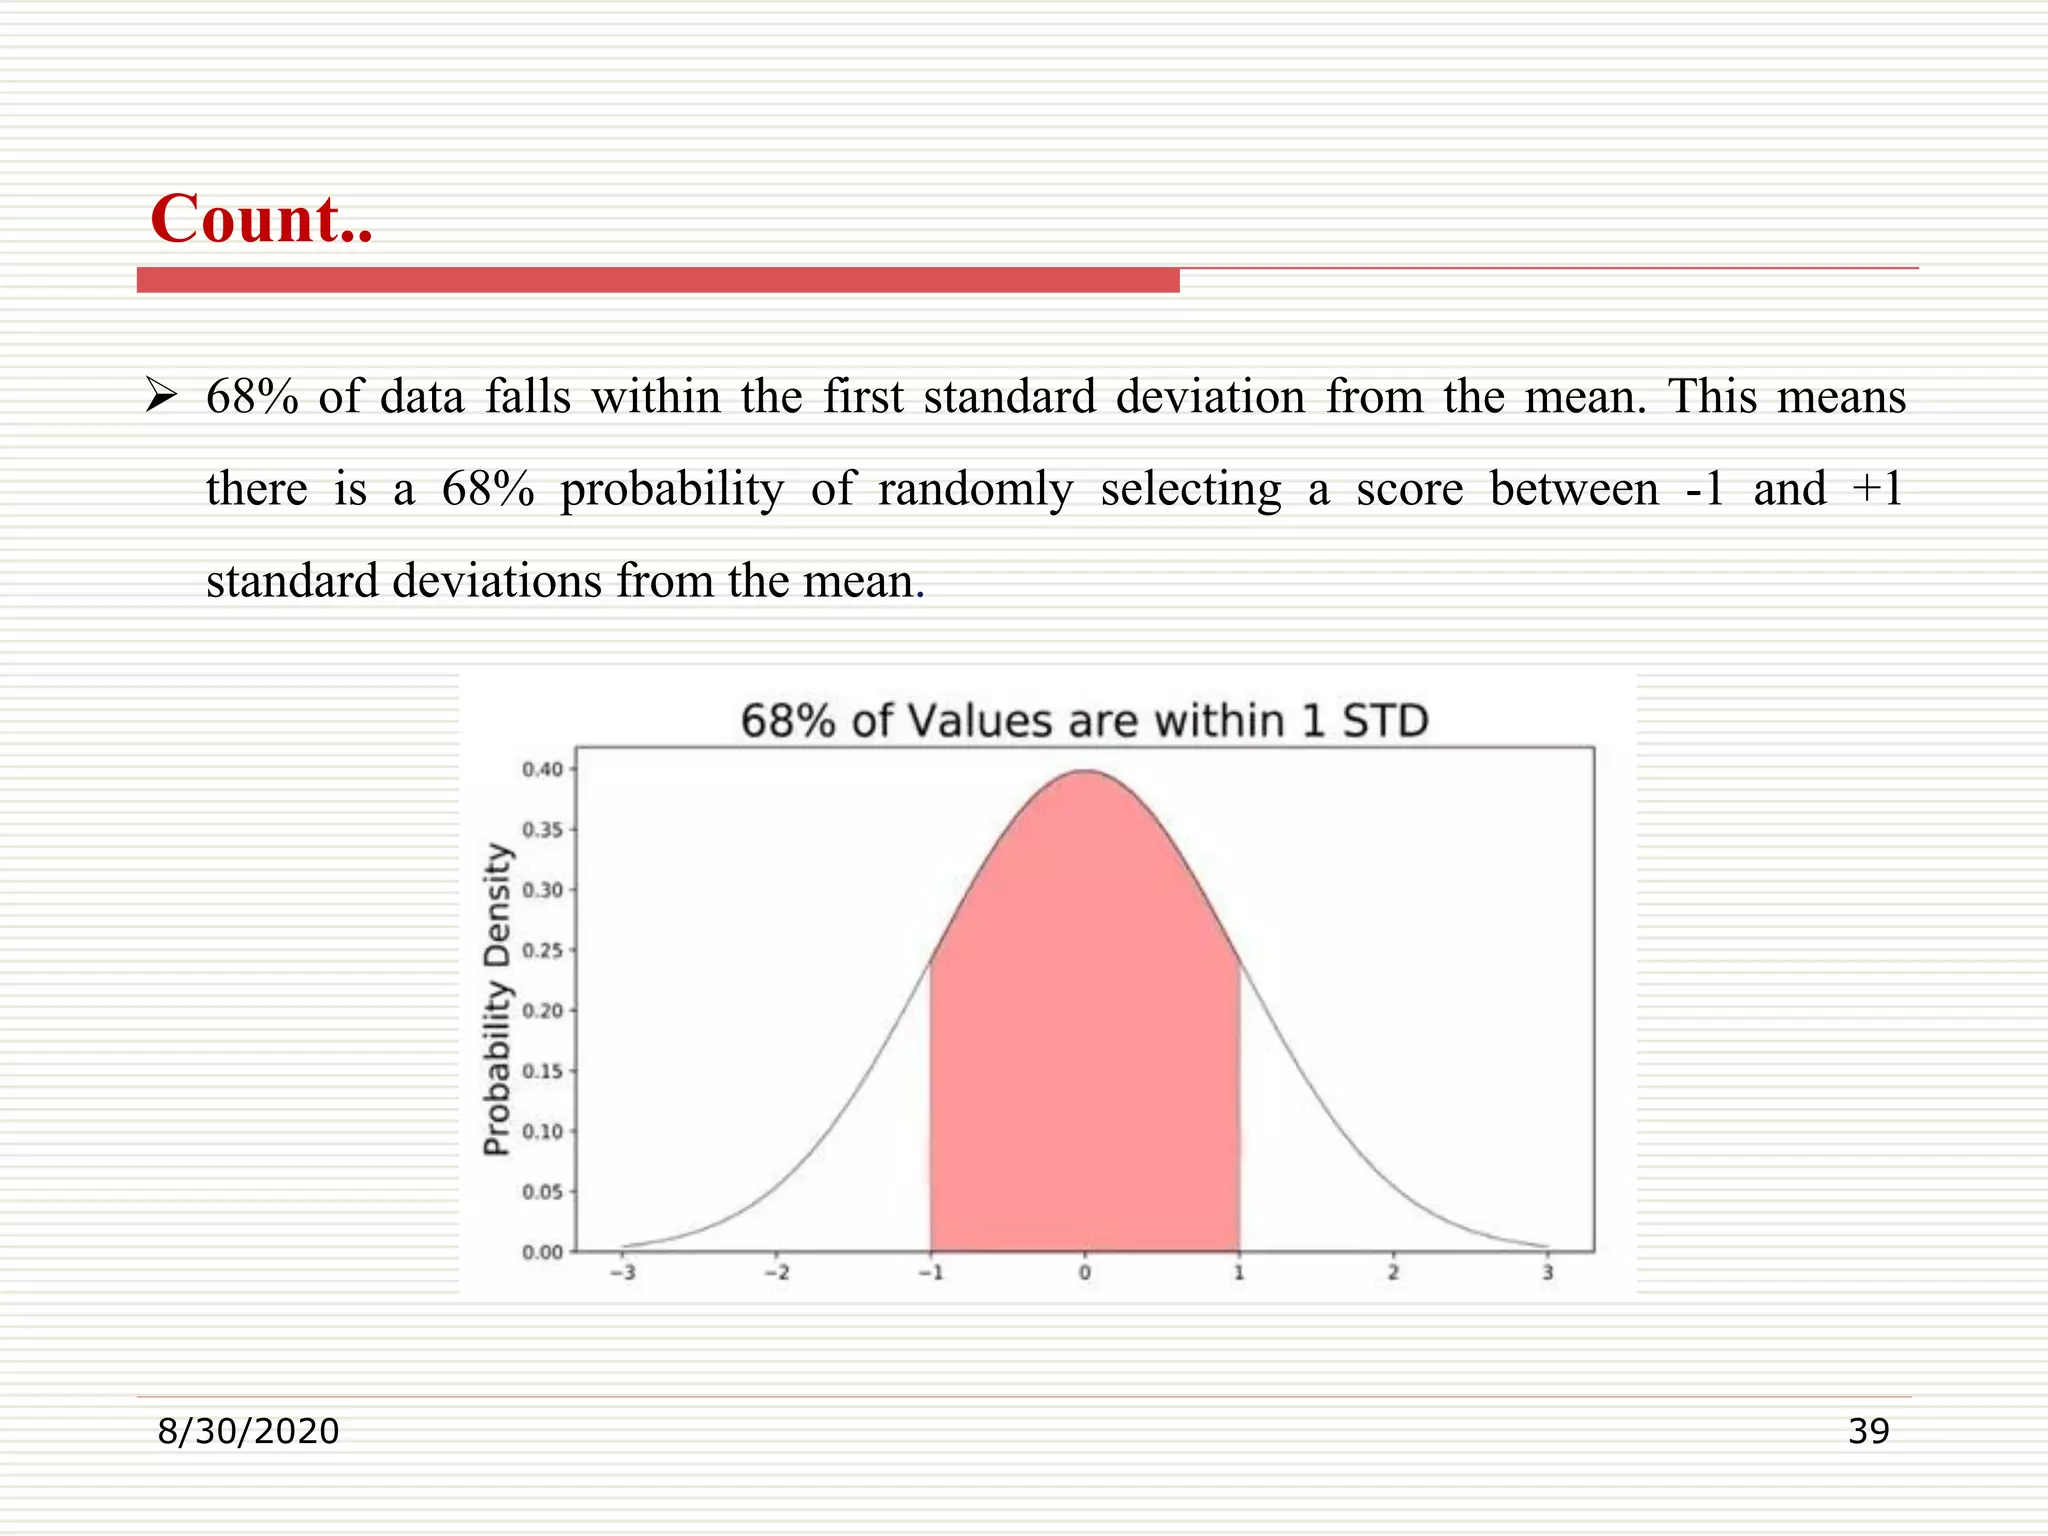
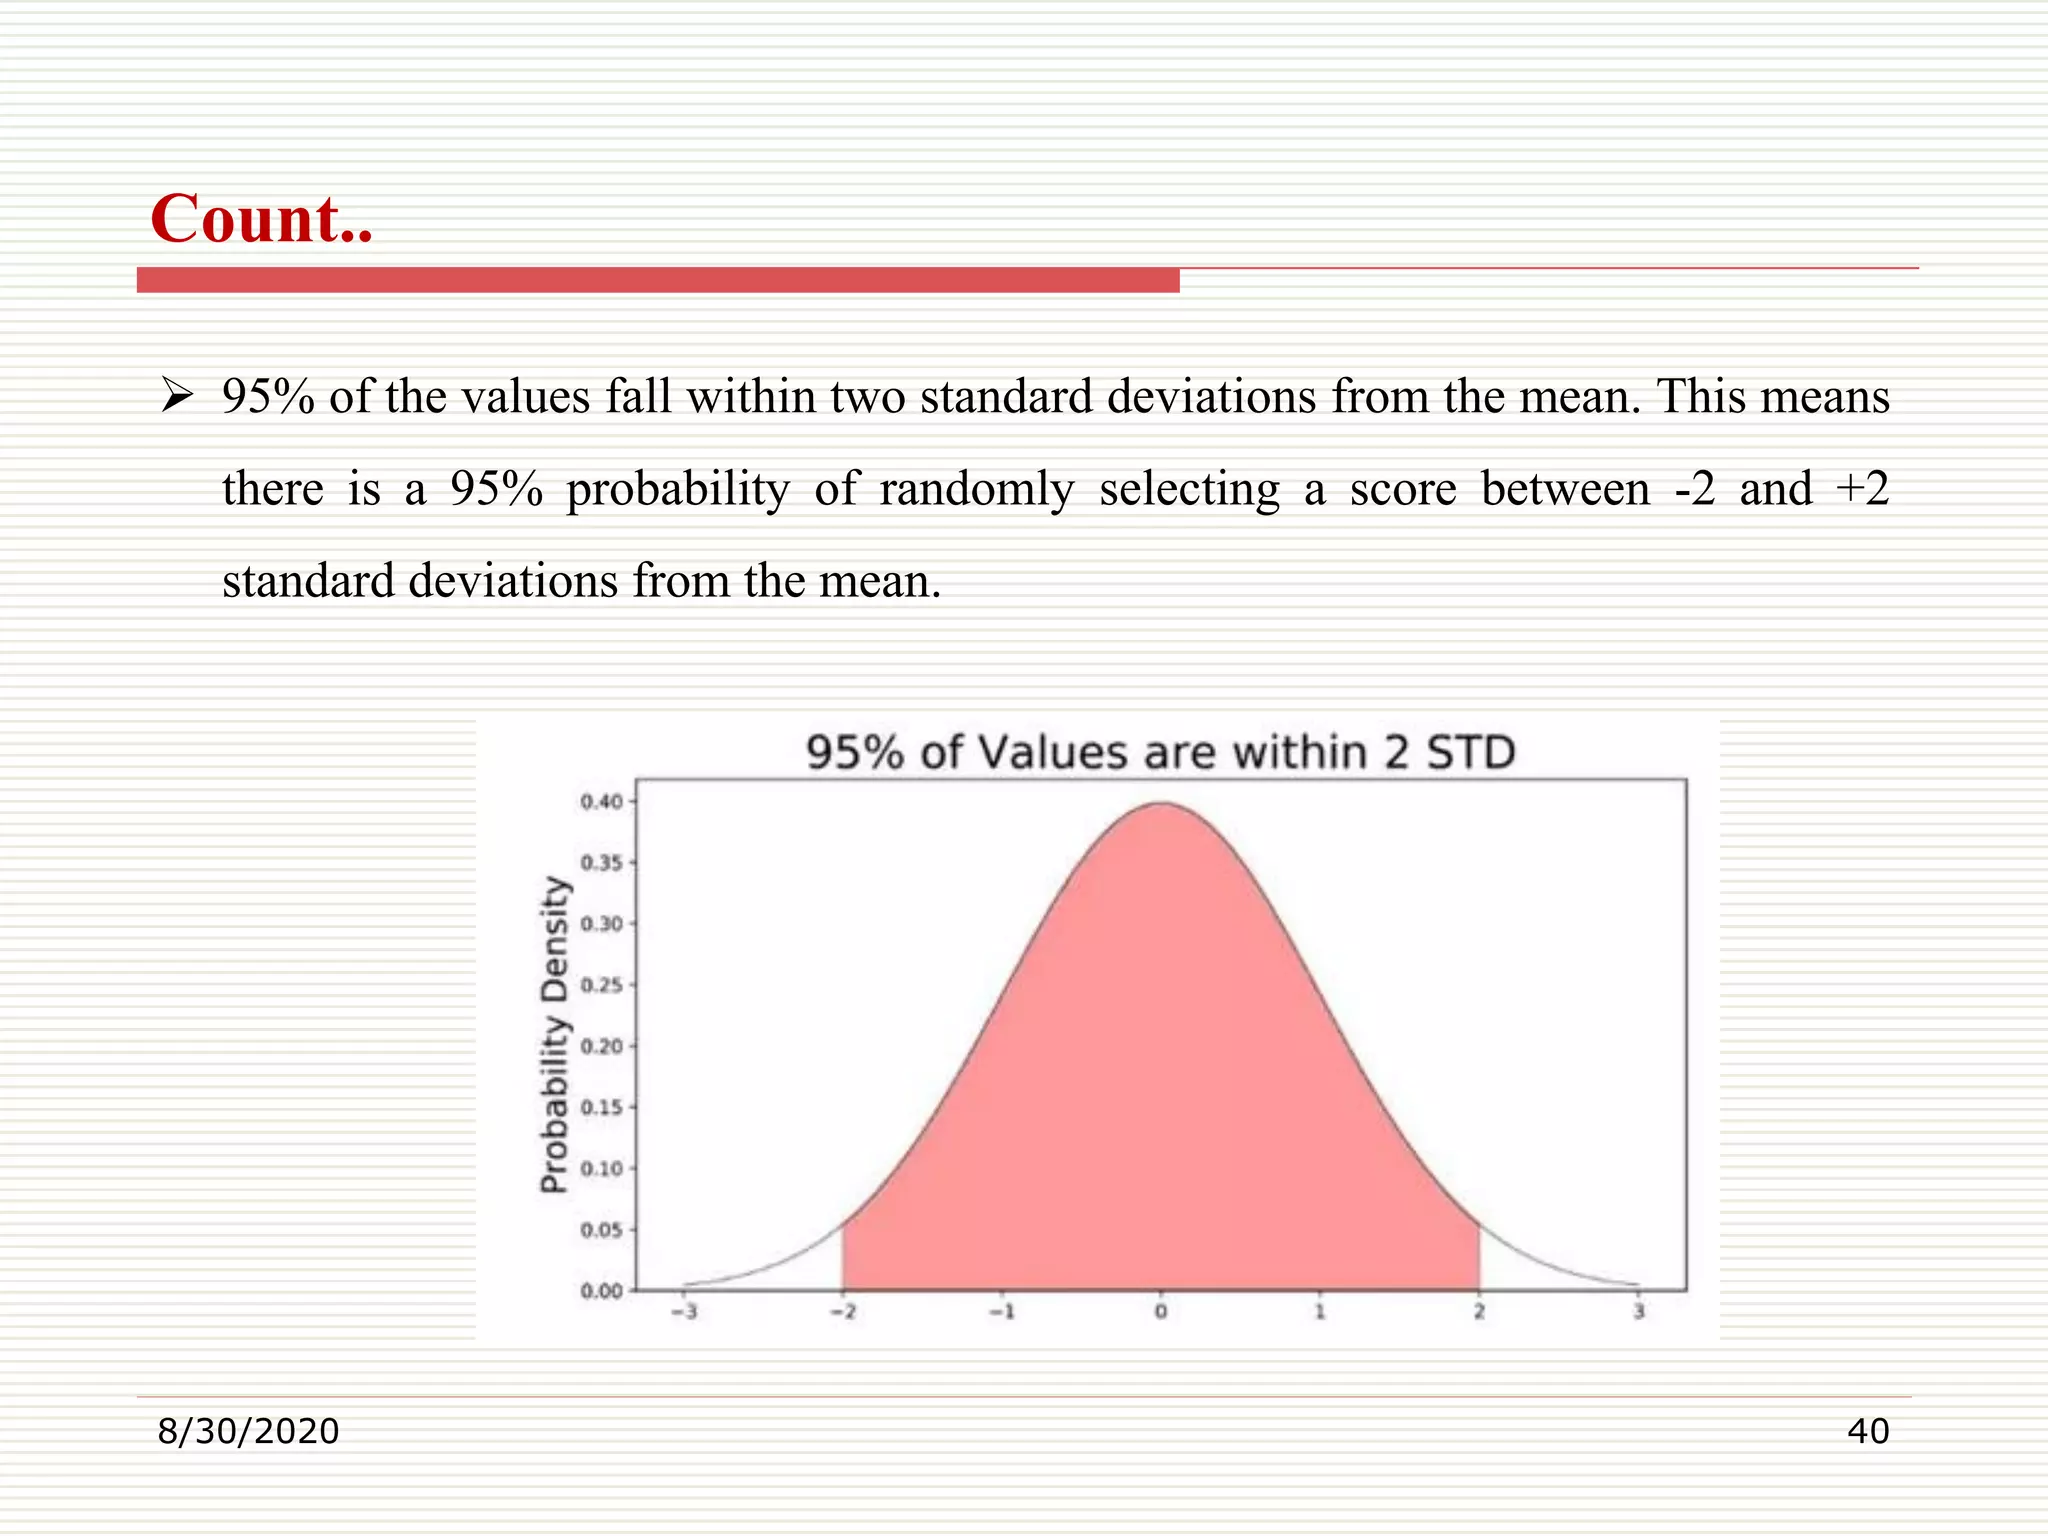
Explanation of the empirical rule; percentages of data distribution within standard deviations from the mean.
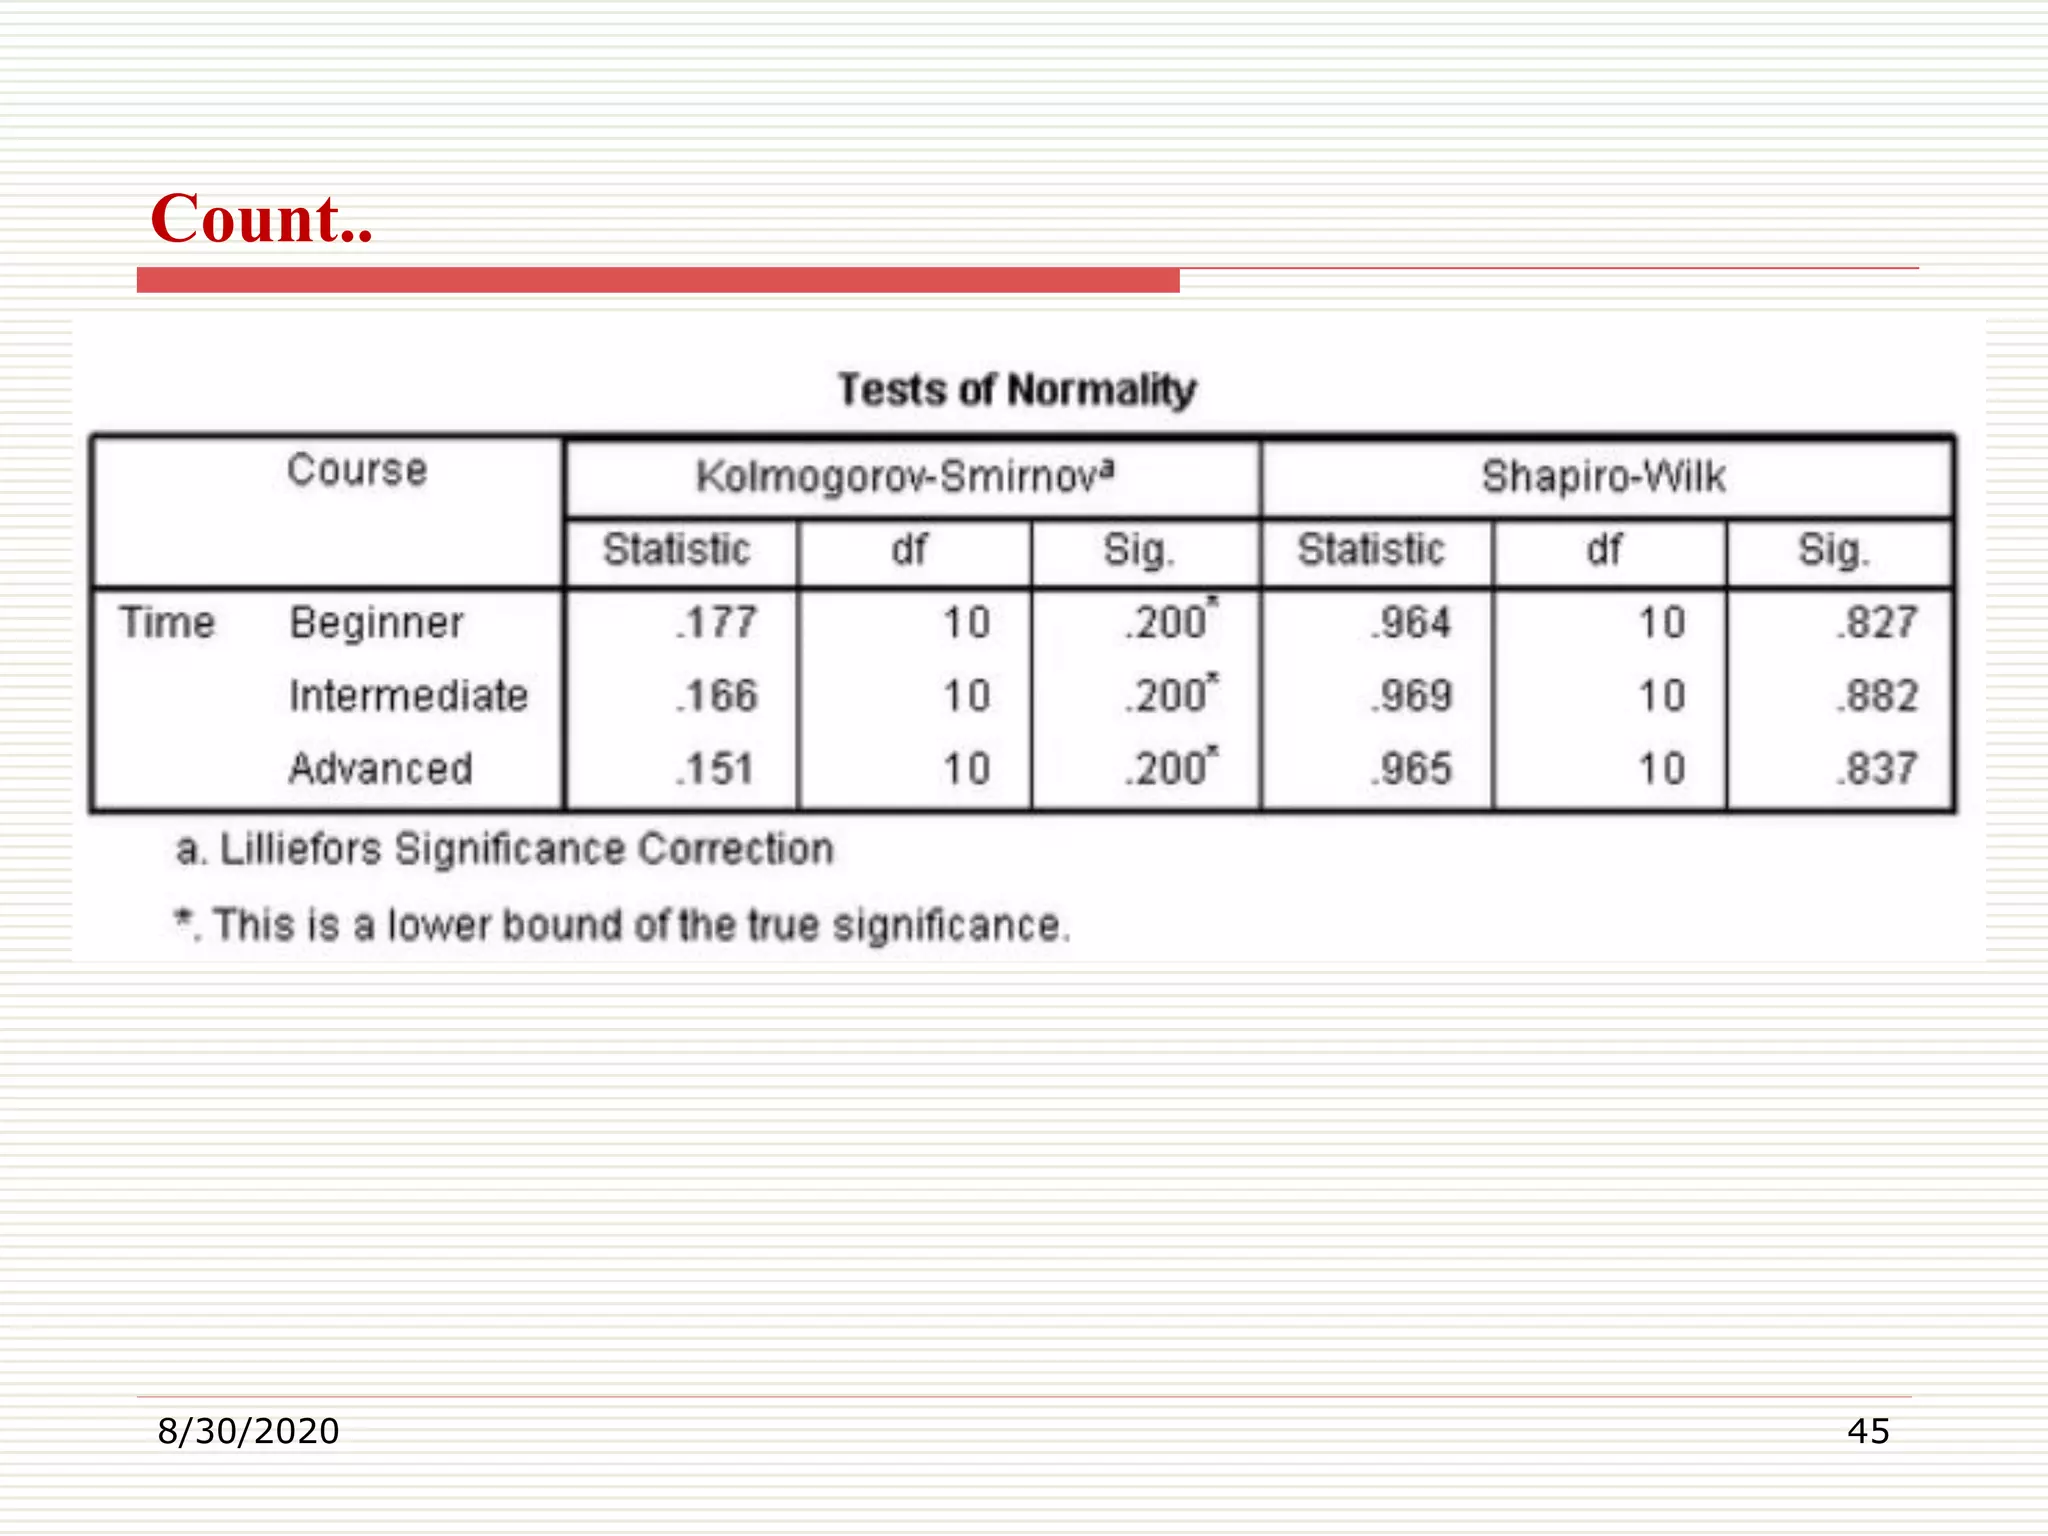
Methods for assessing if data follows a normal distribution using statistical software and visual checks.
Types of control charts: variables and attributes; definitions and uses of Xbar, R, p, np, C, and u charts.
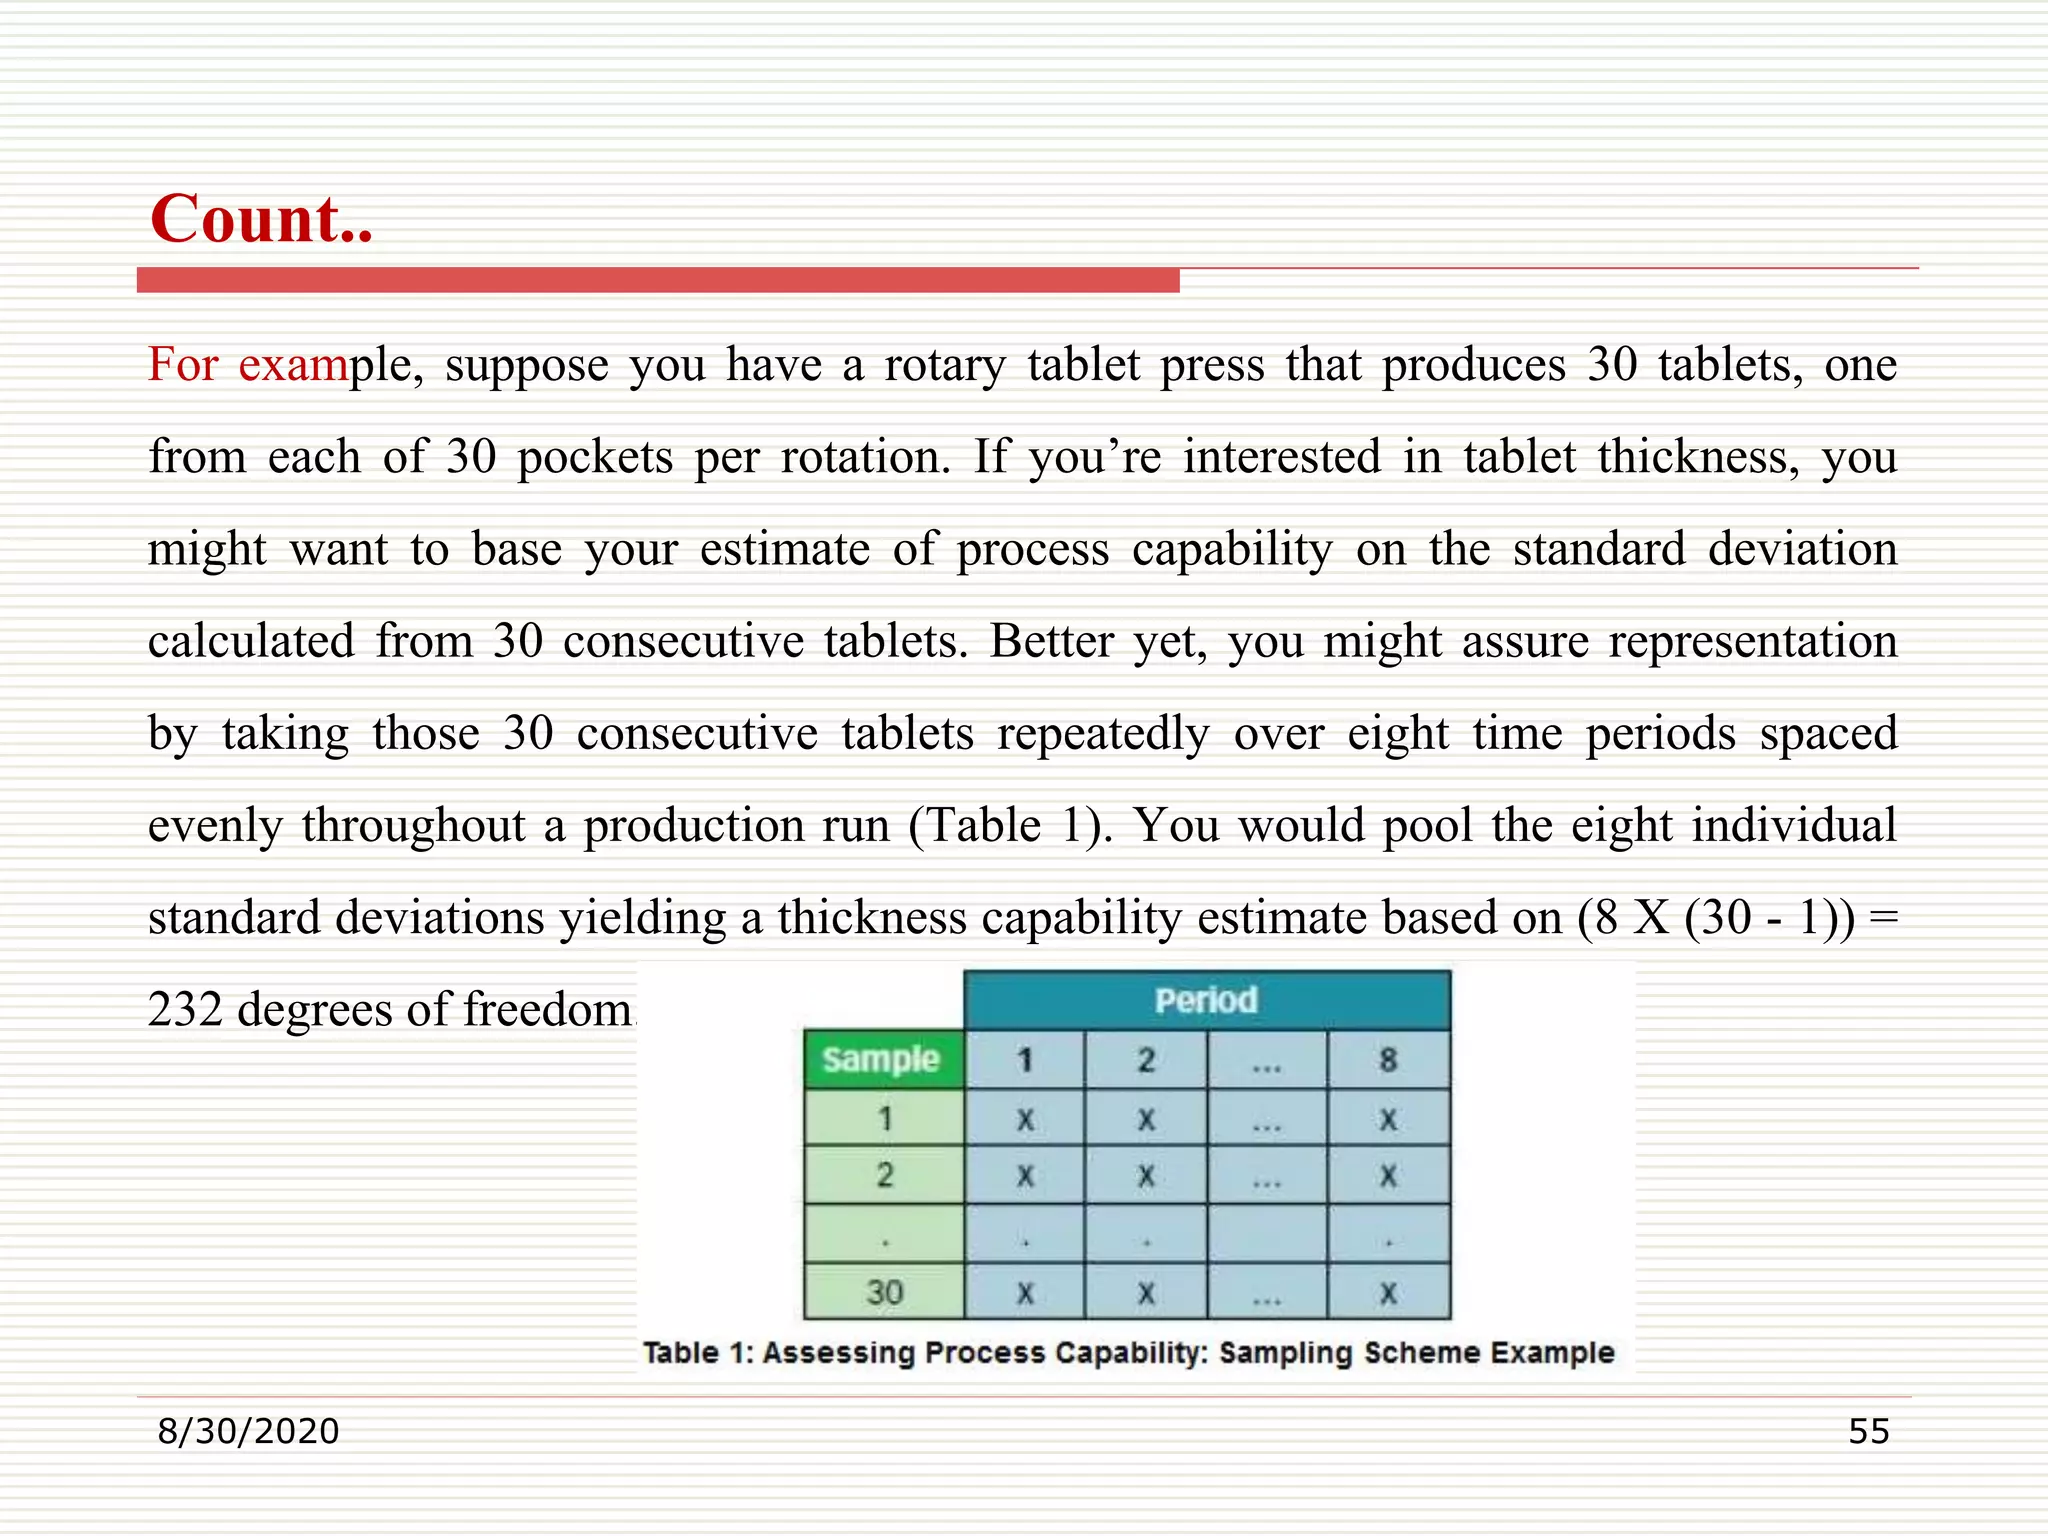
Concept of process capability; definitions of Cp and Cpk; importance in quality improvement initiatives.
Six Sigma applications across industries: manufacturing, healthcare, technology, and government.
Introduction to the seven new management and planning tools for promoting innovation and project management.
Thank you message.