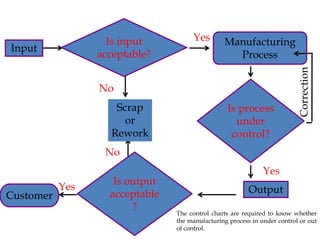
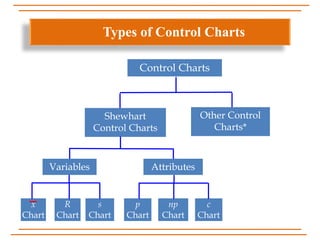
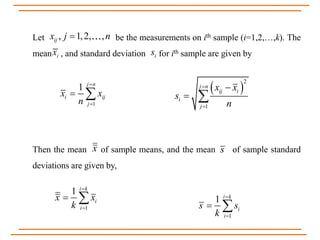
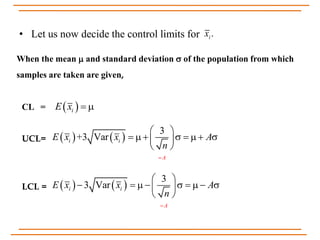
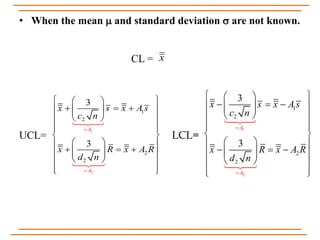
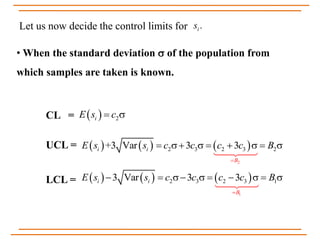
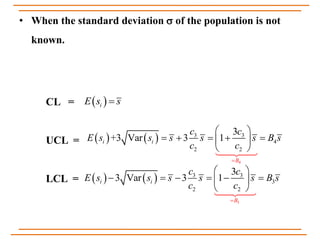
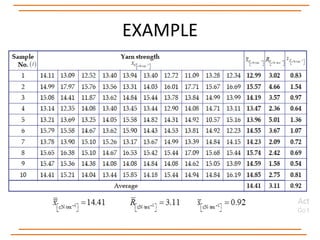
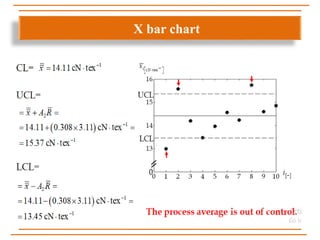
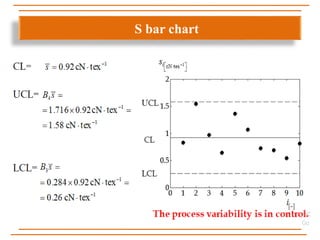
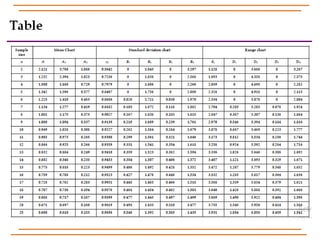
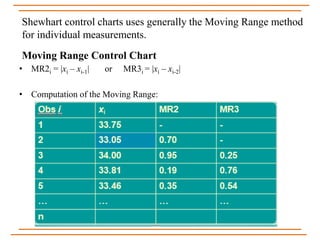
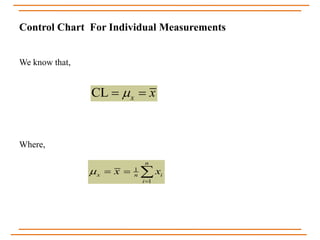
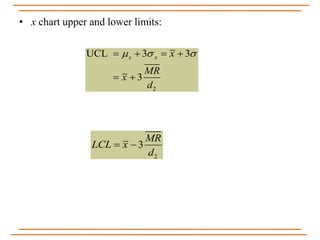
Statical Process Control
X,S and Shewhart control chart for
individual measurments
Prepared by : Harsh B Joshi
(M.Tech Production Engineering, 2nd Semester)
Parul Institute of Engineering, Limda
• Introduction
• Why Control Charts?
• X bar and S bar control charts
• Example
• Shewhart Control chart
CONTENTS
Two types of process data:
Variable:
 Continuous data. Things we can measure. Example includes length,
weight, time, temperature, diameter, etc.
 X bar and R Chart, X bar and sigma chart, chart for the individual
units
Attribute:
 Non continuous data. Things we count. Examples include number
or percent defective items in a lot, number of defects per item etc.
 p chart, np chart, c chart, u chart, U chart
Introduction
Why Control Charts?
Is input
acceptable?
Is output
acceptable
?
Manufacturing
Process
Output
Input
Customer
Is process
under
control?
Yes
Yes
No
No
Scrap
or
Rework
Correction
Yes
The control charts are required to know whether
the manufacturing process in under control or out
of control.
Control Charts
x
Chart
R
Chart
s
Chart
c
Chart
np
Chart
p
Chart
Shewhart
Control Charts
Other Control
Charts*
Variables Attributes
Types of Control Charts
X bar and S bar
control charts
Let be the measurements on ith sample (i=1,2,…,k). The
mean , and standard deviation for ith sample are given by
Then the mean of sample means, and the mean of sample standard
deviations are given by,
, 1,2, ,ijx j n
ix is
1
1 j n
i ij
j
x x
n


   
2
1
j n
ij i
i
j
x x
s
n



 
x s
1
1 i k
i
i
x x
k


 
1
1 i k
i
i
s s
k


 
• Let us now decide the control limits for .ix
When the mean  and standard deviation  of the population from which
samples are taken are given,
 iE x  
   
3
+3 Vari i
A
E x x A
n

 
        
 
   
3
3 Var
A
i iE x x A
n

 
         
 
CL =
UCL=
LCL =
• When the mean  and standard deviation  are not known.
CL =
UCL= LCL=
x
1
2
1
2
2
2
3
3
A
A
x s x A s
c n
x R x A R
d n


  
     
  
  
 
  
     
  
  
1
2
1
2
2
2
3
3
A
A
x s x A s
c n
x R x A R
d n


  
     
  
  
 
  
     
  
  
Let us now decide the control limits for .is
• When the standard deviation  of the population from
which samples are taken is known.
  2iE s c 
     
2
2 3 2 3 2+3 Var 3 3i i
B
E s s c c c c B

       
     
1
2 3 2 3 13 Var 3 3i i
B
E s s c c c c B

        
CL =
UCL =
LCL =
• When the standard deviation  of the population is not
known.
 iE s s
   
4
3 3
4
2 2
3
+3 Var 3 1i i
B
c c
E s s s s s B s
c c

 
     
 
   
3
3 3
3
2 2
3
3 Var 3 1
B
i i
c c
E s s s s s B s
c c

 
      
 
CL =
UCL =
LCL =
EXAMPLE
X bar chart
S bar chart
Shewhart control chart
• MR2i = |xi – xi-1| or MR3i = |xi – xi-2|
• Computation of the Moving Range:
Moving Range Control Chart
Shewhart control charts uses generally the Moving Range method
for individual measurements.
We know that,
Where,
CL x x 
1
1
n
x in
i
x x

  
Control Chart For Individual Measurements
• x chart upper and lower limits:
2
UCL 3 3
3
x x x
MR
x
d
     
 
2
3
MR
LCL x
d
 
THANK YOU
For your carefully listening and
attention..!

X, s chart and shewart control chart

  • 1.
    Statical Process Control X,Sand Shewhart control chart for individual measurments Prepared by : Harsh B Joshi (M.Tech Production Engineering, 2nd Semester) Parul Institute of Engineering, Limda
  • 2.
    • Introduction • WhyControl Charts? • X bar and S bar control charts • Example • Shewhart Control chart CONTENTS
  • 3.
    Two types ofprocess data: Variable:  Continuous data. Things we can measure. Example includes length, weight, time, temperature, diameter, etc.  X bar and R Chart, X bar and sigma chart, chart for the individual units Attribute:  Non continuous data. Things we count. Examples include number or percent defective items in a lot, number of defects per item etc.  p chart, np chart, c chart, u chart, U chart Introduction
  • 4.
  • 5.
    Is input acceptable? Is output acceptable ? Manufacturing Process Output Input Customer Isprocess under control? Yes Yes No No Scrap or Rework Correction Yes The control charts are required to know whether the manufacturing process in under control or out of control.
  • 6.
  • 7.
    X bar andS bar control charts
  • 8.
    Let be themeasurements on ith sample (i=1,2,…,k). The mean , and standard deviation for ith sample are given by Then the mean of sample means, and the mean of sample standard deviations are given by, , 1,2, ,ijx j n ix is 1 1 j n i ij j x x n       2 1 j n ij i i j x x s n      x s 1 1 i k i i x x k     1 1 i k i i s s k    
  • 9.
    • Let usnow decide the control limits for .ix When the mean  and standard deviation  of the population from which samples are taken are given,  iE x       3 +3 Vari i A E x x A n                   3 3 Var A i iE x x A n                CL = UCL= LCL =
  • 10.
    • When themean  and standard deviation  are not known. CL = UCL= LCL= x 1 2 1 2 2 2 3 3 A A x s x A s c n x R x A R d n                                   1 2 1 2 2 2 3 3 A A x s x A s c n x R x A R d n                                  
  • 11.
    Let us nowdecide the control limits for .is • When the standard deviation  of the population from which samples are taken is known.   2iE s c        2 2 3 2 3 2+3 Var 3 3i i B E s s c c c c B                1 2 3 2 3 13 Var 3 3i i B E s s c c c c B           CL = UCL = LCL =
  • 12.
    • When thestandard deviation  of the population is not known.  iE s s     4 3 3 4 2 2 3 +3 Var 3 1i i B c c E s s s s s B s c c                3 3 3 3 2 2 3 3 Var 3 1 B i i c c E s s s s s B s c c             CL = UCL = LCL =
  • 13.
  • 14.
  • 15.
  • 17.
  • 18.
    • MR2i =|xi – xi-1| or MR3i = |xi – xi-2| • Computation of the Moving Range: Moving Range Control Chart Shewhart control charts uses generally the Moving Range method for individual measurements.
  • 19.
    We know that, Where, CLx x  1 1 n x in i x x     Control Chart For Individual Measurements
  • 20.
    • x chartupper and lower limits: 2 UCL 3 3 3 x x x MR x d         2 3 MR LCL x d  
  • 21.
    THANK YOU For yourcarefully listening and attention..!