Downloaded 29 times
![PyWPS
Overlay, subset, reproject, aggregate functionality (example):
GNworldgrids(layername=globcov, xcoord=6.848911, ycoord=52.245427)
[1] 50
under construction.
SS2010 conference, Mar 26th 2011](https://image.slidesharecdn.com/ovhenglss2011slideshare-110325024129-phpapp01/75/Worldgrids-org-building-global-covariates-for-automated-mapping-29-2048.jpg)
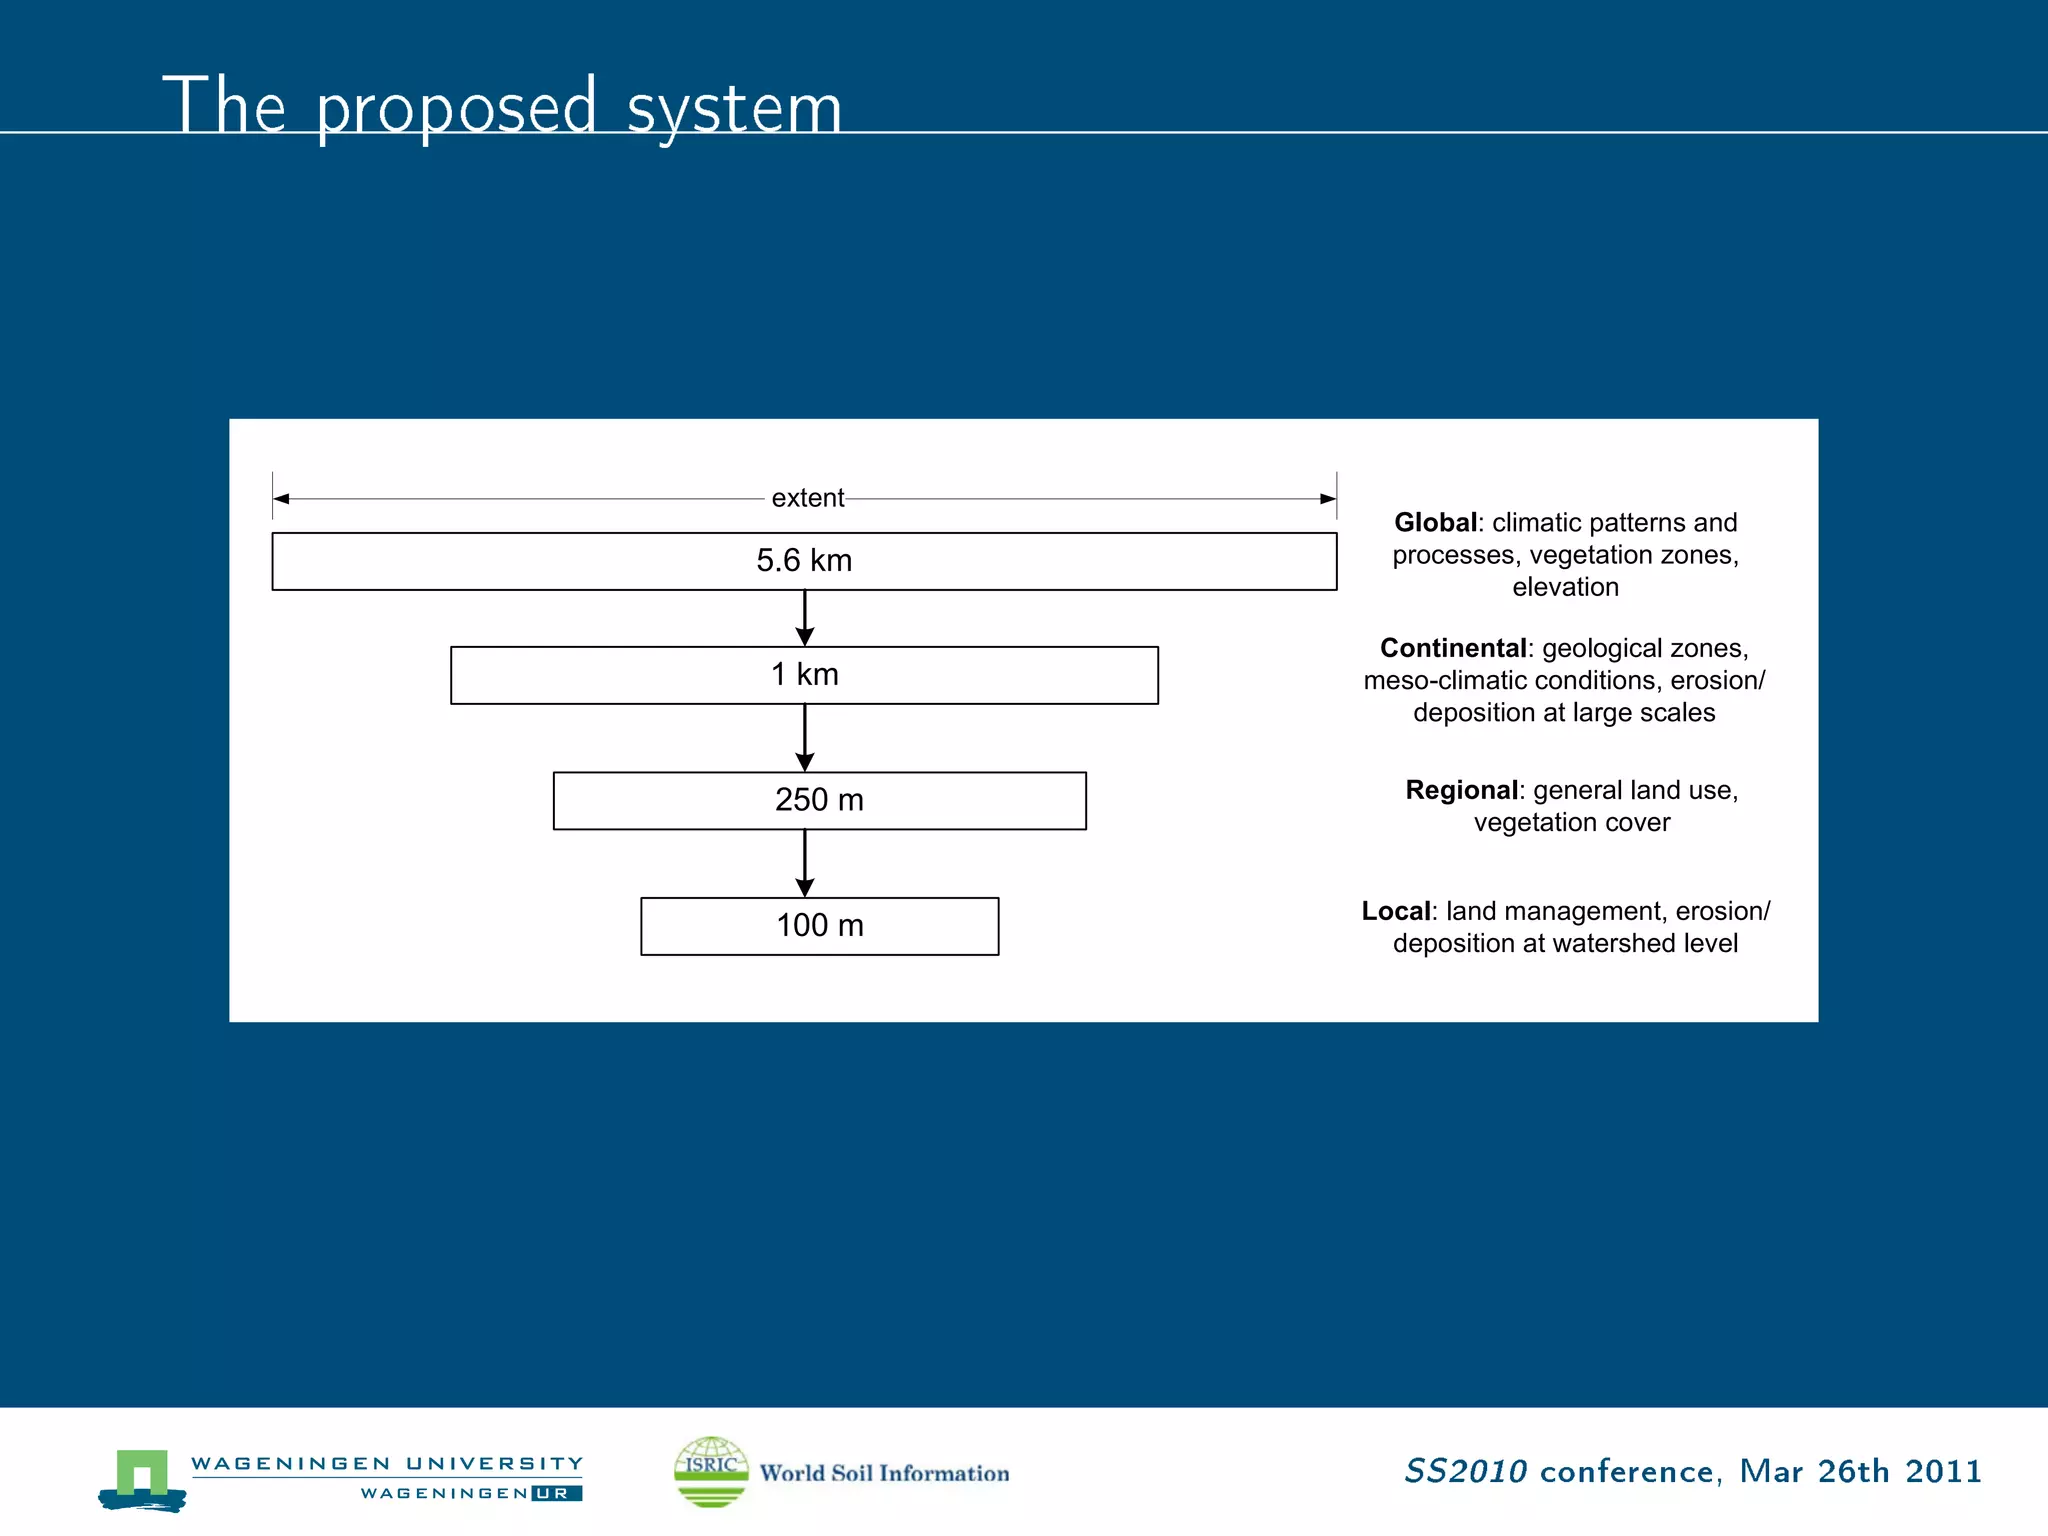
![Global Multiscale Nested RK
We propose using nested RK model:
z(sB ) = m0 (sB−k ) + e1 (sB−k |sB−[k+1] ) + . . . + ek (sB−2 |sB−1 ) + ε(sB ) (3)
where z(s ) is the value of the target variable estimated at ground
B
scale (B), , . . . , are the higher order components,
B−1
) is the residual variation from scale s to a
B−k
e (s |s
higher resolution scale s , and ε is spatially auto-correlated
k B−k B−(k+1) B−(k+1)
residual soil variation (dealt with ordinary kriging).
B−k
SS2010 conference, Mar 26th 2011](https://image.slidesharecdn.com/ovhenglss2011slideshare-110325024129-phpapp01/75/Worldgrids-org-building-global-covariates-for-automated-mapping-44-2048.jpg)
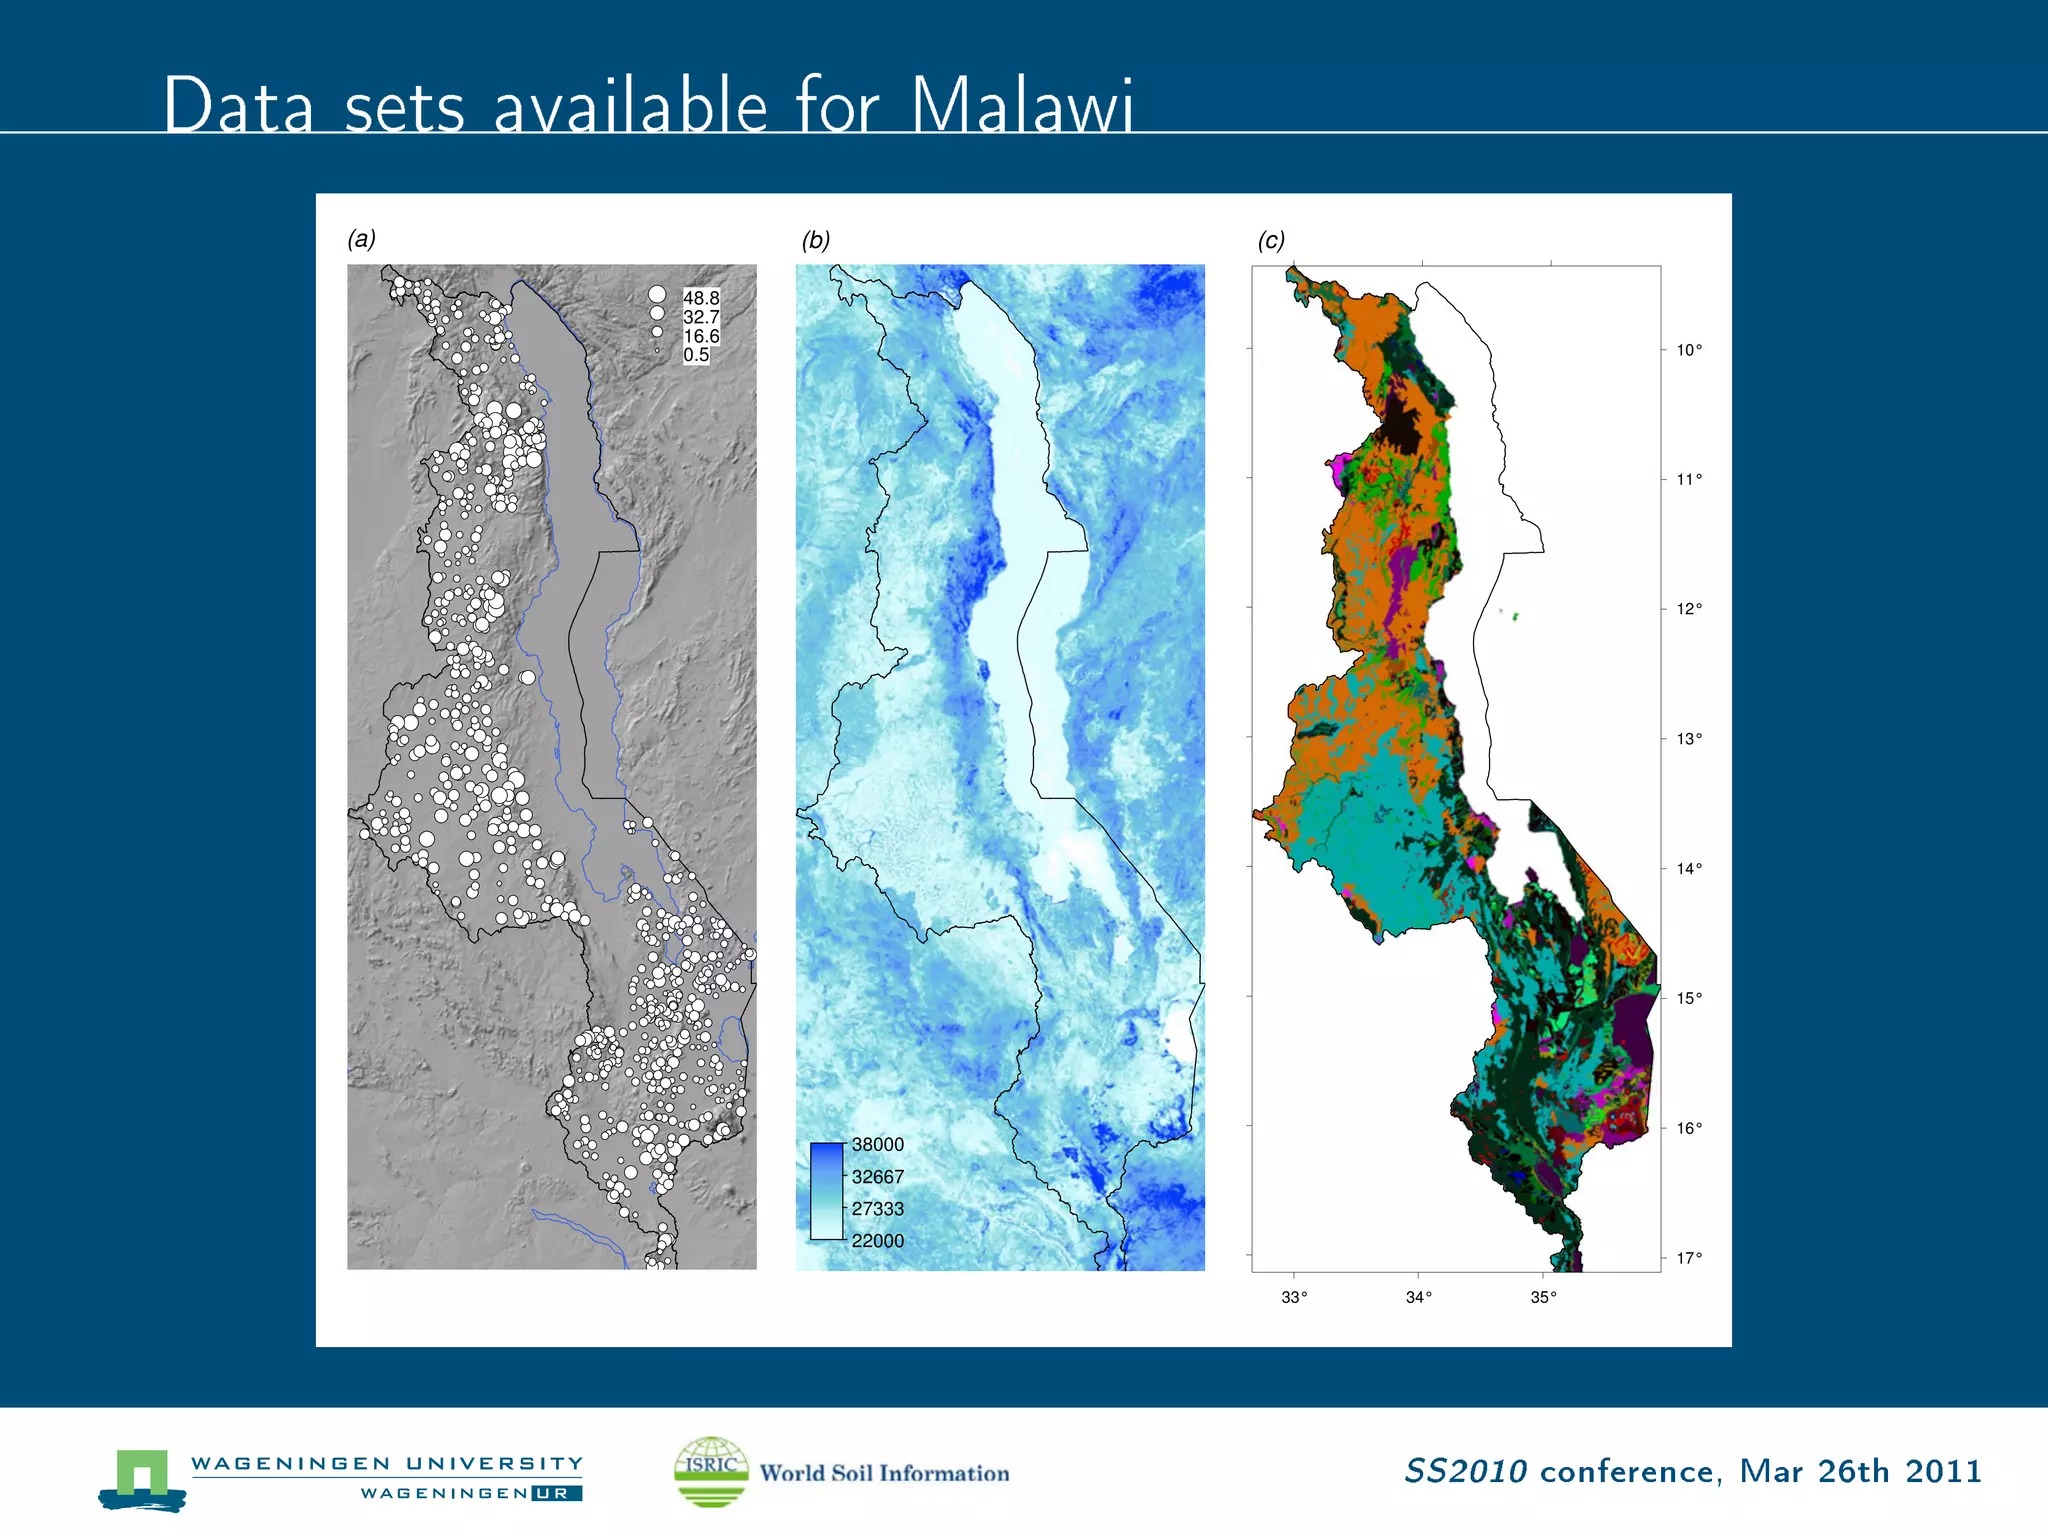
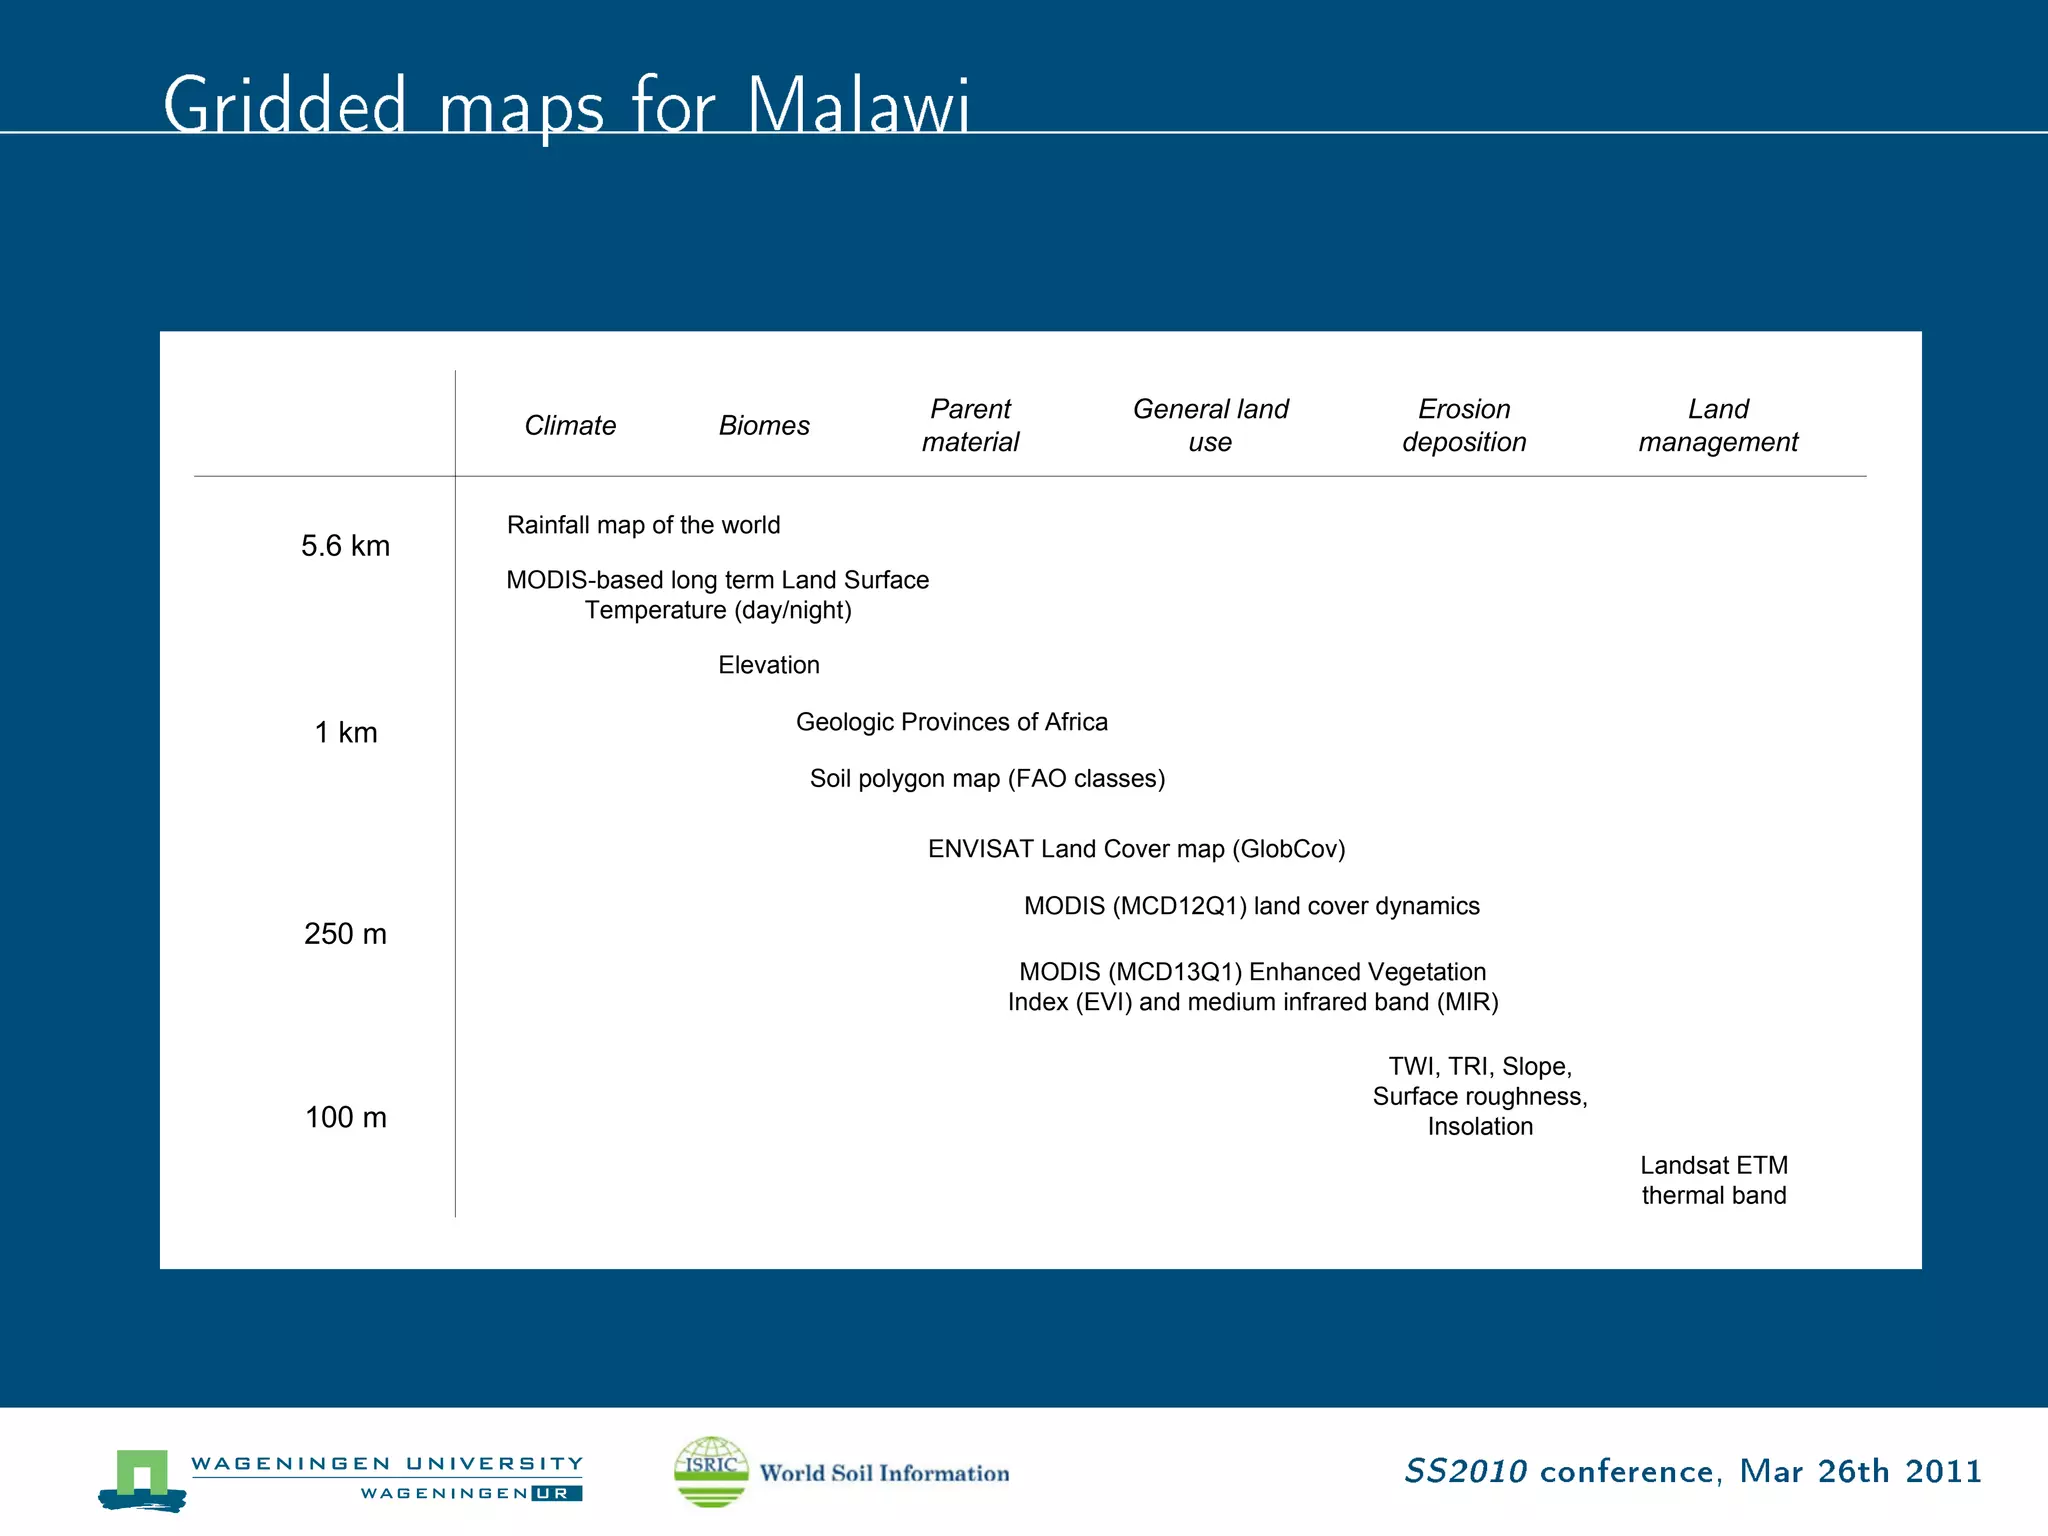


The document discusses a global repository of publicly available geospatial data called Worldgrids.org. It was created to make a variety of global geospatial data sets more accessible and usable for tasks like species distribution modeling. The repository contains over 100 raster maps of variables like climate, elevation and land cover, processed to a common grid format. It aims to promote greater reuse of publicly available global data.


![[Day 2] Center Presentation: IRRI](https://cdn.slidesharecdn.com/ss_thumbnails/cgiar-csi-day2-1apr2009-center-irri-090405003208-phpapp01-thumbnail.jpg?width=640&height=640&fit=bounds)


