Wetland and Water Bodies Atlas of Jammu and kashmir
•
5 likes•29,023 views

This Atlas is prepared at 1: 50, 000 scale based on remote sensing and detailed fieldwork. The Atlas was developed by my research group with financial support of the Indian Space Research Organization (ISRO)

More Related Content
What's hot
What's hot (20)
Viewers also liked
Viewers also liked (15)
Similar to Wetland and Water Bodies Atlas of Jammu and kashmir
Similar to Wetland and Water Bodies Atlas of Jammu and kashmir (20)
More from Shakil Romshoo
More from Shakil Romshoo (9)
Wetland and Water Bodies Atlas of Jammu and kashmir
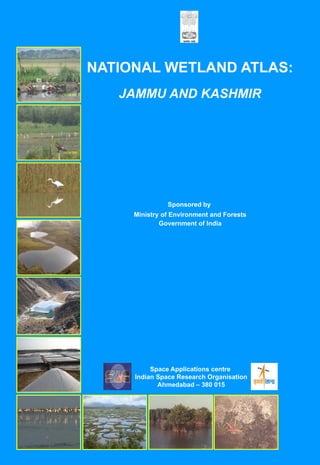
- 1. NATIONAL WETLAND ATLAS: JAMMU AND KASHMIR Sponsored by Ministry of Environment and Forests Government of India Space Applications centre Indian Space Research Organisation Ahmedabad – 380 015
- 2. This publication deals with the updated database and status of wetlands, compiled in Atlas format. Increasing concern about how our wetlands are being influenced has led to formulation of a project entitled “National Wetland Inventory and Assessment (NWIA)” to create an updated database of the wetlands of India. The wetlands are categorised under 19 classes and mapped using satellite remote sensing data from Indian Remote Sensing Satellite: IRS P6- LISS III sensor. The results are organised at 1: 50, 000 scales at district, state and topographic map sheet (Survey of India reference) level using Geographic Information System (GIS). This publication is a part of this national work and deals with the wetland status of a particular State/Union Territory of India, through text, statistical tables, satellite images, maps and ground photographs. The atlas comprises wetland information arranged into nine sections. How the NWIA project work has been executed highlighted in the first six sections viz: Introduction, NWIA project, Study area, Data used, Methodology, and Accuracy. This is the first time that high resolution digital remote sensing data has been used to map and decipher the status of the wetlands at national scale. The methodology highlights how the four spectral bands of LISS III data (green, red, near infra red and short wave infra red) have been used to derive various indices and decipher information regarding water spread, turbidity and aquatic vegetation. Since, the aim was to generate a GIS compatible database, details of the standards of database are also highlighted in the methodology. The results and finding are organised in three sections; viz: Maps and Statistics, Major wetland types, and Important Wetlands of the area. The Maps and Statistics are shown for state and district level. It gives details of what type of wetlands exists in the area, how many numbers in each type, their area estimates in hectare. Since, the hydrology of wetlands are influenced by monsoon performance, extent of water spread and their turbidity (qualitative) in wet and dry season (post- monsoon and pre-monsoon period) are also given. Similarly the status of aquatic vegetation (mainly floating and emergent types) in two seasons is also accounted for. Status of small wetlands are also accounted as numbers and depicted in maps as points. Wetland map also show important ancillary information like roads/rail, relevant habitations. False Colour Composite (FCC) of the satellite image used (any one season) is shown along with the derived wetland map to give a feeling of manifestation of wetlands in remote sensing data and synoptic view of the area. The status of some of the important wetlands like Ramsar sites, National Parks are shown with recent field photographs. For further details contact: Director, Space Applications Centre, ISRO, Ambawadi Vistar (P.O.) Ahmedabad – 380 015 director@sac.isro.gov.in
- 3. Atlas SAC/RESA/AFEG/NWIA/ATLAS/16/2010 NATIONAL WETLAND ATLAS JAMMU AND KASHMIR Sponsored by Ministry of Environment and Forests, Government of India As a part of the project on National Wetland Inventory and Assessment (NWIA) Space Applications Centre (ISRO), Ahmedabad and The University of Kashmir, Srinagar February 2010
- 4. First Publication: February 2010, Space Applications Centre (ISRO), Ahmedabad Copyright: 2010, SAC, ISRO This publication may be produced in whole or in part and in any form for education or non-profit uses, without special permission from the copyright holder, provided acknowledgement of source is made. SAC will appreciate a copy of any publication which uses this publication as a source. Citation: National Wetland Atlas: Jammu and Kashmir, SAC/RESA/AFEG/NWIA/ATLAS/16/2010, Space Applications Centre, ISRO, Ahmedabad, India, 176p. Available from: Space Applications Centre, ISRO, Ahmedabad – 380 015, India Production: SAC carried out the work, Sponsored by Ministry of Environment and Forests, Govt. of India. ii
- 5. MESSAGE It gives me great pleasure to introduce this Atlas, the latest in a series, prepared by Space Applications Centre, Ahmedabad in connection with the National Wetland Inventory and Assessment Project. This Atlas maps and catalogues information on Wetlands across India using the latest in satellite imaging, one of the first of its kind. Wetlands are areas of land critical ecological significance that support a large variety of plant and animal species adapted to fluctuating water levels. Their identification and protection becomes very important. Utility-wise, wetlands directly and indirectly support millions of people in providing services such as food, fiber and raw materials. They play important roles in storm and flood control, in supply of clean water, along with other educational and recreational benefits. Despite these benefits, wetlands are the first target of human interference and are among the most threatened of all natural resources. Around 50% of the earth’s wetlands are estimated to already have disappeared worldwide over the last hundred years through conversion to industrial, agricultural and residential purposes. Even in current scenario, when the ecosystem services provided by wetlands are better understood - degradation and conversion of wetlands continues. Aware of their importance, the Government of India has formulated several policies and plans for the conservation and preservation of these crucial ecosystems. Realising the need of an updated geospatial data base of these natural resources as the pre-requisite for management and conservation planning, National Wetland Inventory and Assessment (NWIA) project was formulated as a joint vision of Ministry of Environment & Forestry, Govt. India, and Space Applications Centre (ISRO). I am told that the latest remote sensing data from Indian Remote Sensing satellite (IRS P6) have been used to map the wetlands. The present atlas is part of this project and highlights the results of the study state in terms of statistics of various types of wetlands, extent of water, aquatic vegetation and turbidity in pre and post monsoon period. I also note that special efforts are made to provide detailed information of important wetlands like Ramsar sites, National Parks etc. I am certain that this Atlas will raise the bar in developing such database and will be of great use for researchers, planners, policy makers, and also members of the general public. iii
- 6. iv
- 7. FOREWORD Wetlands defined as areas of land that are either temporarily or permanently covered by water exhibit enormous diversity according to their genesis, geographical location, water regime and chemistry. Wetlands are one of the most productive ecosystems and play crucial role in hydrological cycle. Utility wise, wetlands directly and indirectly support millions of people in providing services such as storm and flood control, clean water supply, food, fiber and raw materials, scenic beauty, educational and recreational benefits. The Millennium Ecosystem Assessment estimates conservatively that wetlands cover seven percent of the earth’s surface and deliver 45% of the world’s natural productivity and ecosystem services. However, the very existence of these unique resources is under threat due to developmental activities, and population pressure. This calls for a long term planning for preservation and conservation of these resources. An updated and accurate database that will support research and decision is the first step towards this. Use of advanced techniques like Satellite remote sensing, Geographic Information System (GIS) is now essential for accurate and timely spatial database of large areas. Space Applications Centre (ISRO) took up this challenging task under the project “NWIA” (National Wetland Inventory and Assessment) sponsored by Ministry of Environment & Forests. To account for numerous small yet important wetlands found in the country, mapping at 1:50,000 scales has been taken up. Two date IRS LISS III data acquired during pre and post monsoon season are used for inventory to account for wet and dry season hydrology of wetlands. The map outputs include the status of water spread, aquatic vegetation and turbidity. Ancillary layers like road/rail, habitations are also created. Very small wetlands below the mappable unit are also identified and shown points. The results are complied as Atlases of wetlands for states/Union Territories of India. This Atlas highlights results for a particular state/UT and hopes to improve our understanding of the dynamics and distribution of wetlands and their status in the area. I congratulate the team for bringing out this informative atlas and sincerely hope that this will serve as a useful source of information to researchers, planners and general public. January 25, 2010 v
- 8. vi
- 9. ACKNOWLEDGEMENTS The project “National Wetland Inventory & Assessment (NWIA)” is sponsored by Ministry of Environment & Forestry (MoEF), Govt. of India and executed by Space Applications Centre, ISRO, Ahmedabad. We are grateful to Dr. Ranganath R. Navalgund, Director, Space Applications Centre, for his encouragement to take up this challenging task and formulation of the project team for timely implementation. Earnest thanks are also due to Dr. Jai Singh Parihar, Dy. Director, Remote Sensing Applications Area, Space Applications Centre, for providing overall guidance and support to the project. The present Atlas for the state of Jammu & Kashmir is a part of the “National Wetland Atlas. This project has benefited from the wisdom of many people. It is a pleasure to acknowledge the contributions made by the wetland experts especially to Prof. C.K. Varshney, Former Dean, School of Environmental Sciences, Jawaharlal Nehru University, New Delhi, Prof. A.R. Yousuf, The University of Kashmir, Srinagar, Prof. Pradeeep Shrivastava, Head, Wetland Research Centre, Barakatullah University, Bhopal, Dr. Prikshit Gautam, Director, WWF-India, Dr. S. Narendra Prasad, Salim Ali Centre for Ornithology and Nature, Coimbtore and Dr. R.K. Suri, Additional Director, Ministry of Environment and Forests, Govt. of India, New Delhi, and the database experts from ISRO who participated in the peer Review meeting to finalise the “Wetland Classification System” followed in this project We acknowledge the positive role played by 16th SC-B (Standing Committee on Bioresources and Environment) of NNRMS (National Natural Resources Management System) meeting in formulating this project. We are extremely thankful to the members of the“Steering Committee” of the project, under the chairmanship of Dr E J James, Director – Water Institute, Karunya University, for their periodical review, critical comments and appreciation of the efforts by the project team. We are thankful to SC-B under the chairmanship of Secretary, MoEF, for periodical review of the progress of the project and guidance towards timely completion of the work. We acknowledge the valuable contributions made by Dr J K Garg, the then scientist of SAC for his active role in formulation of this project, co-authoring the procedure manual document. We are grateful to Dr G V Subramanyam, Adviser, MoEF, for his very active and positive role for implementation of the project. We are thankful to Dr Jag Ram, Director, MoEF and Dr Harendra Kharwal, MoEF for their support in budget and project management related issues. We acknowledge the support received from Dr P S Roy, Dy Director, NRSC and Dr S Sudhakar, Head, LRD, NRSC in terms of valuable suggestions and providing the geo-referenced image of NRC-LU&LC project for use as master image in this project. NWIA project team of Kashmir University, Srinagar and Space Applications Centre, Ahmedabad express their thanks to the project scientists/ Assistants who participated in field data collection, analysis of data and other activities of the project. We acknowledge the efforts put by Dr R D Shah, Mr Pragnesh Kumar Vaishnav and Ms Yatisha P Vaishnav, Geology Department, M G Science Institute, Ahmedabad in finalization of GIS database. We are thankful to the “Technical Review” team of SAC for critical comments and suggestion to finalise the Atlas. vii
- 10. viii
- 11. PROJECT TEAM Project Director: Dr. Sushma Panigrahy Space Applications Centre, ISRO, Ahmedabad Dr T. S. Singh Shri J. G. Patel The University of Kashmir, Srinagar Dr. Shakil A Romshoo Mr. Tanveer Qadri Mr. Irfan Rashid Mr. Mohammad Muslim ix
- 12. x
- 13. CONTENTS 1.0 INTRODUCTION 1.1 Wetlands 1.2 Mapping and geospatial techniques 1.3 Wetland Inventory of India 2.0 NATIONAL WETLAND INVENTORY AND ASSESSMENT 2.1 Wetland Classification System 2.2 GIS database contents 3.0 STUDY AREA 4.0 DATA USED 5.0 METHODOLOGY 5.1 Creation of spatial framework 5.2 Geo-referencing of satellite data 5.3 Mapping of wetlands 5.4 Conversion of raster (indices) into a vector layer 5.5 Generation of reference layers 5.6 Coding and attribute scheme 5.7 Map composition and output 6.0 ACCURACY ASSESSMENT 7.0 WETLANDS OF JAMMU AND KASHMIR: MAPS AND STATISTICS 7.1 District-wise Wetland Maps and Statistics 7.1.1 Kupwara 7.1.2 Baramula 7.1.3 Srinagar 7.1.4 Badgam 7.1.5 Pulwama 7.1.6 Anantnag 7.1.7 Leh (Ladakh) 7.1.8 Kargil 7.1.9 Doda 7.1.10 Udhampur 7.1.11 Poonch 7.1.12 Rajauri 7.1.13 Jammu 7.1.14 Kathua 7.1.15 Gilghit 7.1.16 Konu 7.1.17 Gilghit Wazara 7.1.18 Chilas 7.1.19 Muzzafarabad 7.1.20 Mirpur 8.0 MAJOR WETLAND TYPES OF JAMMU AND KASHMIR 9.0 IMPORTANT WETLANDS OF JAMMU AND KASHMIR 10.0 SOI SHEET-WISE WETLAND MAPS (selected sheets) References Annexure–I: Definitions of wetland categories used in the project. Annexure–II: Details of district information followed in the atlas List of Figures Figure 1: Spectral Signature of various targets Figure 2: Various land features as they appear in four spectral bands and in a typical three band FCC. Figure 3: Location map xi
- 14. Figure 4: Spatial framework of Jammu and Kashmir Figure 5: IRS P6 LISS-III coverage of Jammu and Kashmir Figure 6: IRS LISS-III FCC(Post-monsoon and Pre-monsoon) : Part of Jammu and Kashmir state Figure 7: Flow chart of the methodology used Figure 8: Steps in the extraction of wetland components Figure 9: Various combinations of the indices/spectral bands used to identify wetland components Figure 10:Type-wise wetland distribution in Jammu and Kashmir Figure 11: District-wise graphical distribution of wetlands List of Tables Table 1: Wetland Classification System and coding Table-2: Satellite data used Table 3: Qualitative turbidity ratings Table 4: Area estimates of wetlands in Jammu and Kashmir Table-5: District-wise wetland highlights Table 6: Area estimates of wetlands in Kupwara Table 7: Area estimates of wetlands in Baramula Table 8: Area estimates of wetlands in Srinagar Table 9: Area estimates of wetlands in Badgam Table 10: Area estimates of wetlands in Pulwama Table 11: Area estimates of wetlands in Anantnag Table 12: Area estimates of wetlands in Leh (Ladakh) Table 13: Area estimates of wetlands in Kargil Table 14: Area estimates of wetlands in Doda Table 15: Area estimates of wetlands in Udhampur Table 16: Area estimates of wetlands in Poonch Table 17: Area estimates of wetlands in Rajauri Table 18: Area estimates of wetlands in Jammu Table 19: Area estimates of wetlands in Kathua Table 20: Area estimates of wetlands in Gilghit Table 21: Area estimates of wetlands in Konu Table 22: Area estimates of wetlands in Gilghit Wazara Table 23: Area estimates of wetlands in Chilas Table 24: Area estimates of wetlands in Muzaffarabad Table 25: Area estimates of wetlands in Mirpur List of Plates Plate-1a and 1b: Major wetland types of Jammu and Kashmir Plate-2a,2b and 2c: Field photographs and ground truth data of different wetland types Plate 3: Chushul marshes Plate 4: Wetland map - 5 km buffer area of Chushul Marshes Plate 5: IRS LISS III FCC - 5 km buffer area of Chushul Marshes Plate 6: Dal Lake Plate 7: Wetland map - 5 km buffer area of Dal Lake Plate 8: IRS LISS III FCC - 5 km buffer area of Dal Lake Plate 9: Hokarsar Plate 10: Wetland map - 5 km buffer area of Hokarsar Plate 11: IRS LISS III FCC - 5 km buffer area of Hokarsar Plate 12: Pangong Tso Plate 13: Wetland map - 5 km buffer area of Pangong Tso Plate 14: IRS LISS III FCC - 5 km buffer area of Pangong Tso Plate 15: Surinsar & Mansar Lakes Plate 16: Wetland map - 5 km buffer area of Surinsar & Mansar Lakes Plate 17: IRS LISS III FCC - 5 km buffer area of Surinsar & Mansar Lakes Plate 18: Tso Kar Plate 19: Wetland map - 5 km buffer area of Tso Kar Plate 20: IRS LISS III FCC - 5 km buffer area of Tso Kar Plate 21: Tso Morari Plate 22: Wetland map - 5 km buffer area of Tso Morari Plate 23: IRS LISS III FCC - 5 km buffer area of Tso Morari Plate 24: Wular Lake Plate 25: Wetland map - 5 km buffer area of Wular Lake Plate 26: IRS LISS III FCC - 5 km buffer area of Wular Lake xii
- 15. 1.0 INTRODUCTION It is increasingly realized that the planet earth is facing grave environmental problems with fast depleting natural resources and threatening the very existence of most of the ecosystems. Serious concerns are voiced among scientists, planners, sociologists, politicians, and economists to conserve and preserve the natural resources of the world. One of the difficulties most frequently faced for decision making is lack of scientific data of our natural resources. Often the data are sparse or unconvincing, rarely in the form of geospatial database (map), thus open to challenges. Thus, the current thrust of every country is to have an appropriate geospatial database of natural resources that is based on unambiguous scientific methods. The wetland atlas of Jammu and Kashmir, which is part of the National Wetland Atlas of India, is an attempt in this direction. 1.1 Wetlands Wetlands are one of the crucial natural resources. Wetlands are areas of land that are either temporarily or permanently covered by water. This means that a wetland is neither truly aquatic nor terrestrial; it is possible that wetlands can be both at the same time depending on seasonal variability. Thus, wetlands exhibit enormous diversity according to their genesis, geographical location, water regime and chemistry, dominant plants and soil or sediment characteristics. Because of their transitional nature, the boundaries of wetlands are often difficult to define. Wetlands do, however, share a few attributes common to all forms. Of these, hydrological structure (the dynamics of water supply, throughput, storage and loss) is most fundamental to the nature of a wetland system. It is the presence of water for a significant period of time which is principally responsible for the development of a wetland. One of the first widely used classifications systems, devised by Cowardin et al., (1979), was associated to its hydrological, ecological and geological aspects, such as: marine (coastal wetlands including rock shores and coral reefs, estuarine (including deltas, tidal marshes, and mangrove swamps), lacustarine (lakes), riverine (along rivers and streams), palustarine ('marshy'- marshes, swamps and bogs). Given these characteristics, wetlands support a large variety of plant and animal species adapted to fluctuating water levels, making the wetlands of critical ecological significance. Utility wise, wetlands directly and indirectly support millions of people in providing services such as food, fiber and raw materials, storm and flood control, clean water supply, scenic beauty and educational and recreational benefits. The Millennium Ecosystem Assessment estimates conservatively that wetlands cover seven percent of the earth’s surface and deliver 45% of the world’s natural productivity and ecosystem services of which the benefits are estimated at $20 trillion a year (Source : www.MAweb.org). The Millennium Assessment (MA) uses the following typology to categorise ecosystem services: Provisioning services: The resources or products provided by ecosystems, such as food, raw materials (wood), genetic resources, medicinal resources, ornamental resources (skin, shells, flowers). Regulating services: Ecosystems maintain the essential ecological processes and life support systems, like gas and climate regulation, water supply and regulation, waste treatment, pollination, etc. Cultural and Amenity services: Ecosystems are a source of inspiration to human culture and education throughout recreation, cultural, artistic, spiritual and historic information, science and education. Supporting services: Ecosystems provide habitat for flora and fauna in order to maintain biological and genetic diversity. Despite these benefits, wetlands are the first target of human interference and are among the most threatened of all natural resources. Around 50% of the earth’s wetlands is estimated to already have disappeared worldwide over the last hundred years through conversion to industrial, agricultural and residential developments. Even in current scenario, when the ecosystem services provided by wetlands are better understood - degradation and conversion of wetlands continues. This is largely due to the fact that the ‘full value’ of ecosystem functions is often ignored in policy-making, plans and corporate evaluations of development projects. 1.2 Mapping and Geospatial technique To conserve and manage wetland resources, it is important to have inventory of wetlands and their catchments. The ability to store and analyse the data is essential. Digital maps are very powerful tools to achieve this. Maps relating the feature to any given geographical location has a strong visual impact. Maps, thus essential for monitoring and quantifying change over time scale, assist in decision making. The technique used in the preparation of map started with ground survey. The Survey of India (SOI) topographic maps are the earliest true maps of India showing various land use/cover classes including wetlands. Recent years have seen advances in mapping technique to prepare maps with much more information. Of particular importance is the remote sensing and geographic information system (GIS) technique. Remote sensing is 1
- 16. now recognized as an essential tool for viewing, analyzing, characterizing, and making decisions about land, water and atmospheric components. From a general perspective, remote sensing is the science of acquiring and analyzing information about objects or phenomena from a distance (Jensen, 1986; Lillesand and Keifer, 1987). Today, we define satellite remote sensing as the use of satellite borne sensors to observe, measure, and record the electromagnetic radiation (EMR) reflected or emitted by the earth and its environment for subsequent analysis and extraction of information. EMR sensors includes visible light, near-, mid- and far-infrared (thermal), microwave, and long-wave radio energy. The capability of multiple sources of information is unique to remote sensing. Of specific advantage is the spectral, temporal, and spatial resolution. Spectral resolution refers to the width or range of each spectral band being recorded. Since each target affects different wavelengths of incident energy differently, they are absorbed, reflected or transmitted in different proportions. Currently, there are many land resource remote sensing satellites that have sensors operating in the green, red, near infrared and short wave Infra red regions of the electromagnetic spectrum giving a definite spectral signature of various targets due to difference in radiation absorption and reflectance of targets. These sensors are of common use for land cover studies, including wetlands. Figure 1 shows typical spectral signature of few targets from green to SWIR region. Converted to image, in a typical false colour composite (FCC) created using NIR, red and green bands assigned as red, green and blue colour, the features become very distinct as shown in Figure 2. In FCC, the vegetation thus appears invariably red (due to high reflection in NIR from green leaves). Since the early 1960s, numerous satellite sensors have been launched into orbit to observe and monitor the earth and its environment. Most early satellite sensors acquired data for meteorological purposes. The advent of earth resources satellite sensors (those with a primary objective of mapping and monitoring land cover) occurred, when the first Landsat satellite was launched in July 1972. Currently, more than a dozen orbiting satellites of various types provide data crucial to improving our knowledge of the earth’s atmosphere, oceans, ice and snow, and land. Of particular interest to India is the indigenous series of satellites called Indian Remote Sensing (IRS) satellites. Since the launch of the first satellite IRS 1A in 1987, India has now a number of satellites providing data in multi-spectral bands with different spatial resolution. IRS P6/RESOURCESAT 1 is the current generation satellite that provides multi-spectral images in spatial resolution of 5.8 m (LISS IV), 23.5 m (LISS III) and 56m (AWiFS). Over the past few decades, Indian remote sensing data has been successfully used in various fields of natural resources ( Navalgund et al. 2002 ). Development of technologies like Geographic Information System (GIS) has enhanced the use of RS data to obtain accurate geospatial database. GIS specialises in handling related, spatially referenced data, combining mapped information with other data and acts as analytical tool for research and decision making. During the past few decades, technological advances in the field of satellite remote sensing (RS) sensors, computerized mapping techniques, global positioning system (GPS) and geographic information system (GIS) has enhanced the ability to capture more detailed and timely information about the natural resources at various scales catering to local, regional, national and global level study. Figure 1: Spectral Signature of various targets 2
- 17. Red Green NIR RED GREEN NIR SWIR Figure 2: Various land features as they appear in four spectral bands and in a typical three band FCC. 3
- 18. 1.3 Wetland Inventory of India India with its large geographical spread supports large and diverse wetland classes, some of which are unique. Wetlands, variously estimated to be occupying 1-5 per cent of geographical area of the country, support about a fifth of the known biodiversity. Like any other place in the world, there is a looming threat to the aquatic biodiversity of the Indian wetlands as they are often under a regime of unsustainable human pressures. Sustainable management of these assets therefore is highly relevant. Realising this, Govt. of India has initiated many appropriate steps in terms of policies, programmes and plans for the preservation and conservation of these ecosystems. India is a signatory to the Ramsar Convention for management of wetland, for conserving their biodiversity and wise use extending its scope to a wide variety of habitats, including rivers and lakes, coastal lagoons, mangroves, peatlands, coral reefs, and numerous human-made wetland, such as fish and shrimp ponds, farm ponds, irrigated agricultural land, salt pans reservoirs, gravel pits, sewage farms, and canals. The Ministry of Environment and Forests has identified a number of wetlands for conservation and management under the National Wetland Conservation Programme and some financial assistance is being provided to State Governments for various conservation activities through approval of the Management Action Plans. The need to have an updated map database of wetlands that will support such actions has long been realized. Mapping requires a standard classification system. Though there are many classification systems for wetlands in the world, the Ramsar classification system is the most preferred one. The 1971 Ramsar Convention on Wetlands of International Importance especially as Waterfowl Habitat is the oldest conservation convention. It owes its name to its place of adoption in Iran. It came into being due to serious decline in populations of waterfowl (mainly ducks) and conservation of habitats of migratory waterfowl. Convention provides framework for the conservation and ‘wise use’ of wetland biomes. Ramsar convention is the first modern global intergovernmental treaty on conservation and wise use of natural resources (www.ramsar.org). Ramsar convention entered into force in 1975. Under the text of the Convention (Article 1.1) wetlands are defined as: “areas of marsh, fen, peatland or water, whether natural or artificial, permanent or temporary, with water that is static or flowing, fresh, brackish or salt, including areas of marine water the depth of which at low tide does not exceed six meters”. In addition, the Convention (Article 2.1) provides that wetlands: “may incorporate riparian and coastal zones adjacent to the wetlands, and islands or bodies of marine water deeper than six meters at low tide lying within the wetlands”. The first scientific mapping of wetlands of India was carried out during1992-93 by Space Applications Centre (ISRO), Ahmedabad, at the behest of the Ministry of Environment and Forests (MoEF), Govt. of India using remote sensing data from Indian Remote Sensing satellites (IRS-Series). The mapping was done at 1:250,000 scale using IRS 1A LISS-I/II data of 1992-93 timeframe under the Nation-wide Wetland Mapping Project. Since, no suitable wetland classification existed for comprehensive inventory of wetlands in the country at that time, the project used a classification system based on Ramsar Convention definition of wetlands. The classification considers all parts of a water mass including its ecotonal area as wetland. In addition, fish and shrimp ponds, saltpans, reservoirs, gravel pits were also included as wetlands. This inventory put the wetland extent (inland as well as coastal) at about 8.26 million ha. (Garg et al, 1998). These estimates (24 categories) do not include rice/paddy fields, rivers, canals and irrigation channels. Further updating of wetland maps of India was carried out by SAC using IRS P6/Resourcesat LISS-III data of 2004-05 at 1:250000 scale. In recent years, a conservation atlas has been brought out by Salim Ali Centre for Ornithology and Natural History (SACON, 2004), which provide basic information required by stakeholders in both wetland habitat and species conservation. Space Applications Centre has carried out many pilot projects for development of GIS based wetland information system (Patel et al, 2003) and Lake Information system (Singh et al, 2003). 4
- 19. 2.0 NATIONAL WETLAND INVENTORY AND ASSESSMENT (NWIA) PROJECT Realising the importance of many small wetlands that dot the Indian landscape, it has been unanimously felt that inventory of the wetlands at 1:50,000 scale is essential. The task seemed challenging in view of the vast geographic area of our country enriched with diverse wetland classes. Space Applications Centre with its experience in use of RS and GIS in the field of wetland studies, took up this challenging task. This is further strengthened by the fact that guidelines to create geospatial framework, codification scheme, data base structure etc. for natural resources survey has already been well established by the initiative of ISRO under various national level mapping projects. With this strength, the National Wetland Inventory and Assessment (NWIA) project was formulated by SAC, which was approved and funded by MoEF. The main objectives of the project are: • To map the wetlands on 1:50000 scale using two date (pre and post monsoon) IRS LISS III digital data following a standard wetland classification system. • Integration of ancillary theme layers ( road, rail, settlements, drainage, administrative boundaries) • Creation of a seamless database of the states and country in GIS environment. • Preparation of State-wise wetland atlases The project was initiated during 2007. The first task was to have a classification system that can be used by different types of users while amenable to database. An expert/peer group was formed and the peer review was held at SAC on June 2007 where wetland experts and database experts participated and finalized the classification system. It was agreed to follow the classification system that has been used for the earlier project of 1:250,000 scale, with slight modification. Modified National Wetland Classification system for wetland delineation and mapping comprise 19 wetland classes which are organized under a Level III hierarchical system. The definition of each wetland class and its interpretation method was finalized. The technical/procedure manual was prepared as the standard guideline for the project execution across the country (Garg and Patel, 2007). The present atlas is part of the national level data base and deals with the state of Jammu and Kashmir. 2.1 Wetland Classification System In the present project, Modified National Wetland Classification system is used for wetland delineation and mapping comprising 19 wetland classes which are organized under a Level III hierarchical system (Table 1). Level one has two classes: inland and coastal, these are further bifurcated into two categories as: natural and man-made under which the 19 wetland classes are suitably placed. Two date data pertaining to pre-monsoon and post monsoon was used to confirm the classes. Wetlands put to agriculture use in any of the two dates are not included as wetland class. Definitions of wetland categories used in the project is given in Annexure-I. 2.2.1 Spatial Framework and GIS Database The National Spatial Framework) (NSF) has been used as the spatial framework to create the database (Anon. 2007) . The database design and creation standard suggested by NRDB/NNRMS guidelines is followed. Feature codification scheme for every input element has been worked out keeping in view the nationwide administrative as well as natural hierarchy (State-district- within the feature class for each of the theme. All data elements are given a unique name, which are self explanatory with short forms. Following wetland layers are generated for each inland wetland: Wetland extent: As wetlands encompass open water, aquatic vegetation (submerged, floating and emergent), the wetland boundary should ideally include all these. Satellite image gives a clear signature of the wetland extent from the imprint of water spread over the years. Water spread: There are two layers representing post-monsoon and pre-monsoon water spread during the year of data acquisition. 5
- 20. Aquatic vegetation spread: The presence of vegetation in wetlands provides information about its trophic condition. As is known, aquatic vegetation is of four types, viz. benthic, submerged, floating, and emergent. It is possible to delineate last two types of vegetation using optical remote sensing data. A qualitative layer pertaining to presence of vegetation is generated for each season (as manifested on pre- monsoon and post-monsoon imagery). Turbidity level of open water: A layer pertaining to a qualitative turbidity rating is generated. Three qualitative turbidity ratings ( low, medium and high) is followed for pre and post-monsoon turbidity of lakes, reservoirs, barrages and other large wetlands. Small wetlands (smaller than minimum mappable unit) are mapped as point features. Base layers like major road network, railway, settlements, and surface drainage are created (either from the current image or taken from other project data base). In the case of coastal wetlands only wetland extent is given. Table 1: Wetland Classification System and coding Wettcode Level I Level II Level III 1000 Inland Wetlands 1100 Natural 1101 Lakes 1102 Ox-Bow Lakes/ Cut-Off Meanders 1103 High altitude Wetlands 1104 Riverine Wetlands 1105 Waterlogged 1106 River/stream 1200 Man-made 1201 Reservoirs/ Barrages 1202 Tanks/Ponds 1203 Waterlogged 1204 Salt pans 2000 Coastal Wetlands 2100 Natural 2101 Lagoons 2102 Creeks 2103 Sand/Beach 2104 Intertidal mud flats 2105 Salt Marsh 2106 Mangroves 2107 Coral Reefs 2200 Man-made 2201 Salt pans 2202 Aquaculture ponds 6
- 21. 3.0 STUDY AREA Jammu and Kashmir is located in the northern part of the Indian sub continent in the vicinity of the Karakoram and western mountain ranges. It falls in the great northwestern complex of the Himalayan Ranges with marked relief variation, snow-capped summits, antecedent drainage and complex geological structure. Wetlands both lotic and lentic are found here. The total area of the state of Jammu and Kashmir is about 2,22,236 sq. km. Kashmir comprises three natural divisions, namely, Jammu, Kashmir and Ladakh. Broadly, the state of Jammu and Kashmir comprises three distinct climatic regions: cold arid desert areas of Ladakh, temperate Kashmir Valley, and the humid sub-tropical region of Jammu. Mean monthly temperature is lowest in January and highest in July except in Jammu where highest temperature is experienced in June. Mean monthly temperature in January varies from –17°C at Drass to 14°C at Jammu; Kargil and Leh being other stations of below freezing average. The Jhelum is the main waterway of the valley of Kashmir. It rises from a spring called Verinag from where a number of tributaries join the Jhelum and make it navigable from Khannabal to Wular Lake. Its total length in the valley is 177 km. The Ravi is the smallest river leaves the Himalayas at Basoli and passes close to Kathua near Madhopur where it enters the plain of the Punjab. The Tawi River, draining the outer hill region, flows around the city of Jammu. The Chenab river rises in the Himalayan contour of Lahul and Spiti. Two streams, more or less parallel, the Chandra and the Bhaga, form the Chandrabhaga, or the Chenab. It drains the eastern section of the southern slope of Pir Panjal. The Indus is another important river, which originates in Tibet near Kashmir border. A considerable portion of this river flows through our neighboring nations. Kashmir valley is known as the land of wetlands. Noted among the lakes of Kashmir valley are Sheeshnag, Manasbal, Wular lake , Dal lake, Hokersar, Nilnag, Gangbal, Vaishan sar, Kishan sar, Kausarnag, Khanpur and Waskur. In Ladakh region, Large number of lakes are found in the Ladakh region. Most of them are of glacial origin. Tsokar, Tso Moriri and Pangong Tso are main wetland of Ladakh region. The territory of the state is divided into seven physiographic zones closely associated with the structural components of the western Himalayas. (Source: http://www.indianembassy.org/policy/kashmir/kashmir-MEA, and http://www.jammu-kashmir.com /basicfacts) The spatial framework was prepared using 15’ x 15’ grid. The state is covered by 420 Survey of India topographic maps on 1:50,000 scale that form the spatial frame work for mapping (Figure 4). Total number of districts is twenty. The detailed information regarding the district name, district boundary, and the district code used in data base is given in Annexure - II. The district code followed in this is as per the census data base code. 7
- 22. Figure 3: Location Map Figure 4: Spatial Framework of Jammu and Kashmir 8
- 23. 4.0 DATA USED Remote sensing data IRS P6 LISS III data was used to map the wetlands. IRS P6 LISS III provides data in 4 spectral bands; green, red, Near Infra Red (NIR) and Short wave Infra Red (SWIR), with 23.5 m spatial resolution and 24 day repeat cycle. The spatial resolution is suitable for 1:50,000 scale mapping. The state of Jammu and Kashmir is covered in 28 (Twenty eight) IRS LISS III scenes (Figure 5). Two date-data, one acquired during pre- monsoon (March–July) and post-monsoon (September-January) were used to capture hydrological variability of the wetlands (Table-2). Figure 5 shows the overview of the part of Jammu and Kashmir valley as seen in the LISS III FCC of post- monsoon pre-monsoon data respectively. Ground truth data Remote sensing techniques require certain amount of field observations called “ground truth” in order to develop interpretation key and to enhance thematic accuracy. Such work involves visiting a number of test sites, usually taking the satellite data. The location of the features is recorded using the GPS. The standard Performa as per the NWIA manual was used to record the field data. Field photographs are also taken to record the water quality (subjective), status of aquatic vegetation and water spread. All field verification work has been done during 2008-2009. Other data Survey of India topographical maps (SOI) were used for reference purpose. Lineage data of National Wetland Maps at 1:250,000 scale was used for reference. 89-44 90-44 91-44 92-44 93-44 89-45 90-45 91-45 92-45 93-45 94-45 95-45 96-45 97-45 90-46 91-46 92-46 93-46 94-46 95-46 96-46 97-46 90-47 91-47 92-47 93-47 94-47 95-47 96-47 97-47 92-48 93-48 94-48 95-48 96-48 97-48 Figure 5: IRS P6 LISS-III coverage (path-row) of Jammu and Kashmir 9
- 24. 5.0 METHODOLOGY The methodology to create the state level atlas of wetlands is adhered to NWIA technical guidelines and procedure manual (Garg and Patel, 2007). The overview of the steps used is shown in Figure 7. Salient features of methodology adopted are • Generation of spatial framework in GIS environment for database creation and organisation. • Geo-referencing of satellite data • Identification of wetland classes as per the classification system given in NWIA Manual and mapping of the classes using a knowledge based digital classification and onscreen interpretation • Generation of base layers (rail, road network, settlements, drainage, administrative boundaries) from satellite image and ancillary data. • Mosaicing/edge matching to create district and state level database. • Coding of the wetlands following the standard classification system and codification as per NWIA manual. • Preparation of map compositions and generation of statistics • Outputs on A3 size prints and charts for atlas. Work was carried out using ERDAS Imagine, Arc/Info and Arcgis softwares. Table-2: Satellite data (LISS III) used* S. No. Path-Raw Date of Acquisition Post monsoon Pre Monsoon 1. 90-44 October 28, 2006 April 14, 2007 2. 90-45 October 04, 2006 August 12, 2007 3. 91-44 October 09, 2006 May 13, 2007 4. 91-45 October 09, 2006 May 13, 2007 5. 91-46 October 09, 2006 May 13, 2007 6. 91-47 October 09, 2006 May 13, 2007 7. 92-44 November 07, 2006 July 29, 2007 8. 92-45 November 07, 2006 July 29, 2007 9. 92-46 October 14, 2006 May 18, 2007 10. 92-47 October 14, 2006 May 18, 2007 11. 93-45 January 23, 2007 July 10, 2007 12. 93-46 September 25, 2006 April 29, 2007 13. 93-47 December 30, 2006 April 29, 2007 14. 93-48 October 19, 2007 May 23, 2007 15. 94-45 October 24, 2006 April 10, 2007 16. 94-46 October 24, 2006 April 10, 2007 17. 94-47 October 24, 2006 April 10, 2007 18. 95-45 December 16, 2006 April 15, 2007 19. 95-46 October 05, 2006 April 15, 2007 20. 95-47 October 05, 2006 April 15, 2007 21. 96-45 November 03, 2006 March 27, 2007 22. 96-46 October 10, 2006 May 14, 2007 23. 96-47 October 10, 2006 May 14, 2007 24. 96-48 October 10, 2006 May 14, 2007 25. 97-45 October 15, 2006 April 01, 2007 26. 97-46 October 15, 2006 April 01, 2007 27. 97-47 September 21, 2006 June 12, 2007 28. 97-48 October 15, 2006 July 06, 2007 * Wherever, cloud cover is encountered in any particular scene, LISS III and LANDSAT ETM data of 2005-6 are also used. 10
- 25. October 14, 2006 May 18, 2007 Figure 6: IRS LISS-III FCC (Post-monsoon and Pre-monsoon): Part of Jammu and Kashmir state 11
- 26. 5.1 Creation of spatial framework This is the most important task as the state forms a part of the national frame work and is covered in multiple map sheets. To create NWIA database, NNRMS/NRDB standards is followed and four corners of the 1:50,000 (15’ x 15’) grid is taken as the tics or registration points to create each map taking master grid as the reference. Spatial framework details are given in NWIA manual (Garg and Patel 2007). The spatial framework for Jammu and Kashmir state is shown in Figure 4. 5.2 Geo-referencing of satellite data In this step the raw satellite images were converted to specific map projection using geometric correction. This is done using archived geometrically corrected LISS III data (ISRO-NRC-land use / land cover project ). Standard image processing software was used for geo-referencing. First one date data was registered with the archived image. The second date data was then registered with the first date data. 5.3 Mapping of wetlands The mapping of wetlands was done following digital classification and onscreen visual interpretation. Wetlands features include open water, surface aquatic vegetation (floating and emergent), quality of water (subjective) and the boundary of the wetland. In the present project, five indices known in literature that enhances various wetland characteristics were used (McFeetres, 1986; Xu Hanqiu, 2006; Lacaux et al, 2007; Townshend and Justice, 1986; Tucker and Sellers, 1986) as given below: i) Normalised Difference Water Index (NDWI) = (Green-NIR) / (Green + NIR) ii) Modified Normalised Difference Water Index (MNDWI) = (Green-MIR) / (Green + MIR) iii) Normalised Difference Vegetation Index (NDVI) = (NIR - Red) / (NIR + Red) iv) Normalised Difference Pond Index (NDPI) = (MIR – Green / MIR + Green) v) Normalised Difference Turbidity Index (NDTI) = (Red – Green) / (Red + Green) The indices were generated using standard image processing software, stacked as layers. (Figure 8). Various combinations of the indices/spectral bands were used to identify the wetland features as shown in Figure 9. The following indices were used for various layer extractions: • Extraction of wetland extent : MNDWI, NDPI and NDVI image was used to extract the wetland boundary through suitable hierarchical thresholds. • Extraction of open water : MNDWI was used within the wetland mask to delineate the water and no-water areas. • Extraction of wetland vegetation : NDPI and NDVI image was used to generate the vegetation and no-vegetation areas within a wetland using a suitable threshold. • Turbidity information extraction : NDTI and MNDWI image was used to generate qualitative turbidity level (high, moderate and low) based on signature statistics and standard deviations. In the False Colour Composite (FCC) these generally appear in different hues (Table-3). Table 3: Qualitative turbidity ratings Sr. No. Qualitative Turbidity Conditional criteria Hue on False Colour Composite (FCC) 1. Low > +1σ Dark blue/blackish 2. Moderate > -1σ to <= +1σ Medium blue 3. High/Bottom reflectance <= µ - 1σ Light blue/whitish blue 12
- 27. IRS P6 LISS III pre and post-monsoon data Spatial frame work Legacy data Geo-referenced images Admin. Boundaries SOI topographic maps (State, District) On-screen interpretation/ Digital analysis Ground truth Morphometric Physical Biological Base layers (Wetland extent) (Wetland type) (Wetland vegetation) (Road, Settlement, drainage) Quality Check GIS DATABASE (Wetland layers, Base layers) Accuracy Assessment/ Quality Check NWIA Database Organisation (District, State, Country) Analysis Atlases/Report Figure 7: Flow chart of the methodology used Figure 8: Steps in the extraction of wetland components 13
- 28. 5.4 Conversion of the raster (indices) into a vector layer The information on wetland extent, open water extent, vegetation extent and turbidity information was converted into vector layers using region growing properties or on-screen digitisation. 5.5 Generation of reference layers Base layers like major rail, road network, settlements, drainage are interpreted from the current image or taken from other project database. The administrative boundaries (district, state) are taken from the known reference data. 5.6 Coding and attribute scheme Feature codification scheme for every input element has been worked out keeping in view the nationwide administrative as well as natural hierarchy (State-district-taluka) within the feature class for each of the theme. All data elements are given a unique name/code, which are self explanatory with short forms. 5.7 Map composition and output Map composition for atlas has been done at district and state level. A standard color scheme has been used for the wetland classes and other layers. The digital files are made at 1:50,000 scale. The hard copy outputs are taken on A3 size. 6.0 ACCURACY ASSESSMENT A comprehensive accuracy assessment protocol has been followed for determining the quality of information derived from remotely sensed data. Accuracy assessment involves determination of thematic (classification) as well as locational accuracy. In addition, GIS database(s) contents have been also evaluated for accuracy. To ensure the reliability of wetland status data, the project adhered to established quality assurance and quality control measures for data collection, analysis, verification and reporting. This study used well established, time-tested, fully documented data collection conventions. It employed skilled and trained personnel for image interpretation, processing and digital database creation. All interpreted imageries were reviewed by technical expert team for accuracy and code. The reviewing analyst adhered to all standards, quality requirements and technical specifications and reviewed 100 percent of the work. The various stages of quality check include: 1. Image-to-Image Geo-referencing/Data generation 2. Reference layer preparation using NWIA post monsoon and pre-monsoon LISS-III data. 3. Wetland mapping using visual/digital interpretation techniques. 4. Geo-data base creation and organization 5. Output products. 6.1 Data verification and quality assurance of output digital data files All digital data files were subjected to rigorous quality control inspections. Digital data verification included quality control checks that addressed the geospatial correctness, digital integrity and some cartographic aspects of the data. Implementation of quality checks ensured that the data conformed to the specified criteria, thus achieving the project objectives. There were tremendous advantages in using newer technologies to store and analyze the geographic data. The geospatial analysis capability built into this study provided a complete digital database to better assist analysis of wetland change information. All digital data files were subjected to rigorous quality control inspections. Automated checking modules incorporated in the geographic information system (Arc/GIS) were used to correct digital artifacts including polygon topology. Additional customized data inspections were made to ensure that the changes indicated at the image interpretation stage were properly executed. 14
- 29. Open water MNDWI NDPI NDVI Useful for wetland boundary extraction/delineation G R NIR Vegetation Open water NDWI NDVI NDPI Useful for wetland vegetation & open water features G R SWIR Low Part of Tso Kar, IRS LISS III data, 5 October 2006 MNDWI MNDWI NDTI Useful for qualitative turbidity delineation Figure 9: Various combinations of the indices/spectral bands used to identify wetland components 15
- 30. 16
- 31. MAPS AND STATISTICS 17
- 32. 18
- 33. 7.0 WETLANDS OF JAMMU AND KASHMIR: MAPS AND STATISTICS Area estimates of various wetland categories and structural components for Jammu and Kashmir have been carried out using GIS database. Structural components include wetland morphometry, wetland boundary, water-spread, aquatic vegetation and turbidity. A variety of wetland types were observed in the State of Jammu and Kashmir. Most of them are of glacial origin and mainly associated with riverine system. Total 1411 wetlands are mapped in the state occupying 389261 ha area. In addition, 2240 small wetlands (< 2.25 ha) have been demarcated as point features. These are mainly high altitude wetlands. The Natural wetlands are in dominance in the state occupying around 93.0 % area. The major natural wetlands apart from Rivers/stream are High altitude wetlands. Total 1143 such wetlands are mapped having an area of 109170 ha (27.88%). There are 36 Lakes/ponds (3.5%). Reservoir/Barrage is the major man made wetland type. Total 4 of this category are mapped having 25132 ha area (6.4%). Detailed statistics is given in Table-4. Graphical distribution of wetland type is shown in Figure 10. Area under aquatic vegetation varied from 19826 ha to 15434 ha during post and pre monsoon season respectively. Vegetation is mainly found in Lakes/Ponds, Riverine wetlands. The open water area of these wetlands does not show significant seasonal variation (301818 ha during post-monsoon season and 314209 ha in pre-monsoon season). Most of the wetlands are oligotrophic in nature and have low amount of particulate matter. Qualitative turbidity of water is in general low in both the seasons (Table-4). Table 4: Area estimates of wetlands in Jammu and Kashmir Area in ha Open Water Number Total % of Sr. Post- Pre- Wettcode Wetland Category of Wetland wetland No. monsoon monsoon Wetlands Area area Area Area 1100 Inland Wetlands - Natural 1 1101 Lakes/Ponds 36 13762 3.52 3371 6821 2 1103 High altitude wetlands 1143 109170 27.88 105110 105072 3 1104 Riverine wetlands 88 9594 2.45 153 1639 4 1106 River/Stream 138 231597 59.16 170063 175550 1200 Inland Wetlands -Man-made 5 1201 Reservoirs/Barrages 4 25132 6.42 23115 25121 6 1202 Tanks/Ponds 2 6 0.00 6 6 Sub-Total 1411 389261 99.43 301818 314209 Wetlands (<2.25 ha) 2240 2240 0.57 - - Total 3651 391501 100.00 301818 314209 Area under Aquatic Vegetation 19826 15434 Area under turbidity levels Low 300480 306201 Moderate 1295 1644 High 43 6364 Figure 10: Type-wise wetland distribution in Jammu and Kashmir 19
- 34. 7.1 DISTRICT-WISE WETLAND MAPS AND STATISTICS The total numbers of districts in the state are twenty, with Leh having largest geographic area and Budgam, the lowest (Table-5). Leh has the highest area under wetlands (51.9%). This is mainly due to the large number of high altitude wetlands found in the area. Konu has the lowest wetland share (0.40%). Baramula, Jammu, Katua, Gilgit, and Mirpur are the districts having more than 4.0% wetlands. Geographic area wise, Kathua has highest percentage (8.13%) and Gilghit Wazara has lowest (0.45%). Table-5 & Figure 11 shows district-wise wetland distribution. District-wise wetland area estimates is given in Table-5. & Figure 11 shows district-wise wetland distribution. Leh can be called as the land of high altitude wetlands. Total 485 such wetlands are mapped with 202755 ha area (out of total 1143 in the state). In addition, 440 small (<2.25 ha) wetlands are identified and marked as points belong to high altitude type. Baramulla has highest share of Lake/pond wetland type. Though only 2 Lake/pond type are there, the area occupied is 11273 ha (out of total 13762). This is mainly due to the presence of Wular Lake, the largest fresh water lake. Mirpur has the largest reservoir with 19146 ha area which is used for irrigation and hydropower generation. The results of individual districts (map and statistics) are given in the following section. The numbering of the districts followed for this is as per Annexure.II. Table-5: District-wise Wetland Area Estimates Sr. Geographic Area* Wetland Area % of total % of district District No. (sq. km) (ha) wetland area geographic area 1 Kupwara 3028 2384 0.61 0.79 2 Baramula 5183 16360 4.18 3.16 3 Srinagar 1865 10081 2.57 5.41 4 Badgam 1267 3402 0.87 2.69 5 Pulwama 1456 3561 0.91 2.45 6 Anantnag 3986 6875 1.76 1.72 7 Leh (Ladakh) 105306 203195 51.90 1.93 8 Kargil 16296 10380 2.65 0.64 9 Doda 11683 5667 1.45 0.49 10 Udhampur 4580 8326 2.13 1.82 11 Poonch 3826 7013 1.79 1.83 12 Rajauri 2628 4910 1.25 1.87 13 Jammu 3017 19638 5.02 6.51 14 Kathua 2675 21740 5.55 8.13 15 Gilghit 34380 29844 7.62 0.87 16 Konu 2773 1547 0.40 0.56 17 Gilghit Wazara 6098 2743 0.70 0.45 18 Chilas 4276 2200 0.56 0.51 19 Muzzafarabad 3711 4105 1.05 1.11 20 Mirpur 4077 27529 7.03 6.75 TOTAL 222111 391500 100.00 1.76 * Source: GIS area Figure 11: District-wise graphical distribution of wetlands 20
- 35. 21
- 36. 22
- 37. 23
- 38. 7.1.1 Kupwara Kupwara district is situated at an altitude of 5,300 feet above sea level and is the northern-most district of the Kashmir valley. This district is endowed with rich dense forests. The river ‘Kishan Ganga’ originating from the Himalayas flows through the outer areas of the district from east to west. The geographical area of the district is 3,028 sq. km. with three tehsils, namely, Handwara, Karnah and Kupwara. Total wetland area of the district is 2384 ha. River/stream is the major wetland type of the district with 2212 ha area and accounting for around 93 per cent wetland area of the district. Lakes/ponds are 18 in number and account for around 4 percent of the total wetland area of the district. No High altitude wetlands observed. In addition, 70 small wetlands (<2.25 ha area) are identified. The distribution of wetlands is mainly dominated in south and southeastern part of the district. The detail wetland statistics of the district is given in Table 6. Aquatic vegetation is observed mainly in Lakes/pond wetlands and covers an area of 67 ha in post monsoon season and 44 ha in pre-monsoon season. There is slight seasonal variation in open water in the rivers, which could be attributed to seasonal variations in melting of glaciers. Qualitative turbidity of open water is mainly low in both the seasons. Table 6: Area estimates of wetlands in Kupwara Area in ha Open Water Number Total % of Sr. Post- Pre- Wettcode Wetland Category of Wetland wetland No. monsoon monsoon Wetlands Area area Area Area 1100 Inland Wetlands - Natural 1 1101 Lakes/Ponds 18 96 4.03 33 53 2 1102 Ox-bow lakes/ Cut-off meanders - - - - - 3 1103 High altitude wetlands - - - - - 4 1104 Riverine wetlands 2 6 0.25 6 5 5 1105 Waterlogged - - - - - 6 1106 River/Stream 5 2212 92.79 1721 2052 1200 Inland Wetlands -Man-made 7 1201 Reservoirs/Barrages - - - - - 8 1202 Tanks/Ponds - - - - - 9 1203 Waterlogged - - - - - 10 1204 Salt pans - - - - - Sub-Total 25 2314 97.06 1760 2110 Wetlands (<2.25 ha) 70 70 2.94 - - Total 95 2384 100.00 1760 2110 Area under Aquatic Vegetation 67 44 Area under turbidity levels Low 1743 2074 Moderate 17 36 High - - 24
- 39. 25
- 40. 26
- 41. 27
- 42. 7.1.2 Baramula Baramulla district completely surrounds the district Kupwara and shares the border with Muzzafarabad at two places in the west as well as in the northeast. It also shares its border with Srinagar, Budgam and Poonch districts in the south and with Kargil in the east. The average height of the district is 5187 feet above sea level. The district has a flat topography and scenic beauty. The geographical area of the district is 5,183 sq. km. with six tehsils, namely, Bandipur, Sonawari, Sopore, Baramulla, Gulmarg and Uri Sopore tehsil is very famous for its apples. Total wetland area of the district is 16360 ha. There are only two wetlands under the wetland category of Lake/ponds but they contribute almost 69 per cent of wetland area of the state. This is mainly due to the large Wulur Lake situated in this district. River/stream is the second major wetland type occupying 3146 ha area and contributes around 19 per cent wetland area of the district. Riverine wetland occupied 9.0% area. There are 38 high altitude wetlands in the district and the area under this category is 448 ha. There are no man- made wetlands mapped in the district. Total 15 small wetlands (<2.25 ha) are identified. The wetland statistics of the district is given in Table 7. Aquatic vegetation is observed mainly in Lake/pond and Riverine wetlands. The area under aqatic vegetation is more (10922 ha) in post monsoon season than in pre-monsoon season (7532 ha). There is not much seasonal fluctuation in open water in rivers but lake/ ponds show significant variation. The qualitative turbidity of water is in general low in post monsoon, but high turbidity is observed in case of Lake/pond in pre monsoon. Table 7: Area estimates of wetlands in Baramula Area in ha Open Water Number Total % of Sr. Post- Pre- Wettcode Wetland Category of Wetland wetland No. monsoon monsoon Wetlands Area area Area Area 1100 Inland Wetlands - Natural 1 1101 Lakes/Ponds 2 11273 68.91 1710 4966 2 1102 Ox-bow lakes/ Cut-off meanders - - - - - 3 1103 High altitude wetlands 38 448 2.74 448 448 4 1104 Riverine wetlands 29 1478 9.03 41 334 5 1105 Waterlogged - - - - - 6 1106 River/Stream 13 3146 19.23 2883 3059 1200 Inland Wetlands -Man-made 7 1201 Reservoirs/Barrages - - - - - 8 1202 Tanks/Ponds - - - - - 9 1203 Waterlogged - - - - - 10 1204 Salt pans - - - - - Sub-Total 82 16345 99.91 5082 8807 Wetlands (<2.25 ha) 15 15 0.09 - -0 Total 97 16360 100.00 5082 8807 Area under Aquatic Vegetation 10922 7532 Area under turbidity levels Low 5058 3523 Moderate 8 15 High 16 5269 28
- 43. 29
- 44. 30
- 45. 31
- 46. 7.1.3 Srinagar Srinagar district shares its border with Baramulla, Budgam, Pulwama, Anantnag and Kargil districts from the west to east. The valley is surrounded by the Hurmukh mountain (16,903 feet) in the east, Tosh Maidan (4,000 feet) in the north and Snony Kazi Nag (12,125 feet) in the northwest and also the Mahadev Mountain. The valley is a land of lakes, clear streams and green meadows. The river Jhelum dissects the district diagonally from the southeast to the northwest. Srinagar is the state’s summer capital. The geographical area of the district is 1,865 sq. km. with two tehsils, namely, Srinagar and Ganderbal. Total 76 wetlands are mapped and 23 small wetland (< 2.25 ha) are identified and demarcated as point feature. The total area of wetlands is 10081ha area. The wetland types found are Lakes/Ponds, high altitude lakes, riverine wetlands, and rivers. The dominant type of wetland in the district is riverine wetlands, which contribute around 54 per cent area of the state. There are 14 Lake/pond contributing 21.76%. There is a single man made tank/ pond located in the northern part of the Dal lake. It is used mainly to trap the sediments coming through the steam/river and domestic sewage. The detail of wetland statistics of the district is given in Table 8. Aquatic vegetation is observed in Riverine wetlands and Lake/pond. Area under aquatic vegetation is 6254 ha in post-monsoon and 4999 ha in pre-monsoon. Seasonal fluctuations of open water in wetlands are not significant, except in case of Riverine wetlands, which varied from 14 ha in post monsoon to 1001 ha in pre monsoon. Qualitative turbidity of open water ranged from low to medium during post monsoon, but ranged from high to low during pre monsoon. Table 8: Area estimates of wetlands in Srinagar Area in ha Open Water Number Total % of Sr. Post- Pre- Wettcode Wetland Category of Wetland wetland No. monsoon monsoon Wetlands Area area Area Area 1100 Inland Wetlands - Natural 1 1101 Lakes/Ponds 14 2194 21.76 1429 1603 2 1102 Ox-bow lakes/ Cut-off meanders - - - - - 3 1103 High altitude wetlands 29 392 3.89 392 392 4 1104 Riverine wetlands 25 5457 54.13 14 1001 5 1105 Waterlogged - - - - - 6 1106 River/Stream 7 2012 19.96 1910 1679 1200 Inland Wetlands -Man-made 7 1201 Reservoirs/Barrages - - - - - 8 1202 Tanks/Ponds 1 3 0.03 3 3 9 1203 Waterlogged - - - - - 10 1204 Salt pans - - - - - Sub-Total 76 10058 99.77 3748 4678 Wetlands (<2.25 ha) 23 23 0.23 - - Total 99 10081 100.00 3748 4678 Area under Aquatic Vegetation 6254 4999 Area under turbidity levels Low 2523 2283 Moderate 1207 1388 High 18 1007 32
- 47. 33
- 48. 34
- 49. 35
- 50. 7.1.4 Budgam Budgam district is centrally located in the Kashmir valley. It is bounded by Srinagar in the northeast, south and west by Poonch and in the north and northwest by Baramulla. Although the district has several high mountains, its average height is just 5,281 feet above sea level. The geographical area of the district is 1,267 sq. km. with three tehsils, namely, Chadura, Budgam and Beerwah. Agriculture is the main occupation of the people. There are 32 wetlands mapped and 48 small wetlands (>2.25 ha) identified with wetland area of 3402 ha. The wetland types found are high altitude lakes, riverine wetlands, and rivers. The dominant type of wetland found in the district is riverine wetlands, which contribute around 57 per cent wetland area of the state. High altitude lakes are 11 but their size is smaller compare to lakes/ponds found in plain areas of the districts. A detail of the wetland statistics of the district is given in Table 9. Around 1927 ha and 1914 ha area are under vegetation during post and pre monsoon season respectively. This is mainly due to vegetation observed in case of Riverine wetlands. Seasonal fluctuations of open water spread of River/stream and high altitude wetlands do not show variation. However, the open water spread of Riverine Wetlands is high (99 ha) during pre monsoon and low (26 ha) during post monsoon. Qualitative turbidity of open water is in general low in both the seasons. Table 9: Area estimates of wetlands in Budgam Area in ha Open Water Number Total % of Sr. Post- Pre- Wettcode Wetland Category of Wetland wetland No. monsoon monsoon Wetlands Area area Area Area 1100 Inland Wetlands - Natural 1 1101 Lakes/Ponds - - - - - 2 1102 Ox-bow lakes/ Cut-off meanders - - - - - 3 1103 High altitude wetlands 11 150 4.41 150 150 4 1104 Riverine wetlands 9 1932 56.79 26 99 5 1105 Waterlogged - - - - - 6 1106 River/Stream 12 1272 37.39 1244 1244 1200 Inland Wetlands -Man-made 7 1201 Reservoirs/Barrages - - - - - 8 1202 Tanks/Ponds - - - - - 9 1203 Waterlogged - - - - - 10 1204 Salt pans - - - - - Sub-Total 32 3354 98.59 1420 1493 Wetlands (<2.25 ha) 48 48 1.41 - - Total 80 3402 100.00 1420 1493 Area under Aquatic Vegetation 1927 1914 Area under turbidity levels Low 1400 1400 Moderate 20 93 High - - 36
- 51. 37
- 52. 38
- 53. 39
- 54. 7.1.5 Pulwama Pulwama district is situated in the southeastern part of the valley. It shares its borders with Srinagar and Budgam in the northwest and is bounded by the Anantnag district in the south and east. The geographical area of the district is 1,456 sq. km. with three tehsils, namely, Shopian, Pulwama and Tral. Total 15 wetlands are mapped and 251 small wetlands (>2.25 ha) are identified with total wetland area of the district as 3561 ha. River /steam type contributed about 83.1 per cent wetland area of the district. Riverine wetlands contribute around 9.7 per cent wetland area of the district. A detail of the wetland statistics of the district is given in Table 10. Presence of aquatic vegetation is observed in Riverine wetlands and the area under aquatic vegetation is 338 ha in post-monsoon and 259 ha in pre-monsoon. Seasonal fluctuations of water in Rivers/stream are not significant. In case of Riverine wetlands, the open water spread is high in pre monsoon. Low turbidity is found in most of the wetlands and covered an area of around 1700 ha in both the seasons. Table 10: Area estimates of wetlands in Pulwama Area in ha Open Water Number Total % of Sr. Post- Pre- Wettcode Wetland Category of Wetland wetland No. monsoon monsoon Wetlands Area area Area Area 1100 Inland Wetlands - Natural 1 1101 Lakes/Ponds - - - - - 2 1102 Ox-bow lakes/ Cut-off meanders - - - - - 3 1103 High altitude wetlands 2 4 0.11 4 4 4 1104 Riverine wetlands 7 347 9.74 10 88 5 1105 Waterlogged - - - - - 6 1106 River/Stream 5 2956 83.01 1728 1709 1200 Inland Wetlands -Man-made 7 1201 Reservoirs/Barrages - - - - - 8 1202 Tanks/Ponds 1 3 0.08 3 3 9 1203 Waterlogged - - - - - 10 1204 Salt pans - - - - - Sub-Total 15 3310 92.95 1745 1804 Wetlands (<2.25 ha) 251 251 7.05 - - Total 266 3561 100.00 1745 1804 Area under Aquatic Vegetation 338 259 Area under turbidity levels Low 1732 1712 Moderate 4 4 High 9 88 40
- 55. 41
- 56. 42
- 57. 43
- 58. 7.1.6 Anantnag Anantnag is the southern most district of the valley. It shares its border with district Pulwama in the west and from south to east it is attached to Rajouri, Udhampur and Doda districts respectively. It borders Kargil in the north. The district is criss-crossed by a network of perennial rivers, streams and waterfalls. The geographical area of the district is 3,986 sq. km. with five tehsils, namely, Pahalgam, Anantnag, Doru, Kulgam and Bijbehara. The district, enriched with perennial streams with clean water has developed commercial fishing activities with a scattering of trout farms. Total 95 wetlands were mapped and 23 small wetlands (>2.25 ha) were identified, with total area of wetlands of the district as 6875 ha. The major wetland category is River /steam contributing about 81 per cent wetland area of the district. High altitude wetlands cover an area of 1026 ha and accounts for 15 per cent wetland area of the district. A detail of the wetland statistics of the district is given in Table 10. Presence of aquatic vegetation is observed in riverine wetlands and the area under aquatic vegetation is 273 ha in post-monsoon and 217 ha in pre-monsoon. Seasonal fluctuations in rivers/stream and High altitude wetlands are not very high. The turbidity of water is mainly low in both the seasons. Table 10: Area estimates of wetlands in Anantnag district Area in ha Open Water Number Total % of Sr. Post- Pre- Wettcode Wetland Category of Wetland wetland No. monsoon monsoon Wetlands Area area Area Area 1100 Inland Wetlands - Natural 1 1101 Lakes/Ponds - - - - - 2 1102 Ox-bow lakes/ Cut-off meanders - - - - - 3 1103 High altitude wetlands 69 1026 14.92 1026 1026 4 1104 Riverine wetlands 15 273 3.97 - 56 5 1105 Waterlogged - - - - - 6 1106 River/Stream 11 5553 80.77 3310 3428 1200 Inland Wetlands -Man-made 7 1201 Reservoirs/Barrages - - - - - 8 1202 Tanks/Ponds - - - - - 9 1203 Waterlogged - - - - - 10 1204 Salt pans - - - - - Sub-Total 95 6852 99.67 4336 4510 Wetlands (<2.25 ha) 23 23 0.33 - - Total 118 6875 100.00 4336 4510 Area under Aquatic Vegetation 273 217 Area under turbidity levels Low 4297 4402 Moderate 39 108 High - - 44
- 59. 45
- 60. 46
- 61. 47