Mapping Toolbox provides tools for analyzing, visualizing, and mapping geographic data. It allows users to import vector and raster data formats, customize data through operations like subsetting and trimming, and perform geospatial analyses. The toolbox enables 2D and 3D map displays with imported data and base map layers. It offers functions for digital terrain analysis, geodesy calculations, map projections, and other geographic utilities.
A geographic information system (GIS) is a collection of hardware,
software, geographicdata, and personnel designed to create, store, edit,
manipulate, analyze and display geographically referenced information.
A geographic information system (GIS) is a collection of hardware,
software, geographicdata, and personnel designed to create, store, edit,
manipulate, analyze and display geographically referenced information.
Presentation: This presentation gives a brief introduction to tools in ArcGIS and was designed for the Surface Water Quality Monitoring (SWQM) GIS training hosted by Texas Commission on Environmental Quality (TCEQ) staff.
Training: The goal of the SWQM GIS training course is to introduce beginner and intermediate GIS users within the TCEQ surface water monitoring network to the geospatial software, skills, analyses, and data most often used by water resource professionals. The training features presentations from a range of GIS experts from TCEQ, TPWD, and other organizations.
More information on the training: https://www.tceq.texas.gov/waterquality/monitoring/training
In this exercise you will explore ArcCatalog and learn how it is used within
the wider ArcGIS environment. You will practice the most important functions only. If necessary, additional functions will be introduced later in the course. First, you will familiarize with the interface, then with specific functions such as browsing and exploring data, creating metadata, etc. Finally you will learn that ArcCatalog can be used as a gateway to ArcMap.
Geographic information system and remote sensingchala hailu
ArcMap is where you create maps and access most of the ArcGIS functionality. Remote sensing is an instrument based of observing an object at a far distance without direct contact.
Geodatabase: The ArcGIS Mechanism for Data ManagementEsri South Africa
This presentation is about understanding the content that goes into a geodatabase, advantages of using geodatabases, data management and maintaining data integrity.
Geographical Information System (GIS) Georeferencing and Digitization, Bihar ...Kamlesh Kumar
This work is an effort to share Geographical Information System: Georeferencing, digitization and map making steps through QGIS 2.0.1
Georeferencing
Digitization of Topographical sheet
Point
Line
Area
Bihar Map
District Headquarters
Railway of Bihar
District Boundaries
Thematic Maps (Literacy & Sex Ratio)
The main focus of this study is to find appropriate and stable solutions for representing the statistical data into map with some special features. This research also includes the comparison between different solutions for specific features. In this research I have found three solutions using three different technologies namely Oracle MapViewer, QGIS and AnyMap which are different solutions with different specialties. Each solution has its own specialty so we can choose any solution for representing the statistical data into maps depending on our criteria’s.
Raster data is commonly obtained by scanning maps or collecting aerial photographs and satellite images. Scanned map datasets don't normally contain spatial reference information (either embedded in the file or as a separate file). With aerial photography and satellite imagery, sometimes the location information delivered with them is inadequate, and the data does not align properly with other data one has. Thus, to use some raster datasets in conjunction with other spatial data, we need to align or georeference them to a map coordinate system. A map coordinate system is defined using a map projection (a method by which the curved surface of the earth is portrayed on a flat surface). Georeferencing a raster data defines its location using map coordinates and assigns the coordinate system of the data frame. Georeferencing raster data allows it to be viewed, queried, and analyzed with other geographic data.
Generally, we georeference raster data using existing spatial data (target data)—such as georeferenced rasters or a vector feature class—that resides in the desired map coordinate system. The process involves identifying a series of ground control points—known x,y coordinates—that link locations on the raster dataset with locations in the spatially referenced data (target data). Control points are locations that can be accurately identified on the raster dataset and in real-world coordinates. Many different types of features can be used as identifiable locations, such as road or stream intersections, the mouth of a stream, rock outcrops, the end of a jetty of land, the corner of an established field, street corners, or the intersection of two hedgerows. The control points are used to build a polynomial transformation that will shift the raster dataset from its existing location to the spatially correct location. The connection between one control point on the raster dataset (the from point) and the corresponding control point on the aligned target data (the to point) is a link.
Finally, the georeferenced raster file can be exported for further usage.
THIS PRESENTATION IS TO HELP YOU PERFORM THE TASK STEP BY STEP.
Birds Bees and Butterflies Wings Over the Curriculum by Mary Van Dyke and Chr...Mary Van Dyke
Grow native plants to encourage birds, bees, butterflies, and other pollinators on your school grounds. Investigate migratory neotropical birds and Monarchs with programs connected with schools in Central America. Explore ways to integrate cultural, environmental themes across curriculum and target learning standards. Christine Payack and Mary Van Dyke share ideas and innovative outdoor teaching strategies that take flight across the curriculum at Jamestown Elementary School! Christine Payack is now co-Director at Arlington County's Outdoor Lab at time of this presentation was Science Lead and Second Grade Teacher at Jamestown Elementary School. Mary Van Dyke is Visiting Horticulturist at Jamestown Elementary School, and founded her business Green STEM Learning to provide integrative outdoor learning programs.
La web 2.0 ha evolucionado el uso de la red, con su cantidad de servicio, nos facilita la vida, en la presentación se muestran los cambios que esta ha hecho a la web.
Concepts and Methods of Embedding Statistical Data into Maps IJSRP Journal
The main focus of this study is to find appropriate and stable solutions for representing the statistical data into map with some special features. This research also includes the comparison between different solutions for specific features. In this research I have found three solutions using three different technologies namely Oracle MapViewer, QGIS and AnyMap which are different solutions with different specialties. Each solution has its own specialty so we can choose any solution for representing the statistical data into maps depending on our criteria’s.
The main focus of this study is to find appropriate and stable solutions for representing the statistical data into map with some special features. This research also includes the comparison between different solutions for specific features. In this research I have found three solutions using three different technologies namely Oracle MapViewer, QGIS and AnyMap which are different solutions with different specialties. Each solution has its own specialty so we can choose any solution for representing the statistical data into maps depending on our criteria’s.
ILWIS is an acronym for the Integrated Land and Water Information System.
It is a Geographic Information System (GIS) with Image Processing capabilities. ILWIS has been developed by the International Institute for Aerospace Survey and Earth Sciences (ITC), Enschede, The Netherlands.
the title of this course is Entitles as GIS and Remote sensingmulugeta48
This course is entitled as GIS and Remote sensing, this course is mainly focus on the application of GIS on irrigation water which is the application of water to the soil for the purpose of crop production
Generating a custom Ruby SDK for your web service or Rails API using Smithyg2nightmarescribd
Have you ever wanted a Ruby client API to communicate with your web service? Smithy is a protocol-agnostic language for defining services and SDKs. Smithy Ruby is an implementation of Smithy that generates a Ruby SDK using a Smithy model. In this talk, we will explore Smithy and Smithy Ruby to learn how to generate custom feature-rich SDKs that can communicate with any web service, such as a Rails JSON API.
Securing your Kubernetes cluster_ a step-by-step guide to success !KatiaHIMEUR1
Today, after several years of existence, an extremely active community and an ultra-dynamic ecosystem, Kubernetes has established itself as the de facto standard in container orchestration. Thanks to a wide range of managed services, it has never been so easy to set up a ready-to-use Kubernetes cluster.
However, this ease of use means that the subject of security in Kubernetes is often left for later, or even neglected. This exposes companies to significant risks.
In this talk, I'll show you step-by-step how to secure your Kubernetes cluster for greater peace of mind and reliability.
Builder.ai Founder Sachin Dev Duggal's Strategic Approach to Create an Innova...Ramesh Iyer
In today's fast-changing business world, Companies that adapt and embrace new ideas often need help to keep up with the competition. However, fostering a culture of innovation takes much work. It takes vision, leadership and willingness to take risks in the right proportion. Sachin Dev Duggal, co-founder of Builder.ai, has perfected the art of this balance, creating a company culture where creativity and growth are nurtured at each stage.
Epistemic Interaction - tuning interfaces to provide information for AI supportAlan Dix
Paper presented at SYNERGY workshop at AVI 2024, Genoa, Italy. 3rd June 2024
https://alandix.com/academic/papers/synergy2024-epistemic/
As machine learning integrates deeper into human-computer interactions, the concept of epistemic interaction emerges, aiming to refine these interactions to enhance system adaptability. This approach encourages minor, intentional adjustments in user behaviour to enrich the data available for system learning. This paper introduces epistemic interaction within the context of human-system communication, illustrating how deliberate interaction design can improve system understanding and adaptation. Through concrete examples, we demonstrate the potential of epistemic interaction to significantly advance human-computer interaction by leveraging intuitive human communication strategies to inform system design and functionality, offering a novel pathway for enriching user-system engagements.
Software Delivery At the Speed of AI: Inflectra Invests In AI-Powered QualityInflectra
In this insightful webinar, Inflectra explores how artificial intelligence (AI) is transforming software development and testing. Discover how AI-powered tools are revolutionizing every stage of the software development lifecycle (SDLC), from design and prototyping to testing, deployment, and monitoring.
Learn about:
• The Future of Testing: How AI is shifting testing towards verification, analysis, and higher-level skills, while reducing repetitive tasks.
• Test Automation: How AI-powered test case generation, optimization, and self-healing tests are making testing more efficient and effective.
• Visual Testing: Explore the emerging capabilities of AI in visual testing and how it's set to revolutionize UI verification.
• Inflectra's AI Solutions: See demonstrations of Inflectra's cutting-edge AI tools like the ChatGPT plugin and Azure Open AI platform, designed to streamline your testing process.
Whether you're a developer, tester, or QA professional, this webinar will give you valuable insights into how AI is shaping the future of software delivery.
Transcript: Selling digital books in 2024: Insights from industry leaders - T...BookNet Canada
The publishing industry has been selling digital audiobooks and ebooks for over a decade and has found its groove. What’s changed? What has stayed the same? Where do we go from here? Join a group of leading sales peers from across the industry for a conversation about the lessons learned since the popularization of digital books, best practices, digital book supply chain management, and more.
Link to video recording: https://bnctechforum.ca/sessions/selling-digital-books-in-2024-insights-from-industry-leaders/
Presented by BookNet Canada on May 28, 2024, with support from the Department of Canadian Heritage.
UiPath Test Automation using UiPath Test Suite series, part 3DianaGray10
Welcome to UiPath Test Automation using UiPath Test Suite series part 3. In this session, we will cover desktop automation along with UI automation.
Topics covered:
UI automation Introduction,
UI automation Sample
Desktop automation flow
Pradeep Chinnala, Senior Consultant Automation Developer @WonderBotz and UiPath MVP
Deepak Rai, Automation Practice Lead, Boundaryless Group and UiPath MVP
Accelerate your Kubernetes clusters with Varnish CachingThijs Feryn
A presentation about the usage and availability of Varnish on Kubernetes. This talk explores the capabilities of Varnish caching and shows how to use the Varnish Helm chart to deploy it to Kubernetes.
This presentation was delivered at K8SUG Singapore. See https://feryn.eu/presentations/accelerate-your-kubernetes-clusters-with-varnish-caching-k8sug-singapore-28-2024 for more details.
DevOps and Testing slides at DASA ConnectKari Kakkonen
My and Rik Marselis slides at 30.5.2024 DASA Connect conference. We discuss about what is testing, then what is agile testing and finally what is Testing in DevOps. Finally we had lovely workshop with the participants trying to find out different ways to think about quality and testing in different parts of the DevOps infinity loop.
Connector Corner: Automate dynamic content and events by pushing a buttonDianaGray10
Here is something new! In our next Connector Corner webinar, we will demonstrate how you can use a single workflow to:
Create a campaign using Mailchimp with merge tags/fields
Send an interactive Slack channel message (using buttons)
Have the message received by managers and peers along with a test email for review
But there’s more:
In a second workflow supporting the same use case, you’ll see:
Your campaign sent to target colleagues for approval
If the “Approve” button is clicked, a Jira/Zendesk ticket is created for the marketing design team
But—if the “Reject” button is pushed, colleagues will be alerted via Slack message
Join us to learn more about this new, human-in-the-loop capability, brought to you by Integration Service connectors.
And...
Speakers:
Akshay Agnihotri, Product Manager
Charlie Greenberg, Host
State of ICS and IoT Cyber Threat Landscape Report 2024 previewPrayukth K V
The IoT and OT threat landscape report has been prepared by the Threat Research Team at Sectrio using data from Sectrio, cyber threat intelligence farming facilities spread across over 85 cities around the world. In addition, Sectrio also runs AI-based advanced threat and payload engagement facilities that serve as sinks to attract and engage sophisticated threat actors, and newer malware including new variants and latent threats that are at an earlier stage of development.
The latest edition of the OT/ICS and IoT security Threat Landscape Report 2024 also covers:
State of global ICS asset and network exposure
Sectoral targets and attacks as well as the cost of ransom
Global APT activity, AI usage, actor and tactic profiles, and implications
Rise in volumes of AI-powered cyberattacks
Major cyber events in 2024
Malware and malicious payload trends
Cyberattack types and targets
Vulnerability exploit attempts on CVEs
Attacks on counties – USA
Expansion of bot farms – how, where, and why
In-depth analysis of the cyber threat landscape across North America, South America, Europe, APAC, and the Middle East
Why are attacks on smart factories rising?
Cyber risk predictions
Axis of attacks – Europe
Systemic attacks in the Middle East
Download the full report from here:
https://sectrio.com/resources/ot-threat-landscape-reports/sectrio-releases-ot-ics-and-iot-security-threat-landscape-report-2024/
FIDO Alliance Osaka Seminar: The WebAuthn API and Discoverable Credentials.pdf
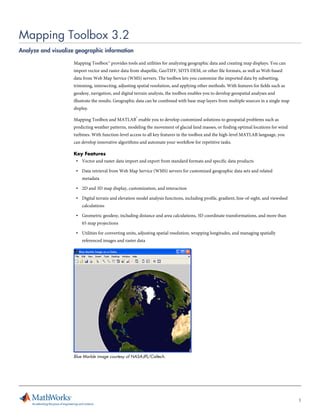
Mapping toolbox
1. Mapping Toolbox 3.2
Analyze and visualize geographic information
Mapping Toolbox™ provides tools and utilities for analyzing geographic data and creating map displays. You can
import vector and raster data from shapefile, GeoTIFF, SDTS DEM, or other file formats, as well as Web-based
data from Web Map Service (WMS) servers. The toolbox lets you customize the imported data by subsetting,
trimming, intersecting, adjusting spatial resolution, and applying other methods. With features for fields such as
geodesy, navigation, and digital terrain analysis, the toolbox enables you to develop geospatial analyses and
illustrate the results. Geographic data can be combined with base map layers from multiple sources in a single map
display.
Mapping Toolbox and MATLAB® enable you to develop customized solutions to geospatial problems such as
predicting weather patterns, modeling the movement of glacial land masses, or finding optimal locations for wind
turbines. With function-level access to all key features in the toolbox and the high-level MATLAB language, you
can develop innovative algorithms and automate your workflow for repetitive tasks.
Key Features
▪ Vector and raster data import and export from standard formats and specific data products
▪ Data retrieval from Web Map Service (WMS) servers for customized geographic data sets and related
metadata
▪ 2D and 3D map display, customization, and interaction
▪ Digital terrain and elevation model analysis functions, including profile, gradient, line-of-sight, and viewshed
calculations
▪ Geometric geodesy, including distance and area calculations, 3D coordinate transformations, and more than
65 map projections
▪ Utilities for converting units, adjusting spatial resolution, wrapping longitudes, and managing spatially
referenced images and raster data
Blue Marble image courtesy of NASA-JPL/Caltech.
1
2. Import and Export Geographic Data
Mapping Toolbox imports a wide range of GIS and geospatial file formats, enabling you to read both vector and
raster data into the MATLAB environment. The toolbox helps you reduce access time and improve memory usage
by providing functionality for specific file types to read a portion of a file and downsample data prior to use. The
toolbox supports georeferenced imagery and other raster data grids, including orthoimagery, satellite swath data,
digital terrain elevation models, and various global data grids.
Mapping Toolbox also exports data to a number of file formats, enabling you to share data with applications such
as Google Earth™ and ArcGIS. Using the toolbox with MATLAB or Image Processing Toolbox™ provides access to
additional file formats.
File formats and data products supported by Mapping Toolbox include:
▪ Raster file formats, such as GeoTIFF, USGS DEM, DEM, DTED, Arc ASCII Grid, GTOPO30, ETOPO, and
worldfile
▪ Vector file formats, such as ESRI shapefiles, KML, VMAP0, DCW, and GSHHS
▪ Selected data products, such as AVHRR and EGM96
File formats supported by MATLAB include:
▪ Image file formats, such as TIFF, JPEG, PNG, and JPEG2000
▪ Scientific data formats, such as NetCDF, HDF5, HDF4, HDF-EOS, and multiband files (BIP, BIL, BSQ)
File formats supported by Image Processing Toolbox include:
▪ Image file formats, such as NITF and HDR
Access Web Map Service (WMS) Servers
With Mapping Toolbox, you can find and download raster data from WMS servers. Many government and
commercial organizations, such as NASA, ESA, USGS, NOAA, ESRI, and Microsoft, adhere to the WMS protocol
for rendering, reprojecting, and serving georeferenced data sets over the Internet. Mapping Toolbox enables you
to access elevation, oceanography, weather, satellite imagery, and many other raster data sets in MATLAB.
To assist with identifying WMS data layers that are appropriate to your application, the toolbox provides a
prequalified database of WMS servers and layers that enables you to search for an appropriate data set by layer
name, server name, location, and other terms. To request and retrieve a map with appropriate characteristics, such
as spatial resolution and geographic limits, the toolbox provides functions and classes that enable you to define a
custom map request, submit it to the server, and retrieve a map into a file or directly into MATLAB for
processing.
2
3. Collapse of the Larsen Ice Shelf, Antarctica, over a 3-month period. Original coastline segmented using Image
Processing Toolbox. Images courtesy of NASA/Goddard Space Flight Center Scientific Visualization Studio.
A composite map of San Francisco created with functions in Mapping Toolbox. Data courtesy of U.S. Geological
Survey and retrieved via Microsoft TerraServer.
Create 2D and 3D Map Displays
Mapping Toolbox provides a broad set of visualization functions to combine vector and raster data and produce
customized 2D and 3D map displays. The map displays can be simple or sophisticated, and can be tuned to your
application. You can readily combine data sets of different scales and modalities in the same display. For example,
you can display images and data grids in their correct positions—regardless of cell size, pixel size, or area
covered—and then overlay vector map features.
Function-level access to map display capabilities in the toolbox enables automatic creation of frequently used map
displays. For example, you can use batch mode processing to examine a geospatial time-series data set and create
an animated display that shows how the data changes over time. Functionality in MATLAB enables you to save
animated map figures to a movie or GIF file.
With the visualization functions in the toolbox, you can:
3
4. ▪ Create scatter, line, polygon, quiver, comet, and stem plots
▪ Annotate your map with a scale ruler, north arrow, contour labels, and legends
▪ Customize map markers, colors, and line styles
▪ Vary transparency for polygons and raster data sets
▪ Control latitude-longitude grid and meridian and parallel labels
▪ Apply special colormaps for contour maps, terrain, bathymetry grids, and political maps
▪ Control lighting, shading, and perspective
Map display of eastern Massachusetts town borders and hydrology with a scale ruler, north arrow, and an inset map
of the Northeast United States. Image courtesy of Office of Geographic and Environmental Information (MassGIS).
Overlay of raster and vector data layers for Concord, Massachusetts. Data courtesy of Office of Geographic and
Environmental Information (MassGIS).
Analyze Digital Terrain and Elevation Models
Mapping Toolbox supports the visualization and analysis of 3D data, such as digital terrain, bathymetry, and other
gridded-data products. It provides functions to visualize terrain data and add annotations such as contour lines.
You can control lighting, shading, colormaps, and other aspects of the display. The MATLAB graphics
environment enables you to reposition the figure camera interactively and programmatically to view your data
from different perspectives.
4
5. The toolbox also provides functions to calculate gradient, slope, aspect, line-of-sight visibility, and viewshed. You
can use these functions in applications such as the placement of communication towers, where you need to
calculate the direct line-of-sight from many vantage points to determine the optimal location.
You can also use Mapping Toolbox with Simulink 3D Animation™ to create a virtual reality world from elevation
data; you can then couple the terrain data with analysis provided by other products. For example, you can use
Aerospace Blockset™ with your virtual world to perform tasks such as visualizing flight paths over geographic data
sets.
Digital terrain visualization of the Grand Canyon image with contour data. DEM data courtesy of NASA-JPL/Caltech.
Topographic data courtesy U.S. Geological Survey and retrieved via Microsoft TerraServer.
Apply Geometric Geodesy, Map Projections, and Utilities
Geometric Geodesy
With Mapping Toolbox, your calculations can account for the curvature of Earth and other planetary bodies. You
can find the surface area of arbitrary polygons or quadrangles on spheres and ellipsoids, calculate the intersections
of geometric objects, compute the distance between points on a sphere or ellipsoid, and find the overlapping area
between polygons. Navigation functionality enables you to perform tasks such as calculating and correcting for
wind and current vectors based on heading and air or ground speed.
The toolbox also provides 3D coordinate transformations between geodetic and geocentric coordinate systems.
These provide key functionality when implementing Helmert transformations and 3D datum transformations that
you would need, for example, to combine data referenced to WGS84 with legacy maps based on older datums.
5
6. Weather data on top of satellite imagery for the continental United States. Image Processing Toolbox is used to
segment the primary storm from national weather data, and geodetic calculations are made using Mapping Toolbox to
find the area of the storm. Data courtesy of NOAA, as retrieved via the Iowa Environmental Mesonet WMS Server,
and NASA-JPL/Caltech.
Map Projections
Mapping Toolbox contains more than 65 of the most popular and important map projections for displaying the
curved surface of planetary bodies on a 2D map display. They include equal-area, equidistant, conformal, and
compromise projections in the cylindrical, conic, and azimuthal classes. The toolbox also supports projections in
the PROJ.4 library and the UTM/UPS systems. Many projections support both spherical and ellipsoidal models of
Earth and other bodies.
With the toolbox, you can apply forward and inverse transformations of positions and direction angles or
azimuths, enabling the reprojection of vector data into alternative systems. Raster and image data displays can be
projected in map visualizations to match the coordinate systems of other data sets. You can also explore the
properties of your projection by trimming the data to a particular latitude-longitude extent, calculating distortion
parameters at a point, or visualizing map distortions as Tissot Indicatrices or scale-distortion contours.
Mercator, Mollweide, and sinusoidal projections (clockwise from top). Images courtesy NASA-JPL/Caltech.
6