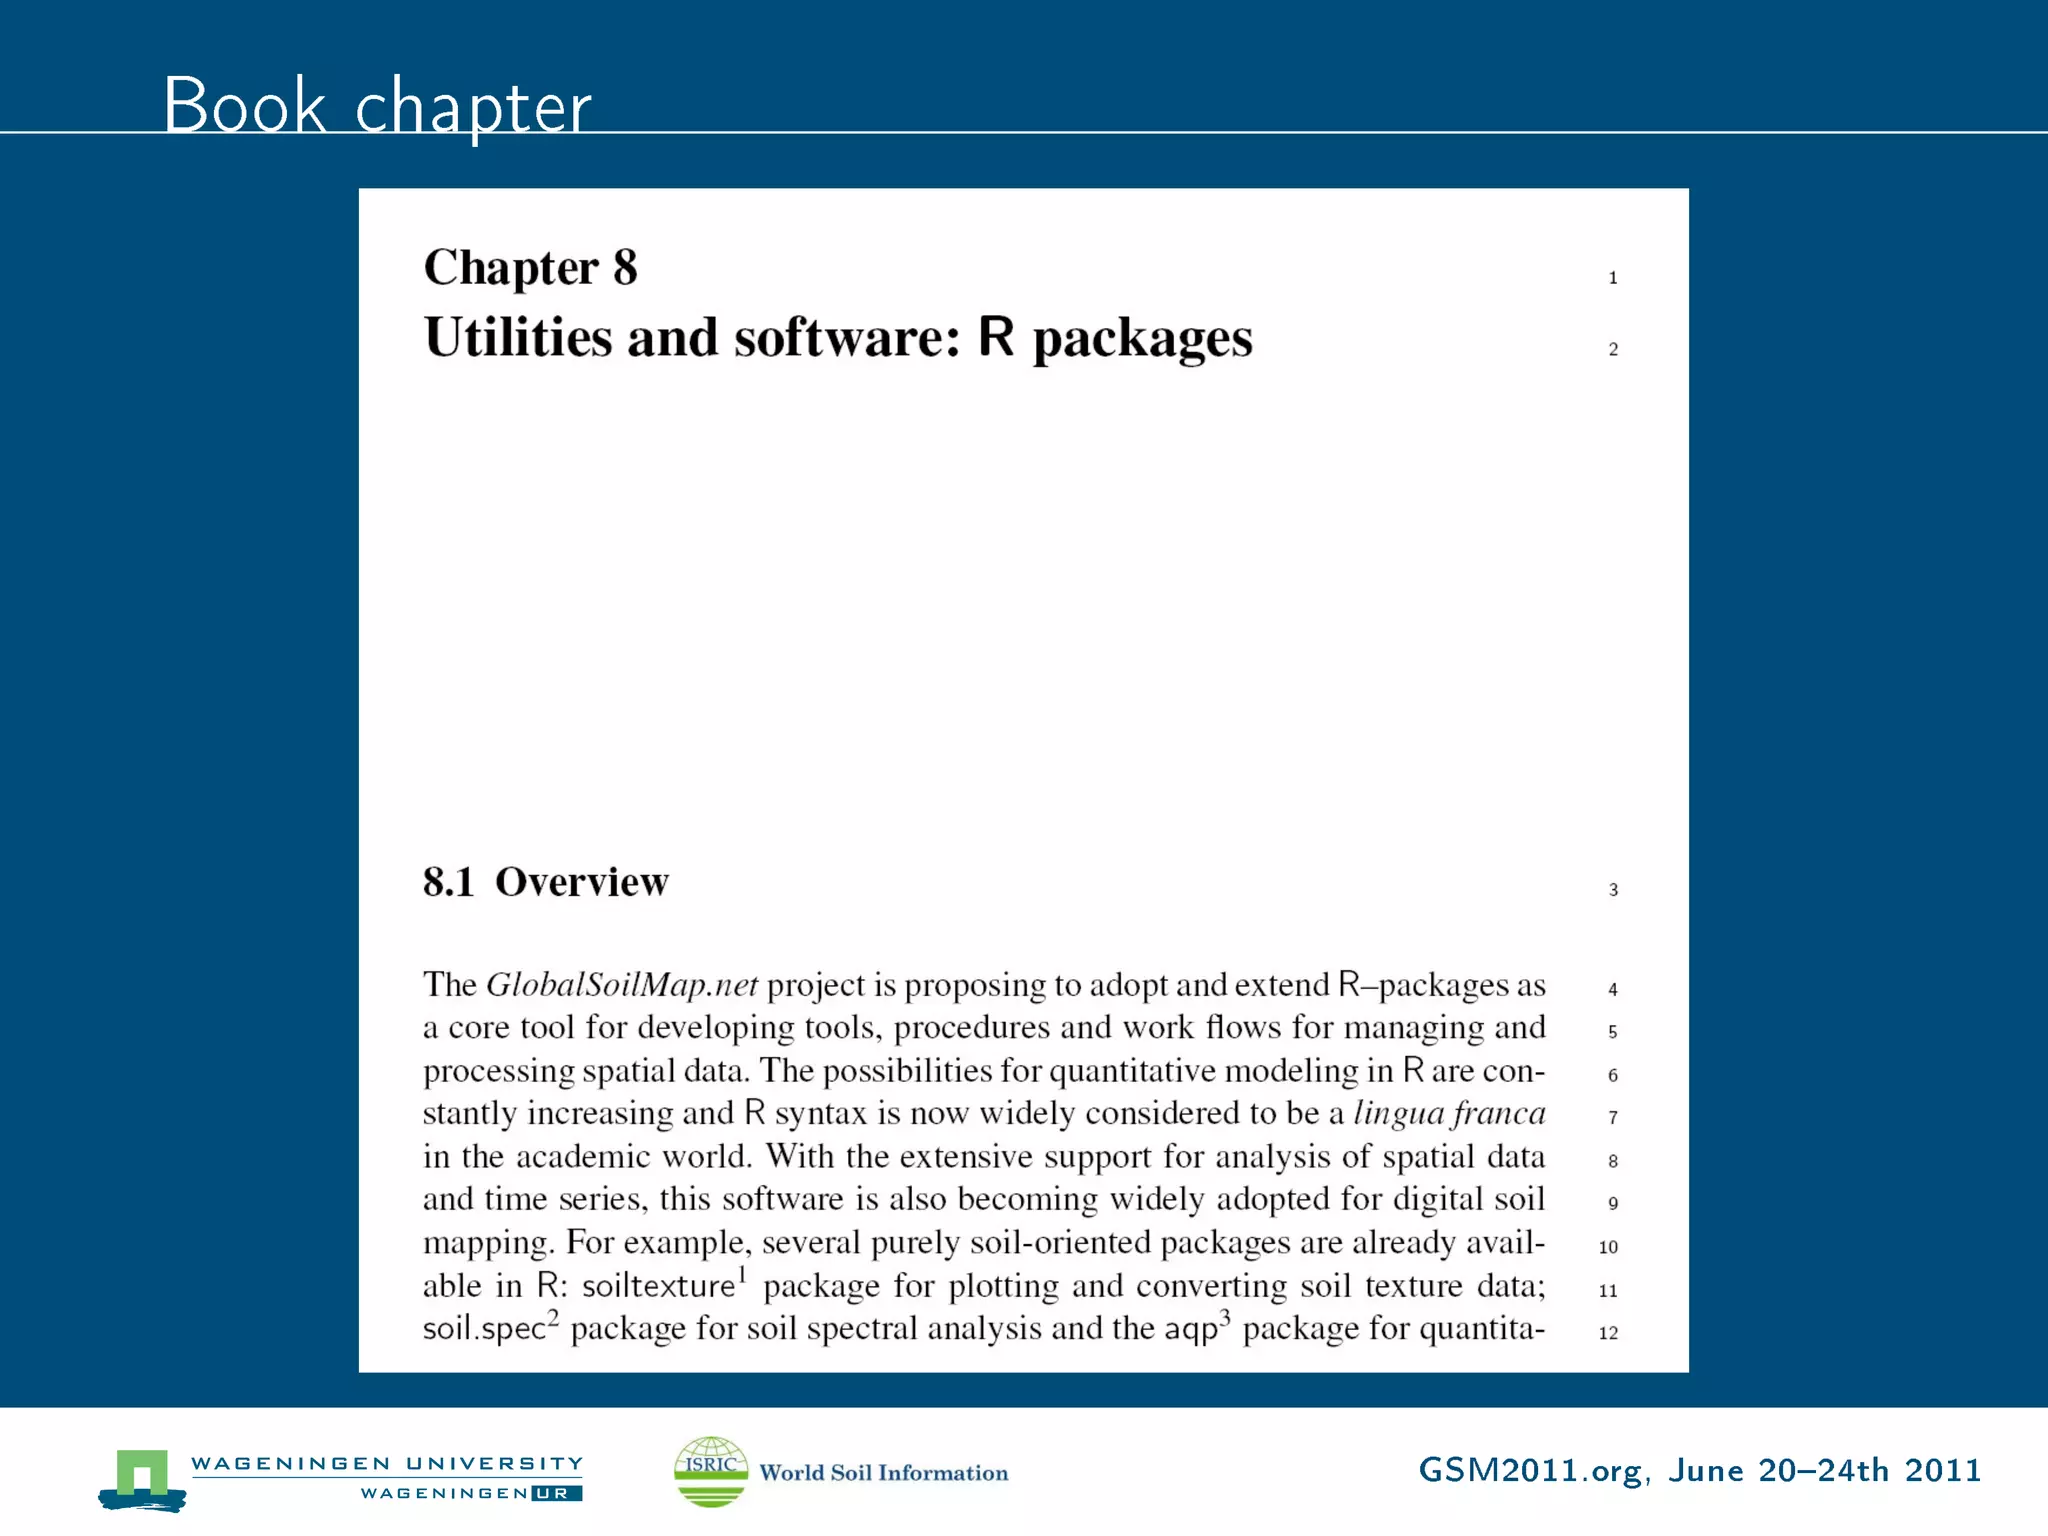
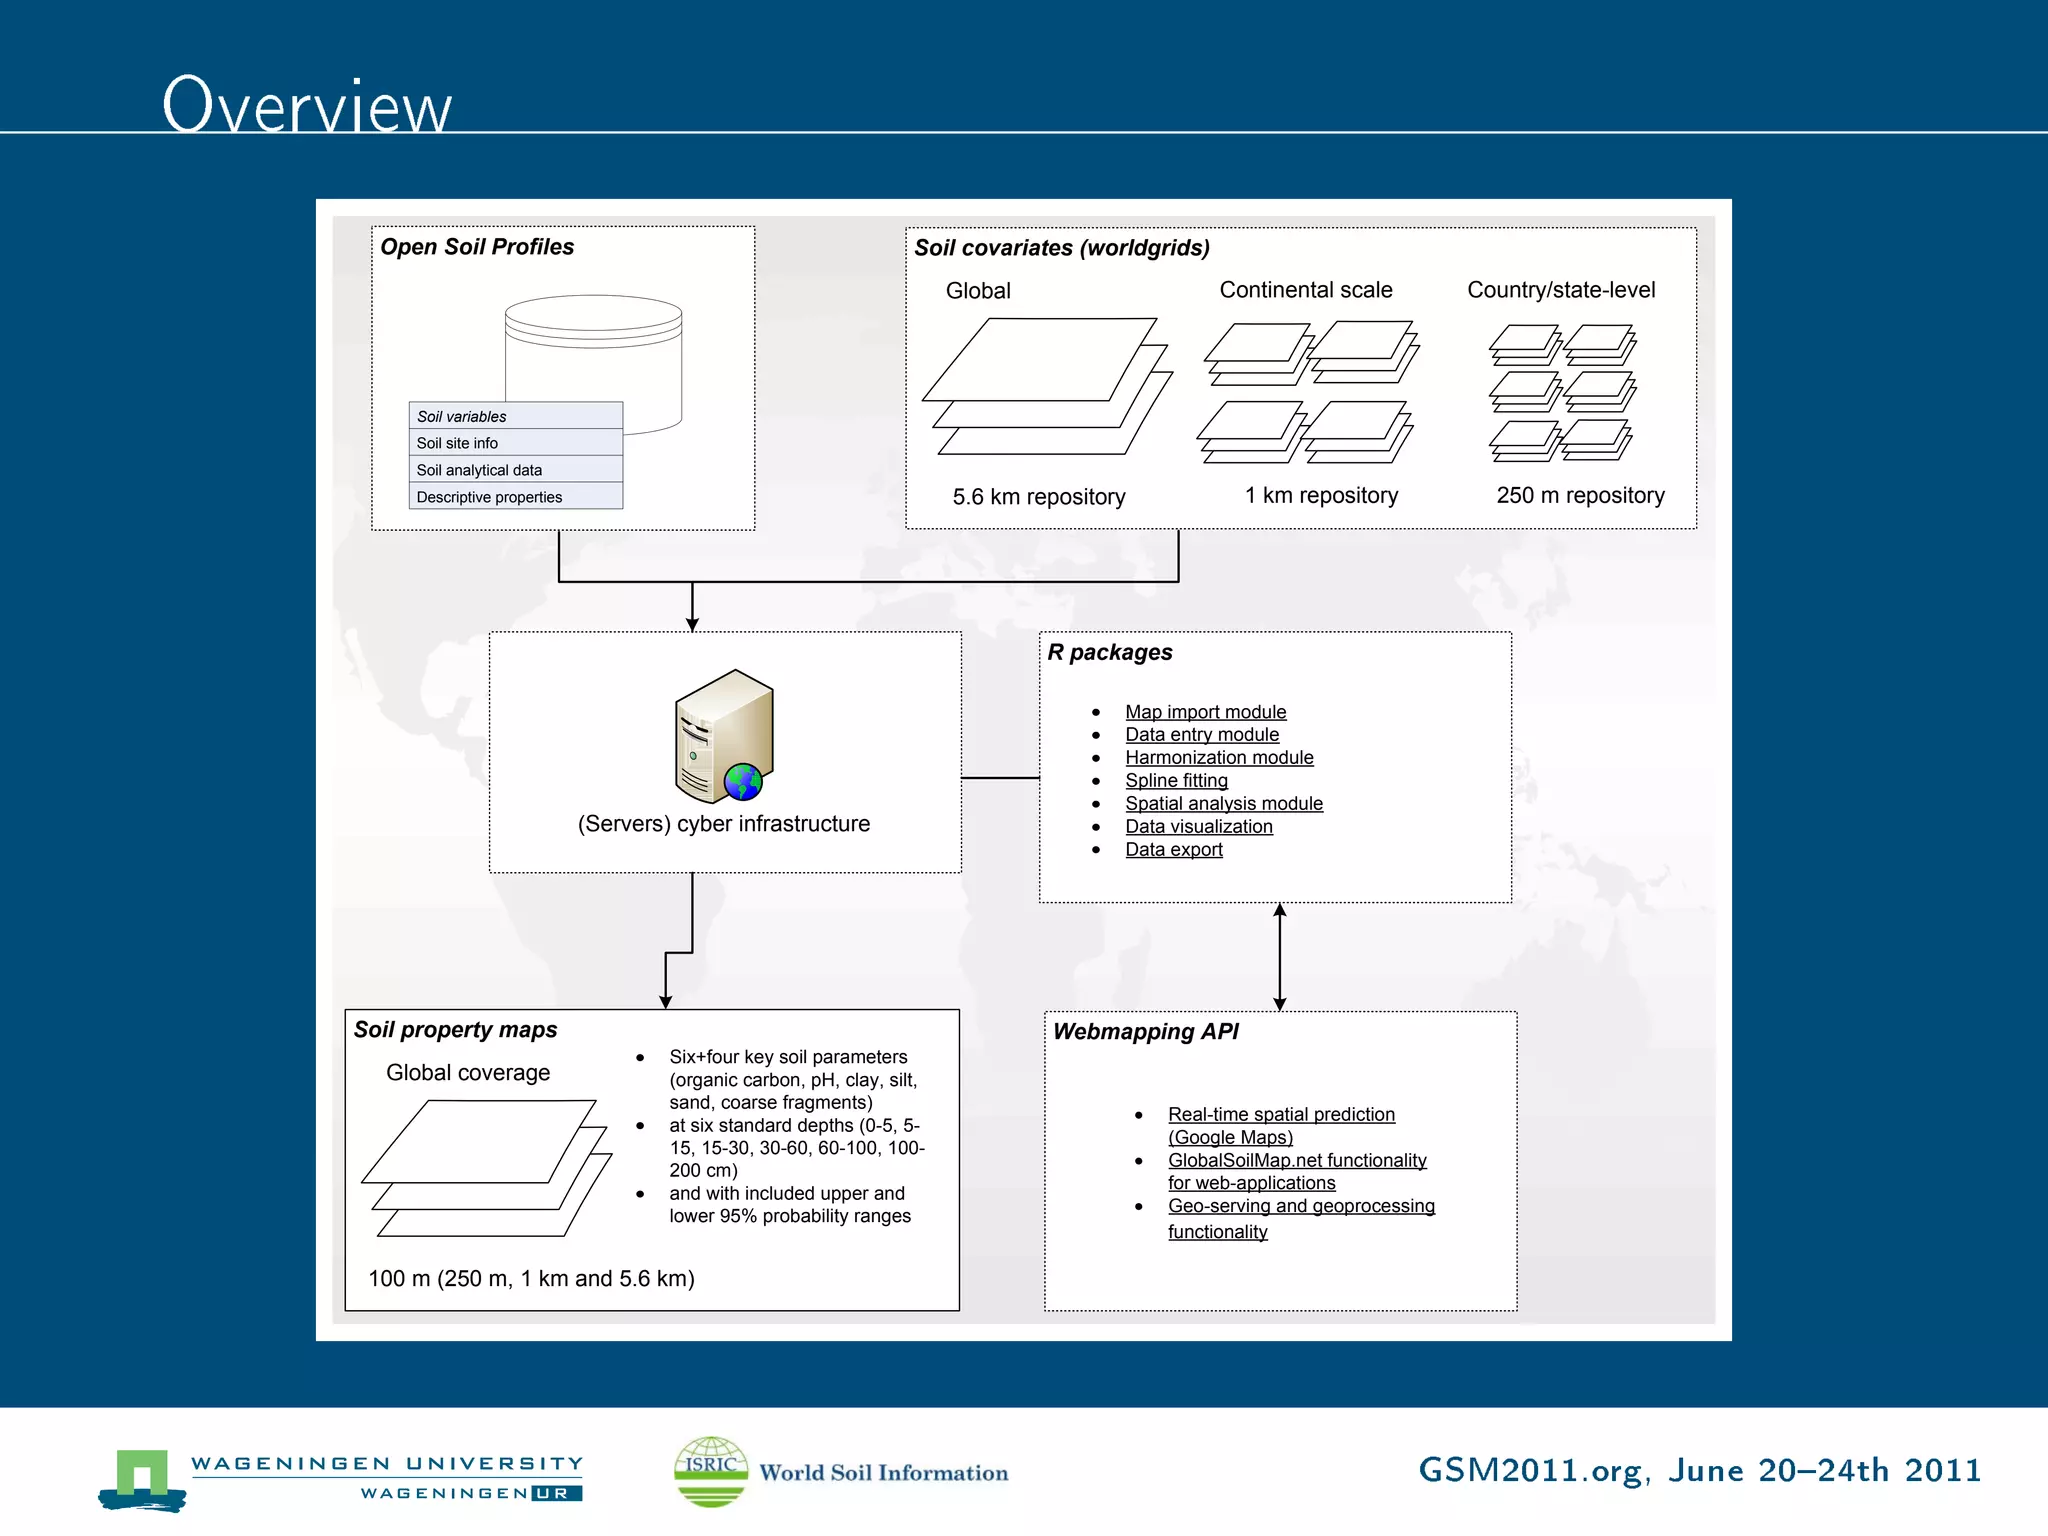
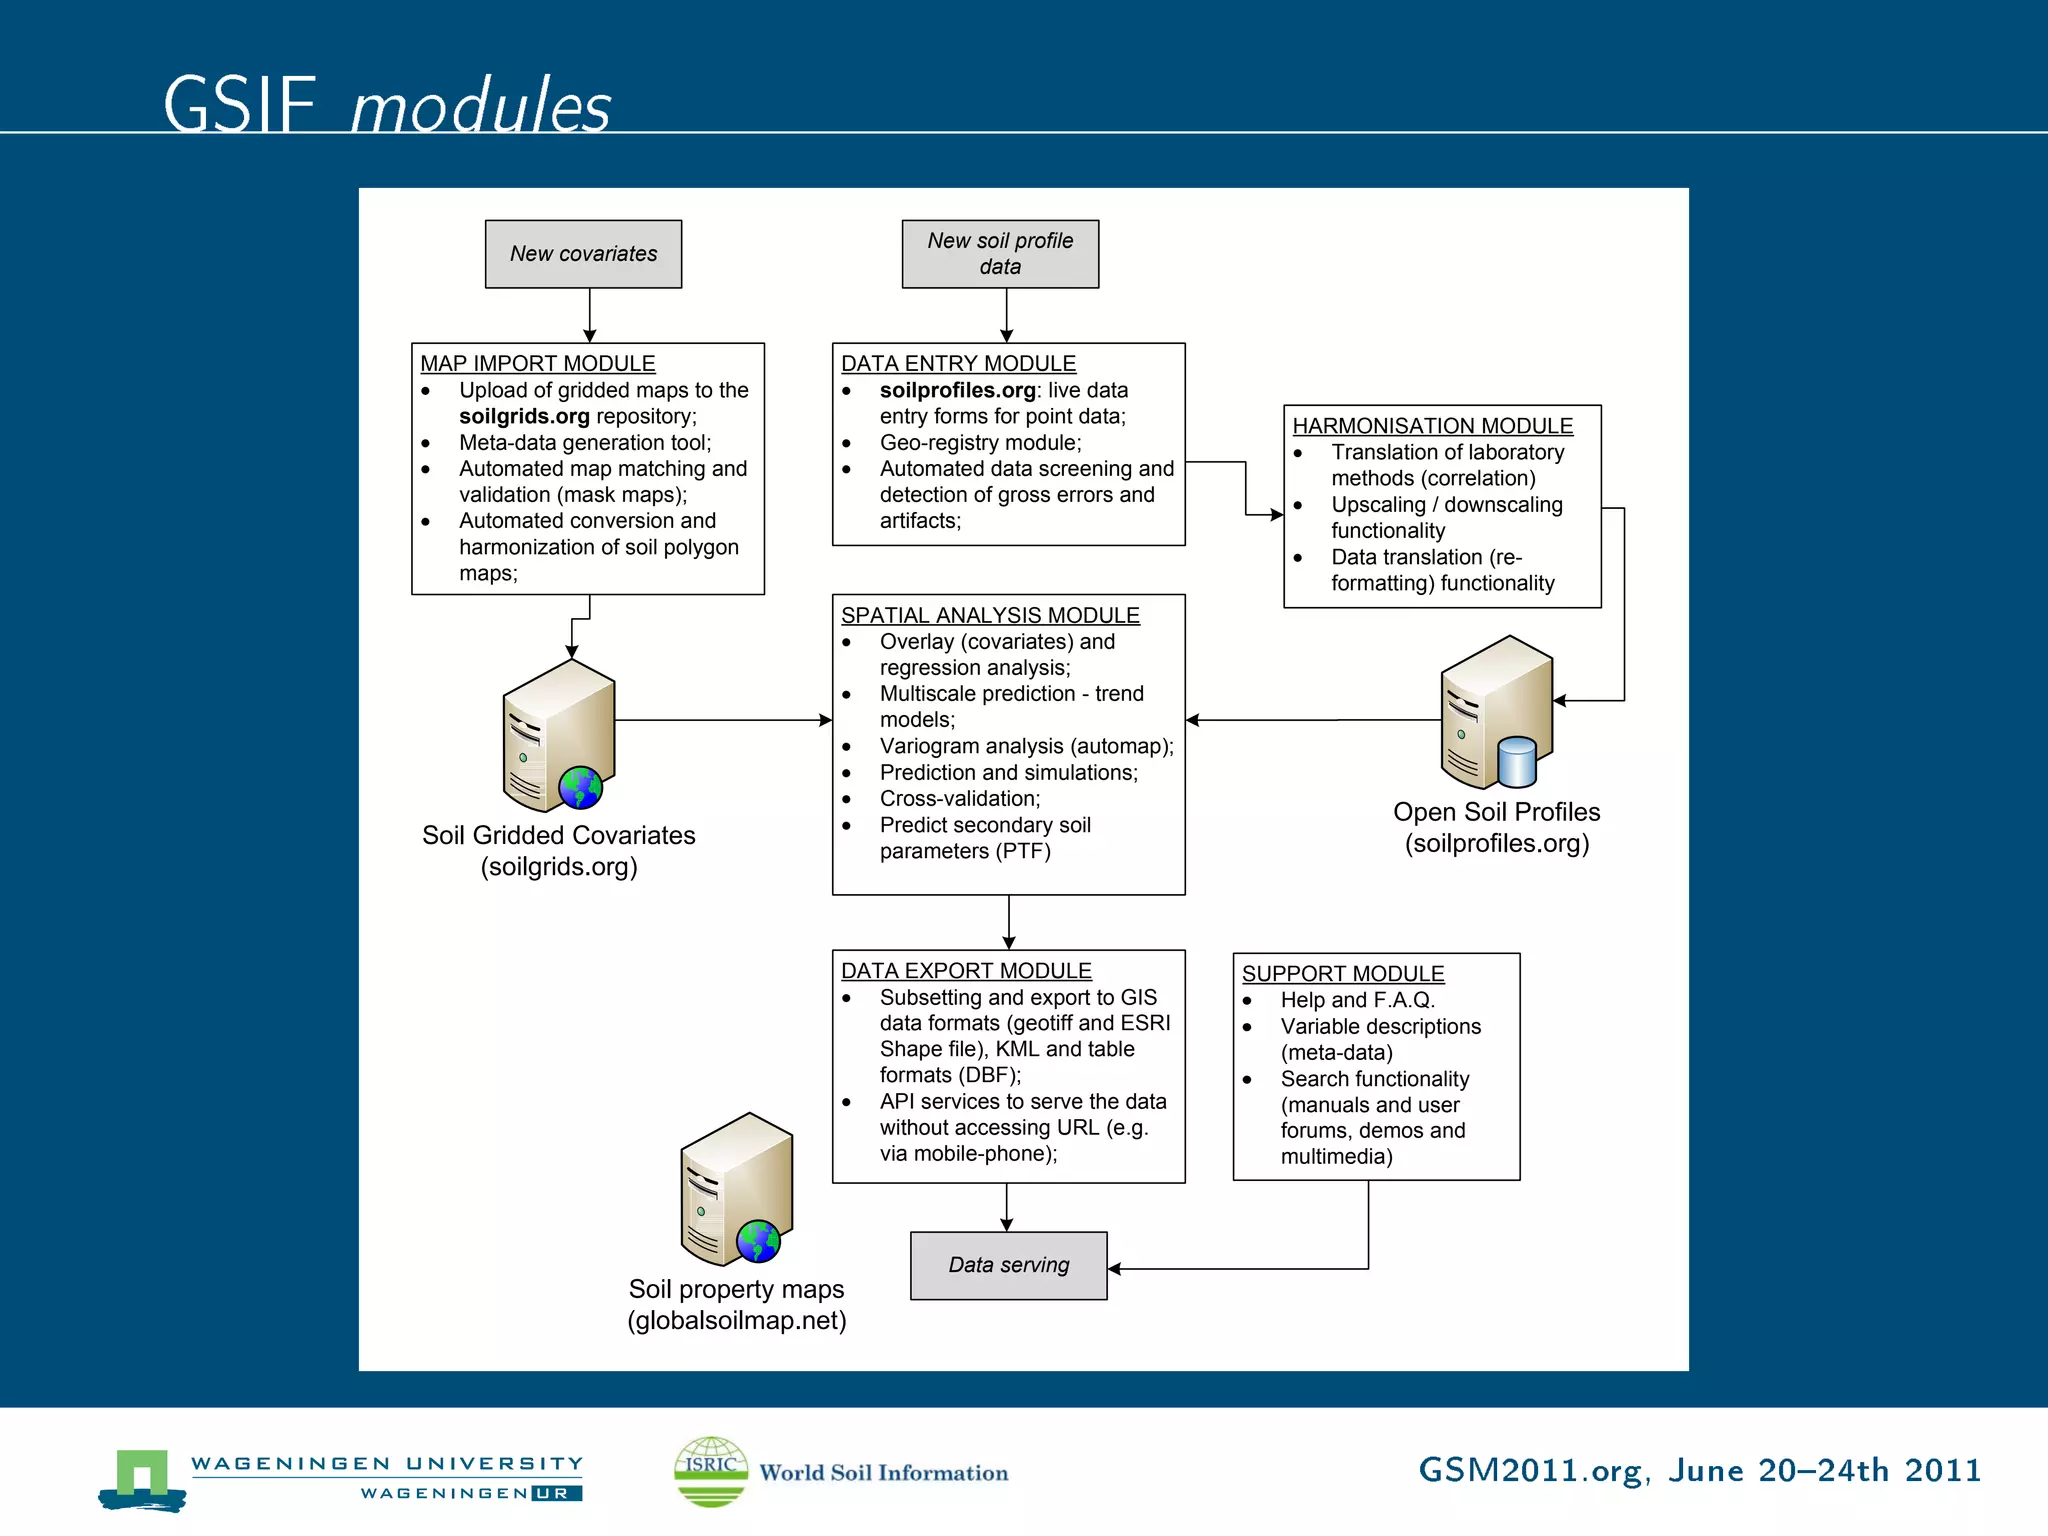
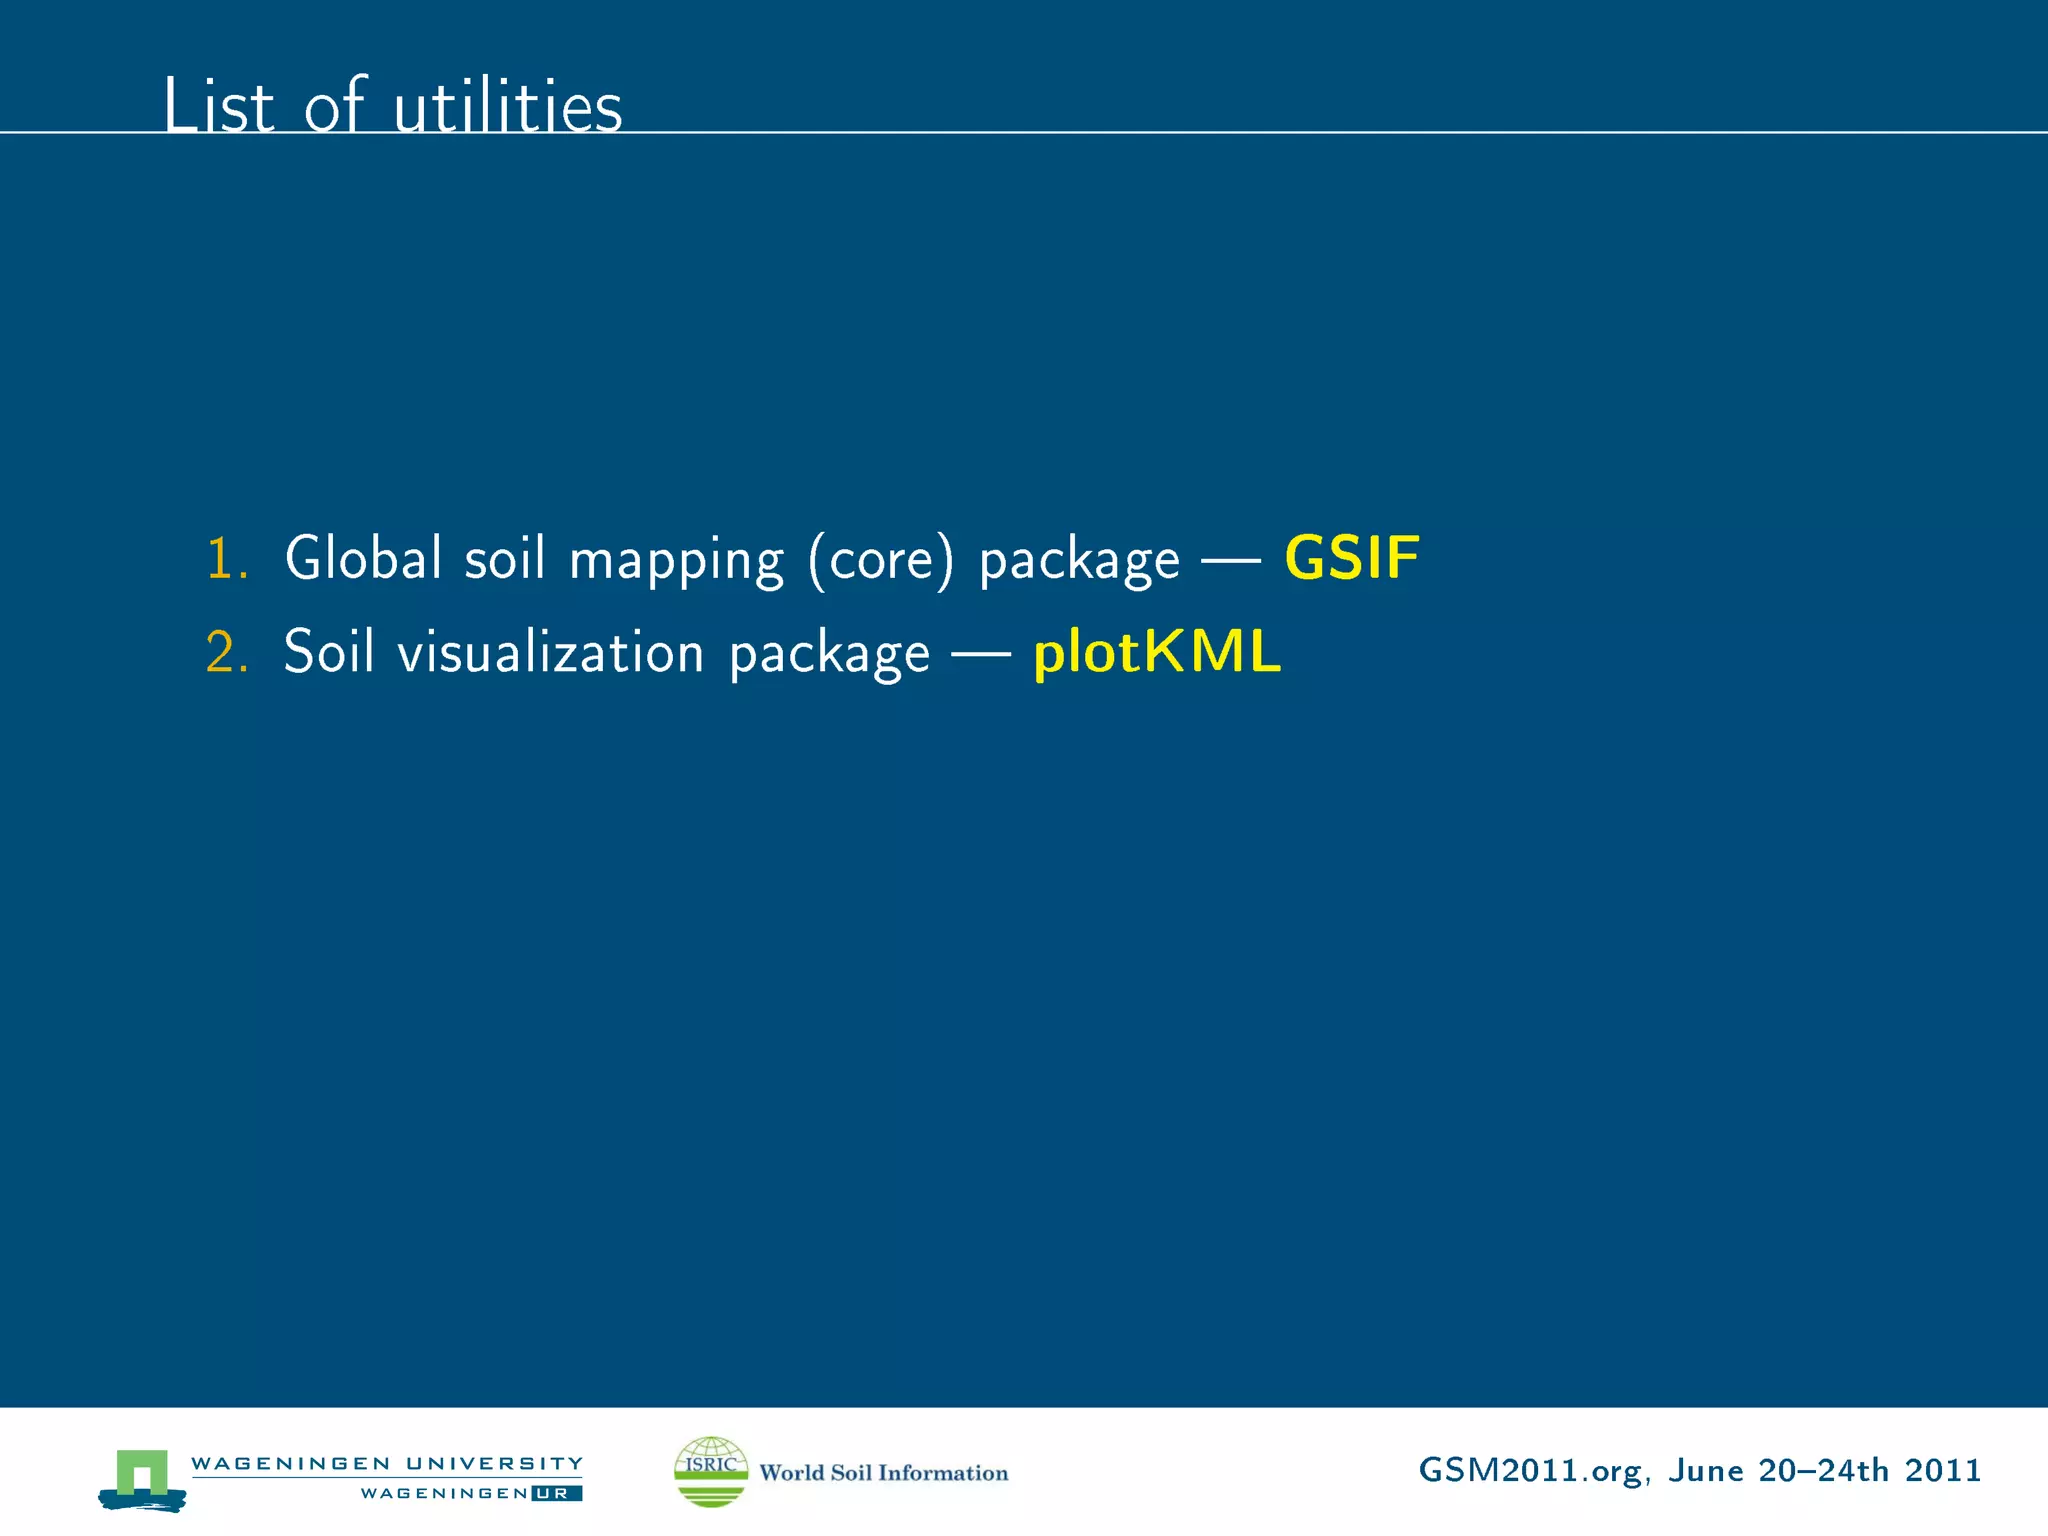
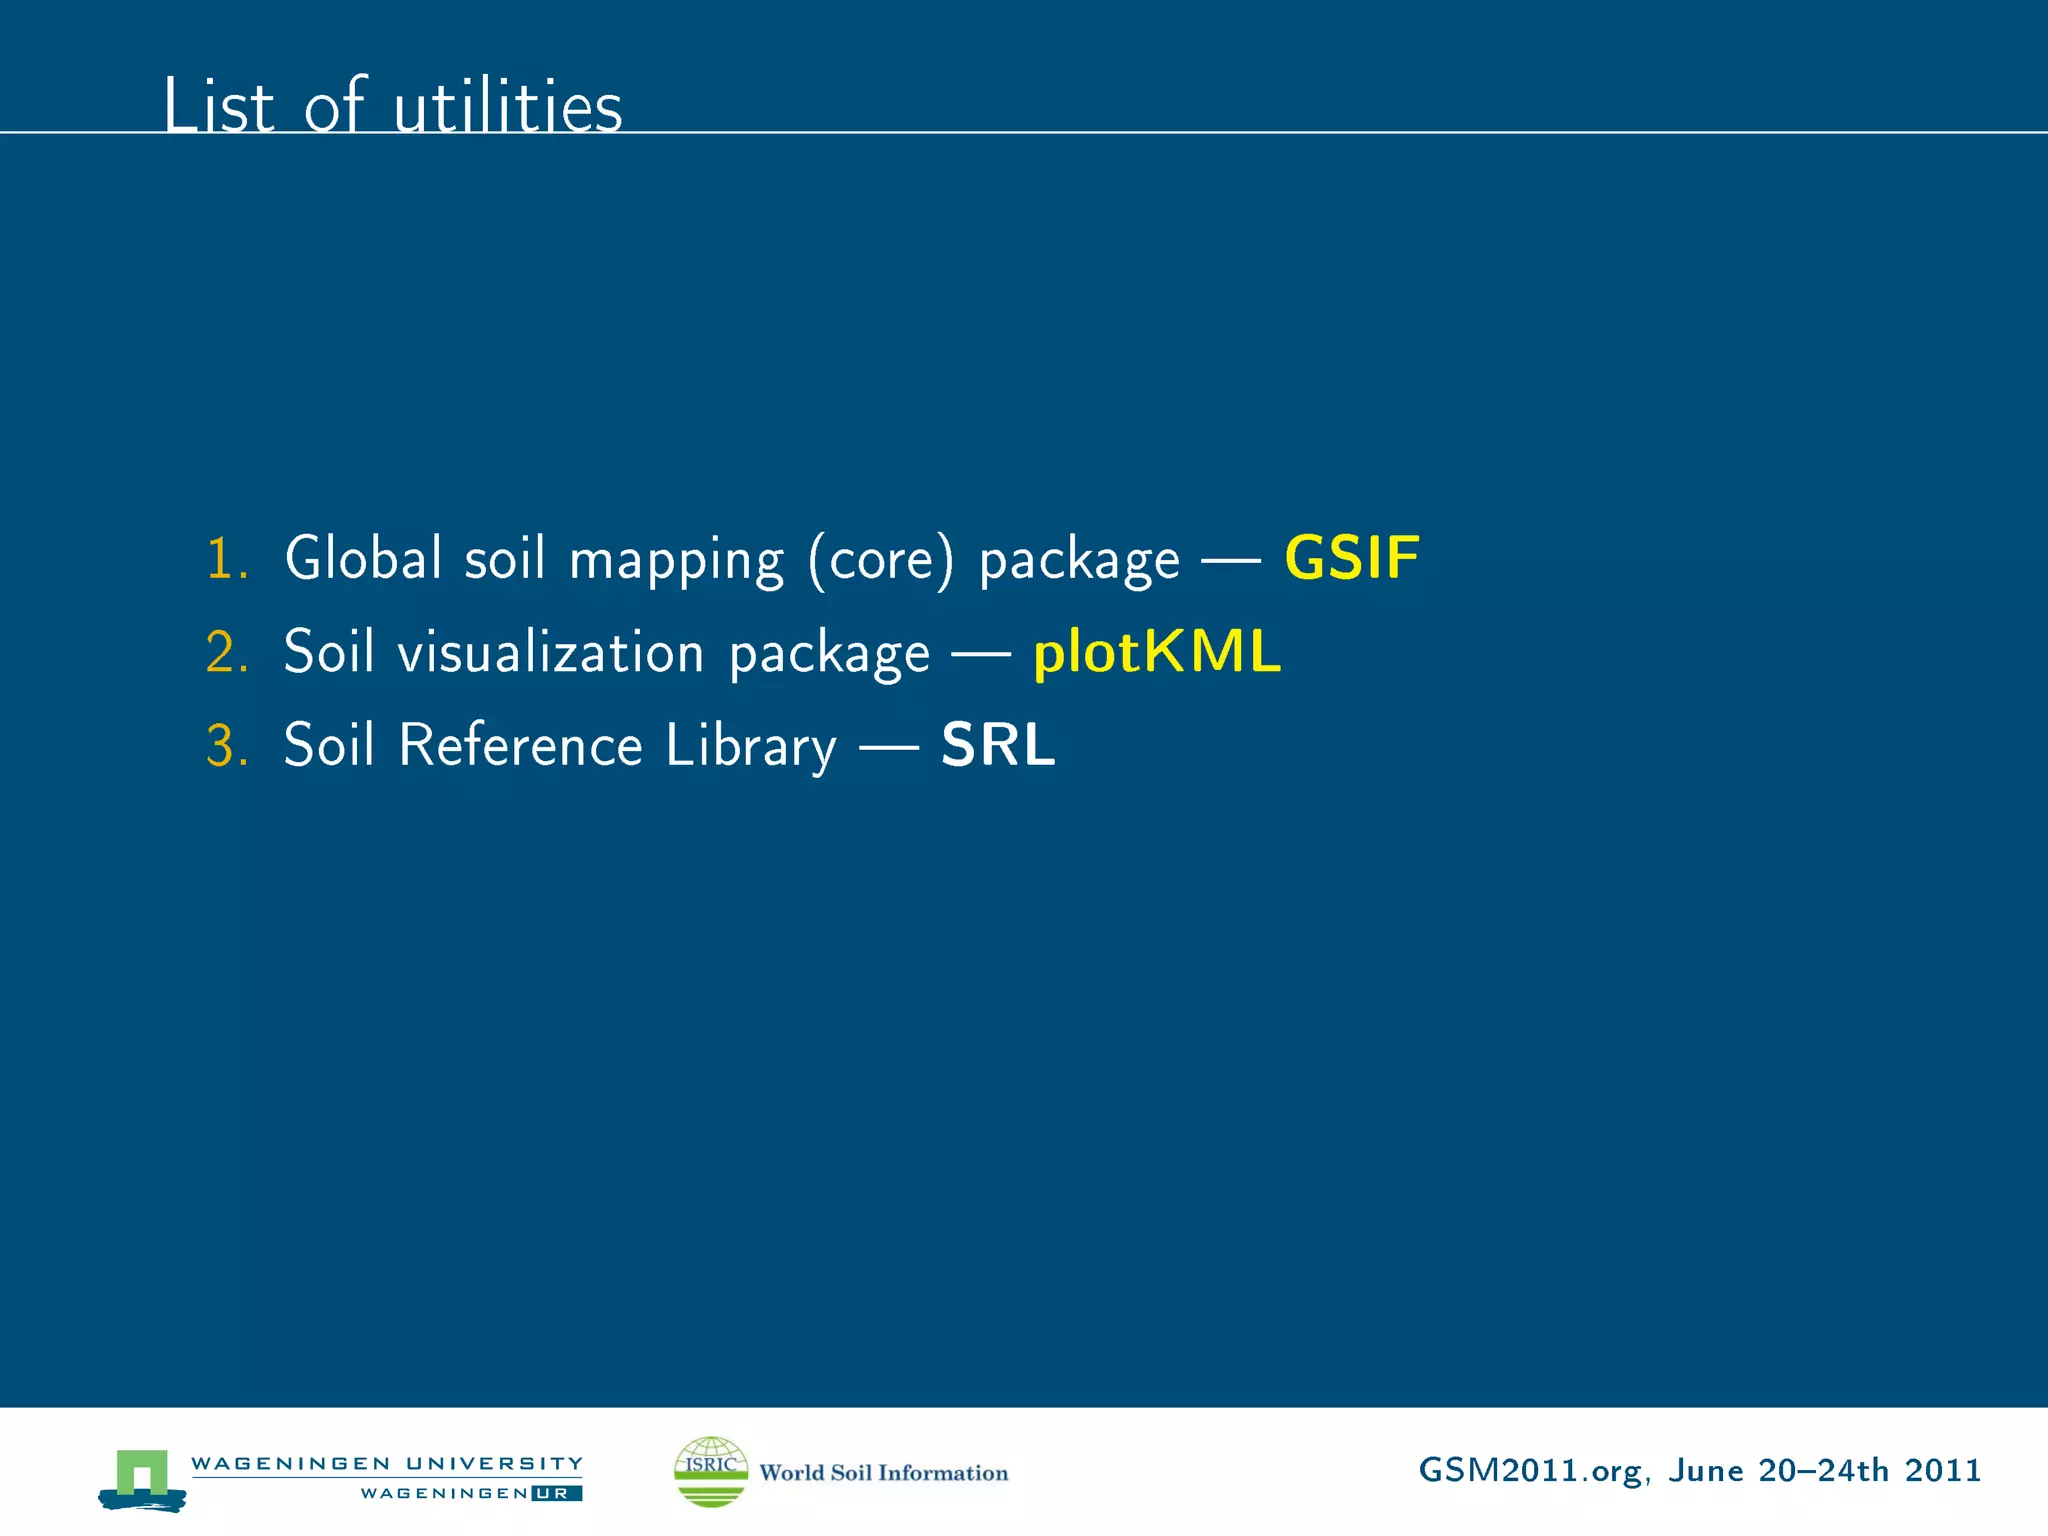
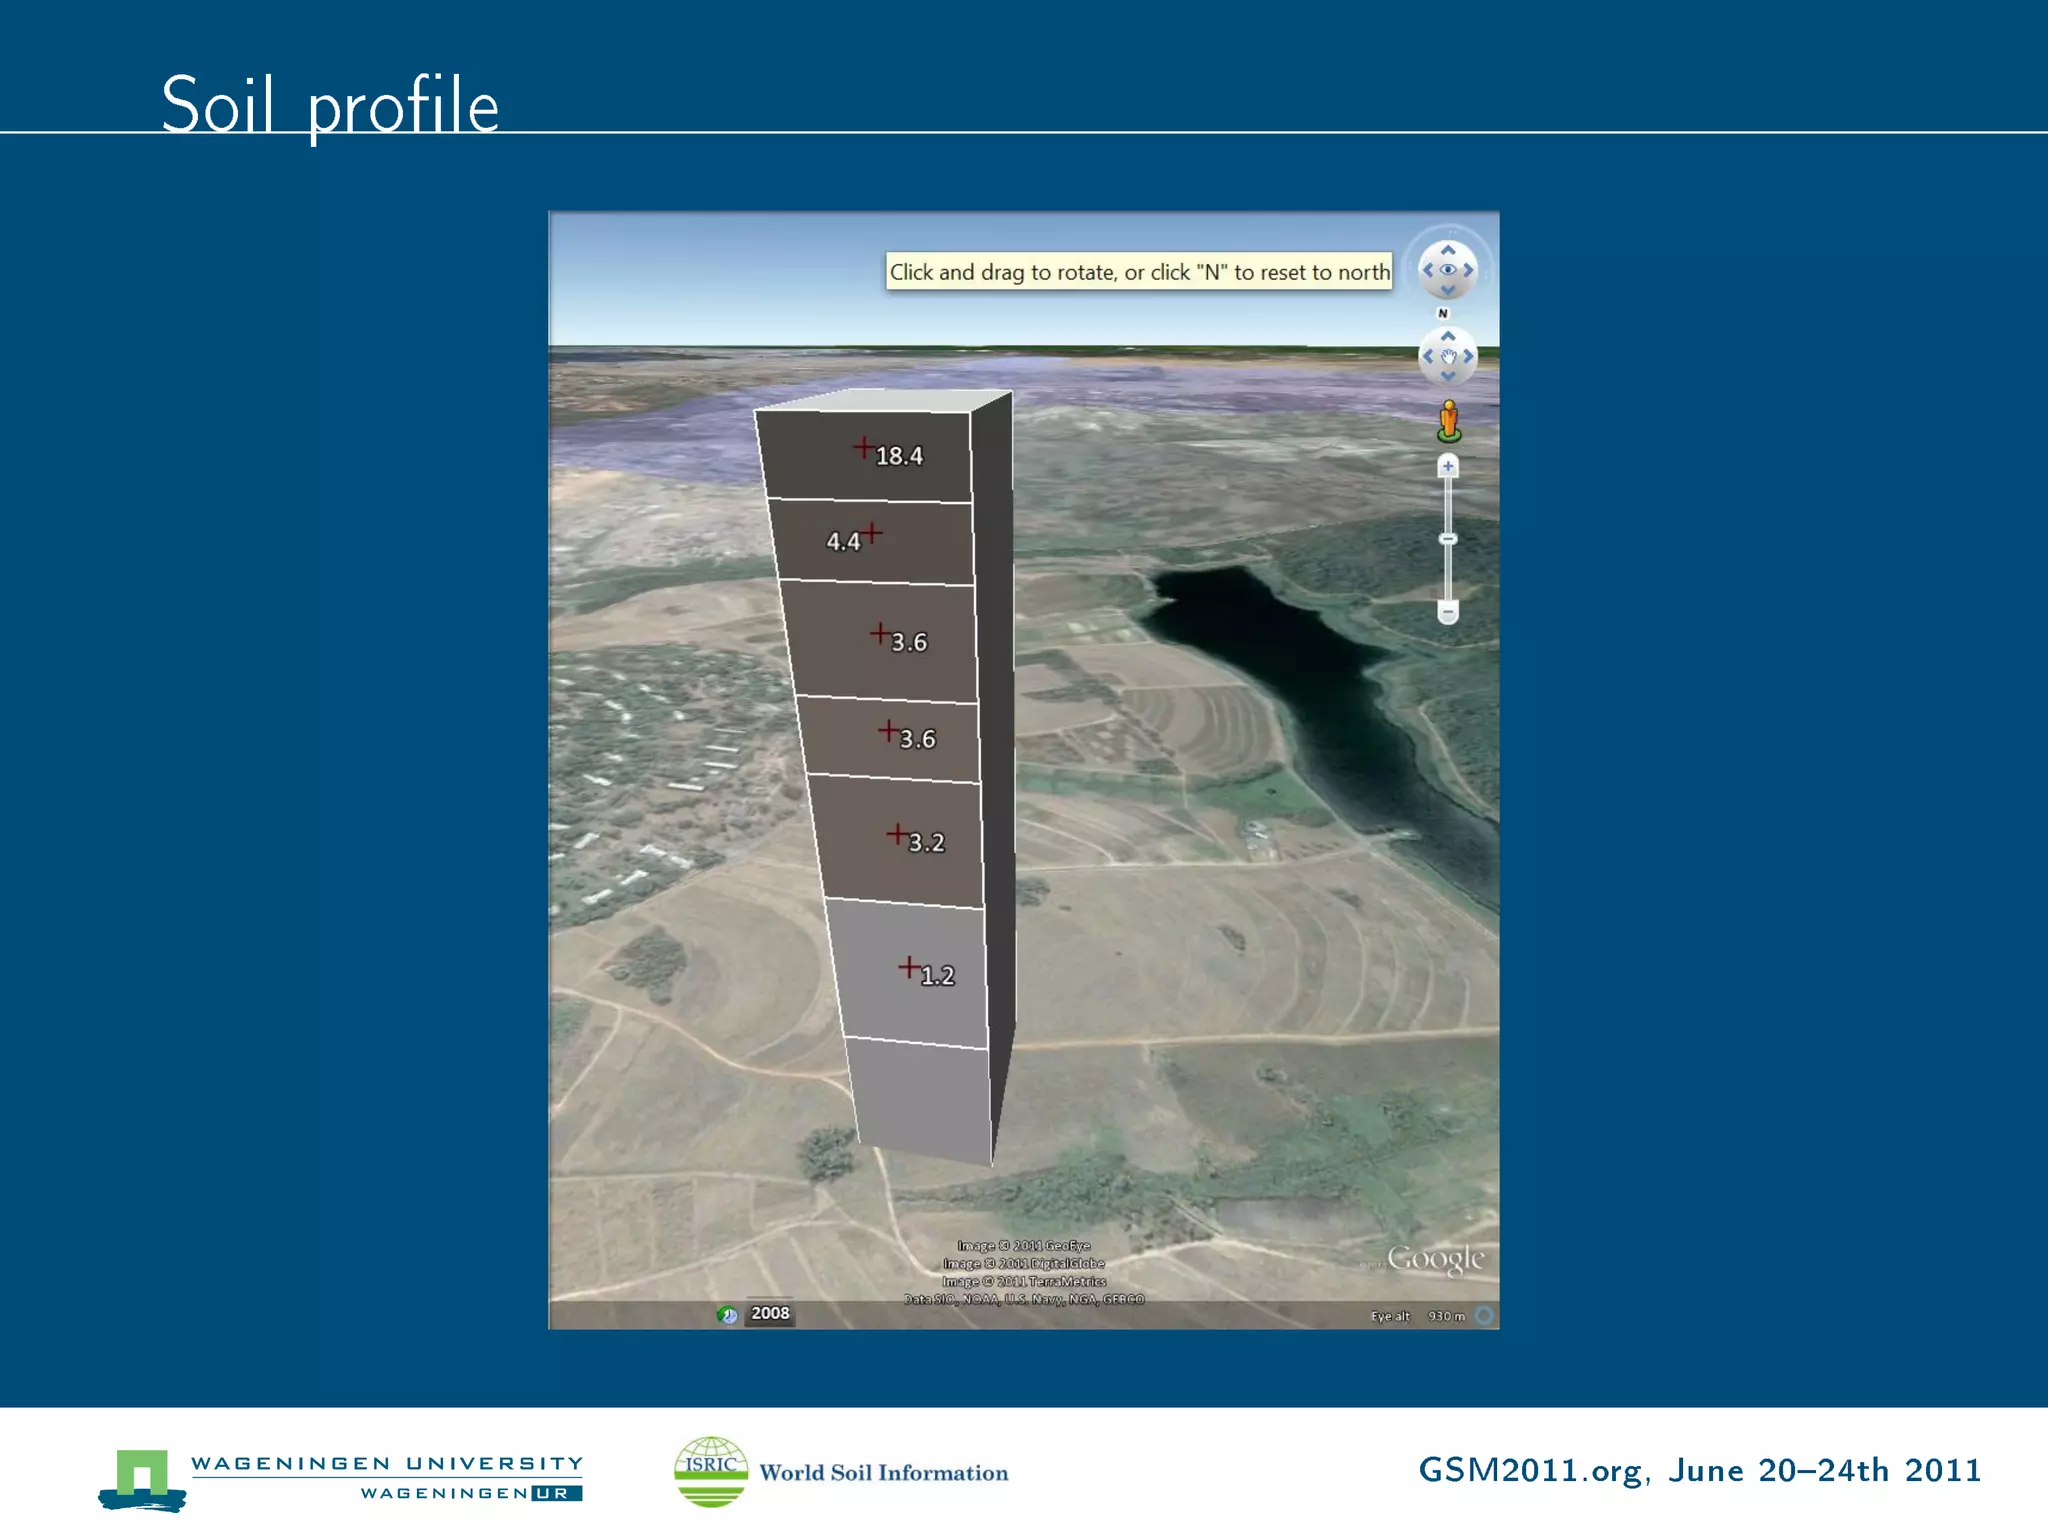
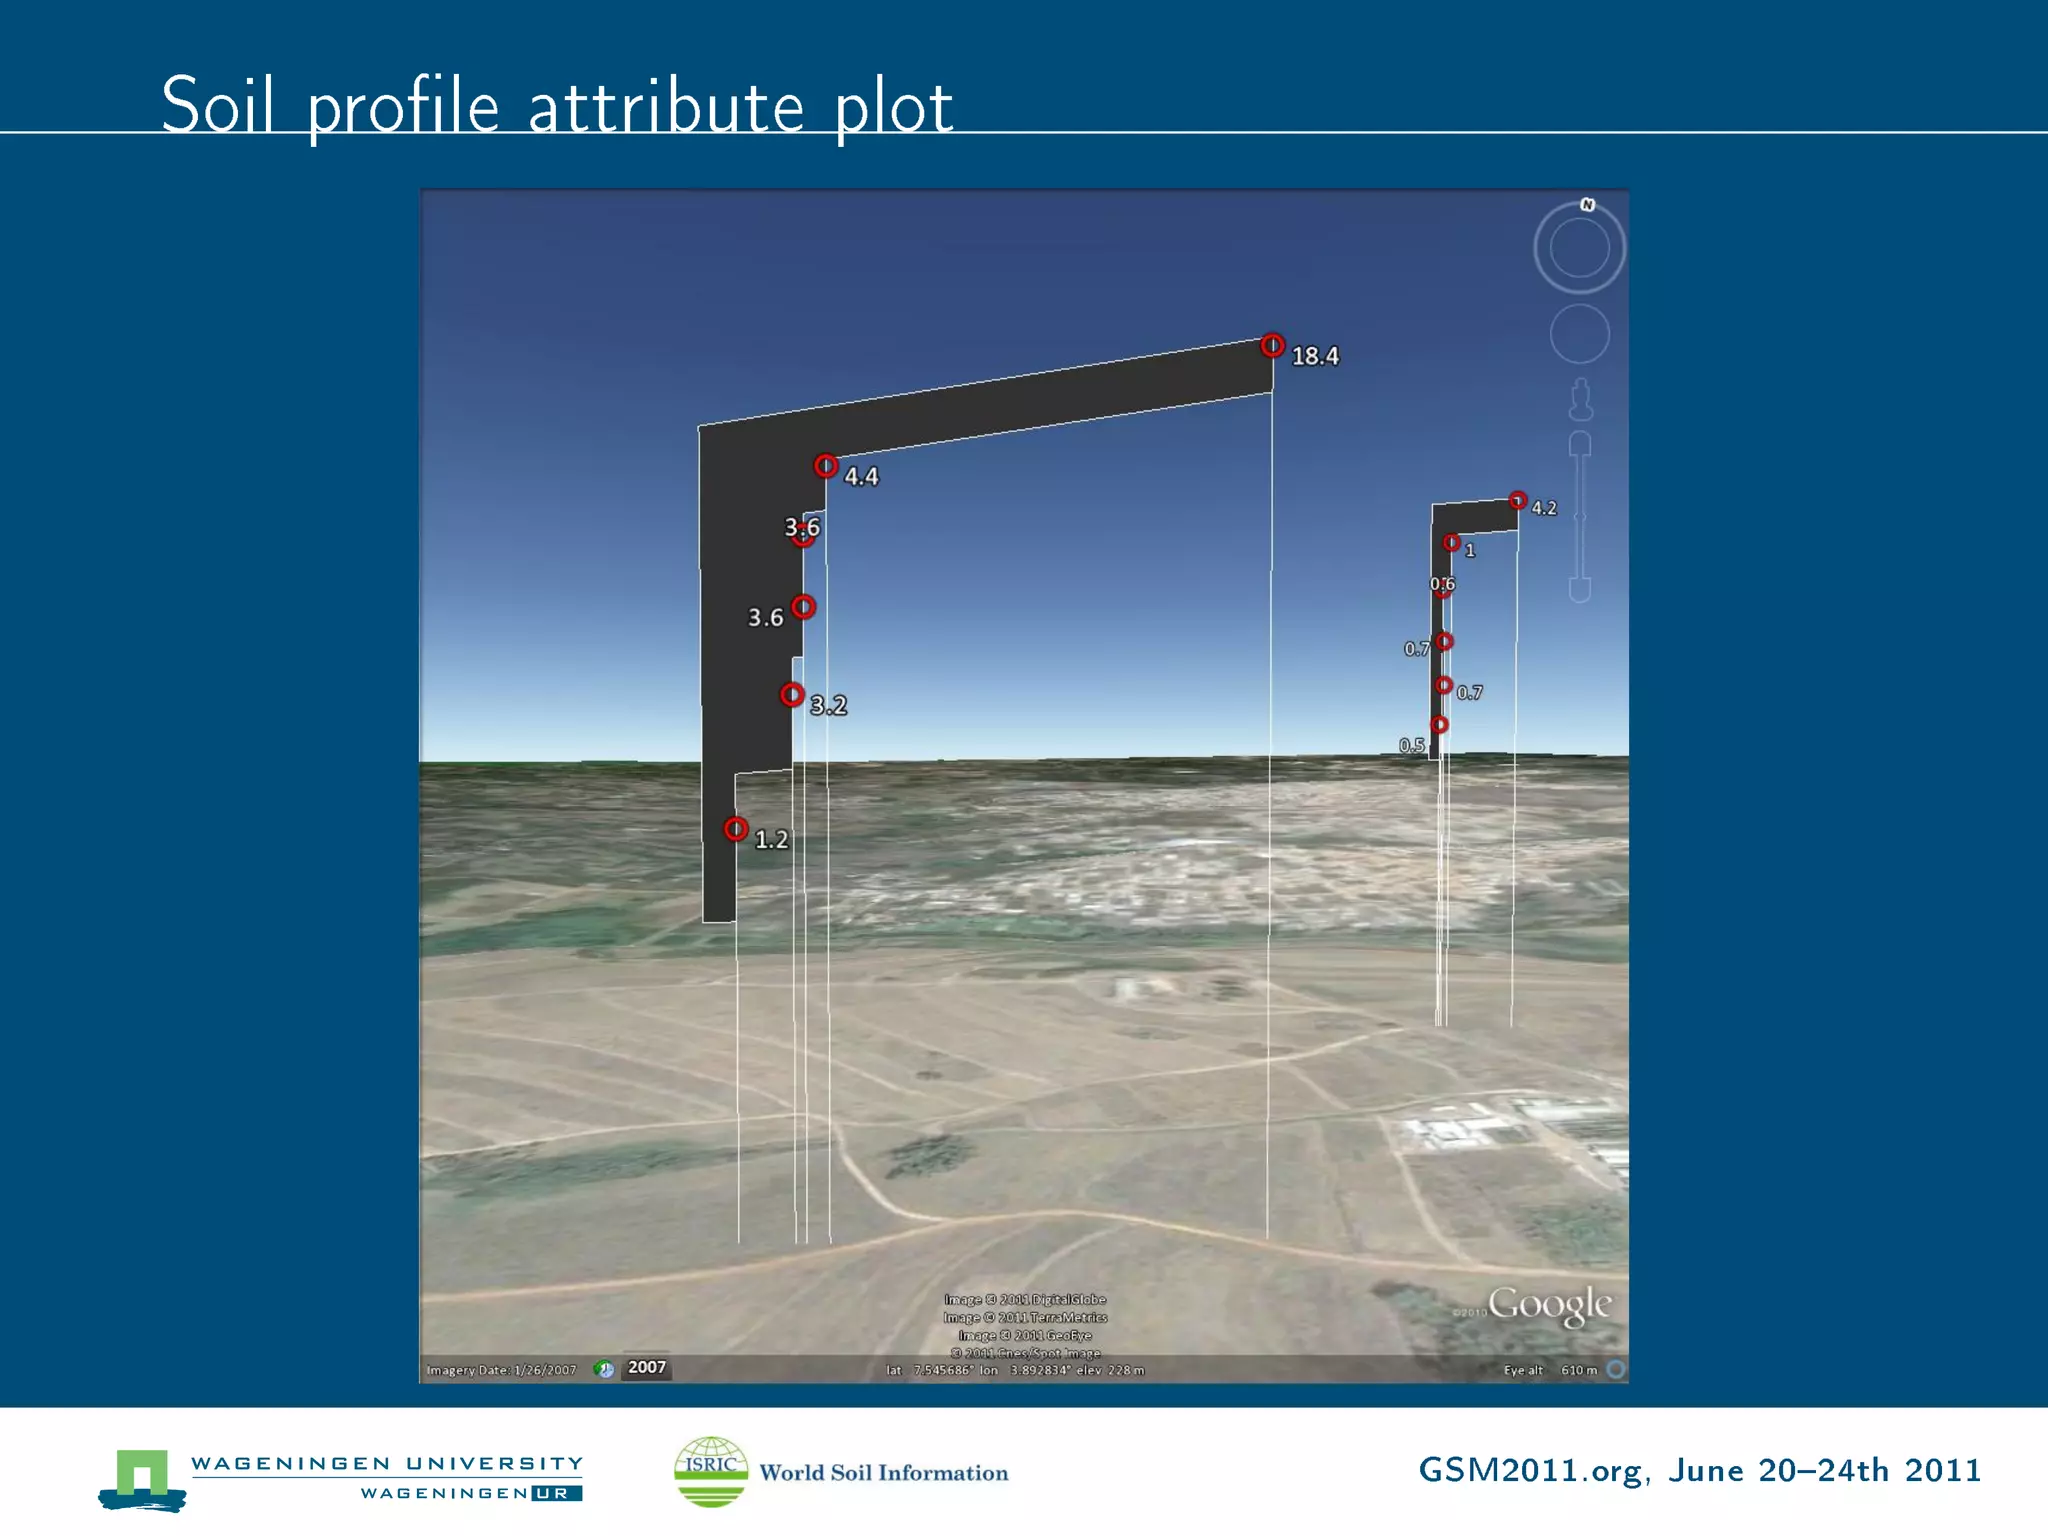
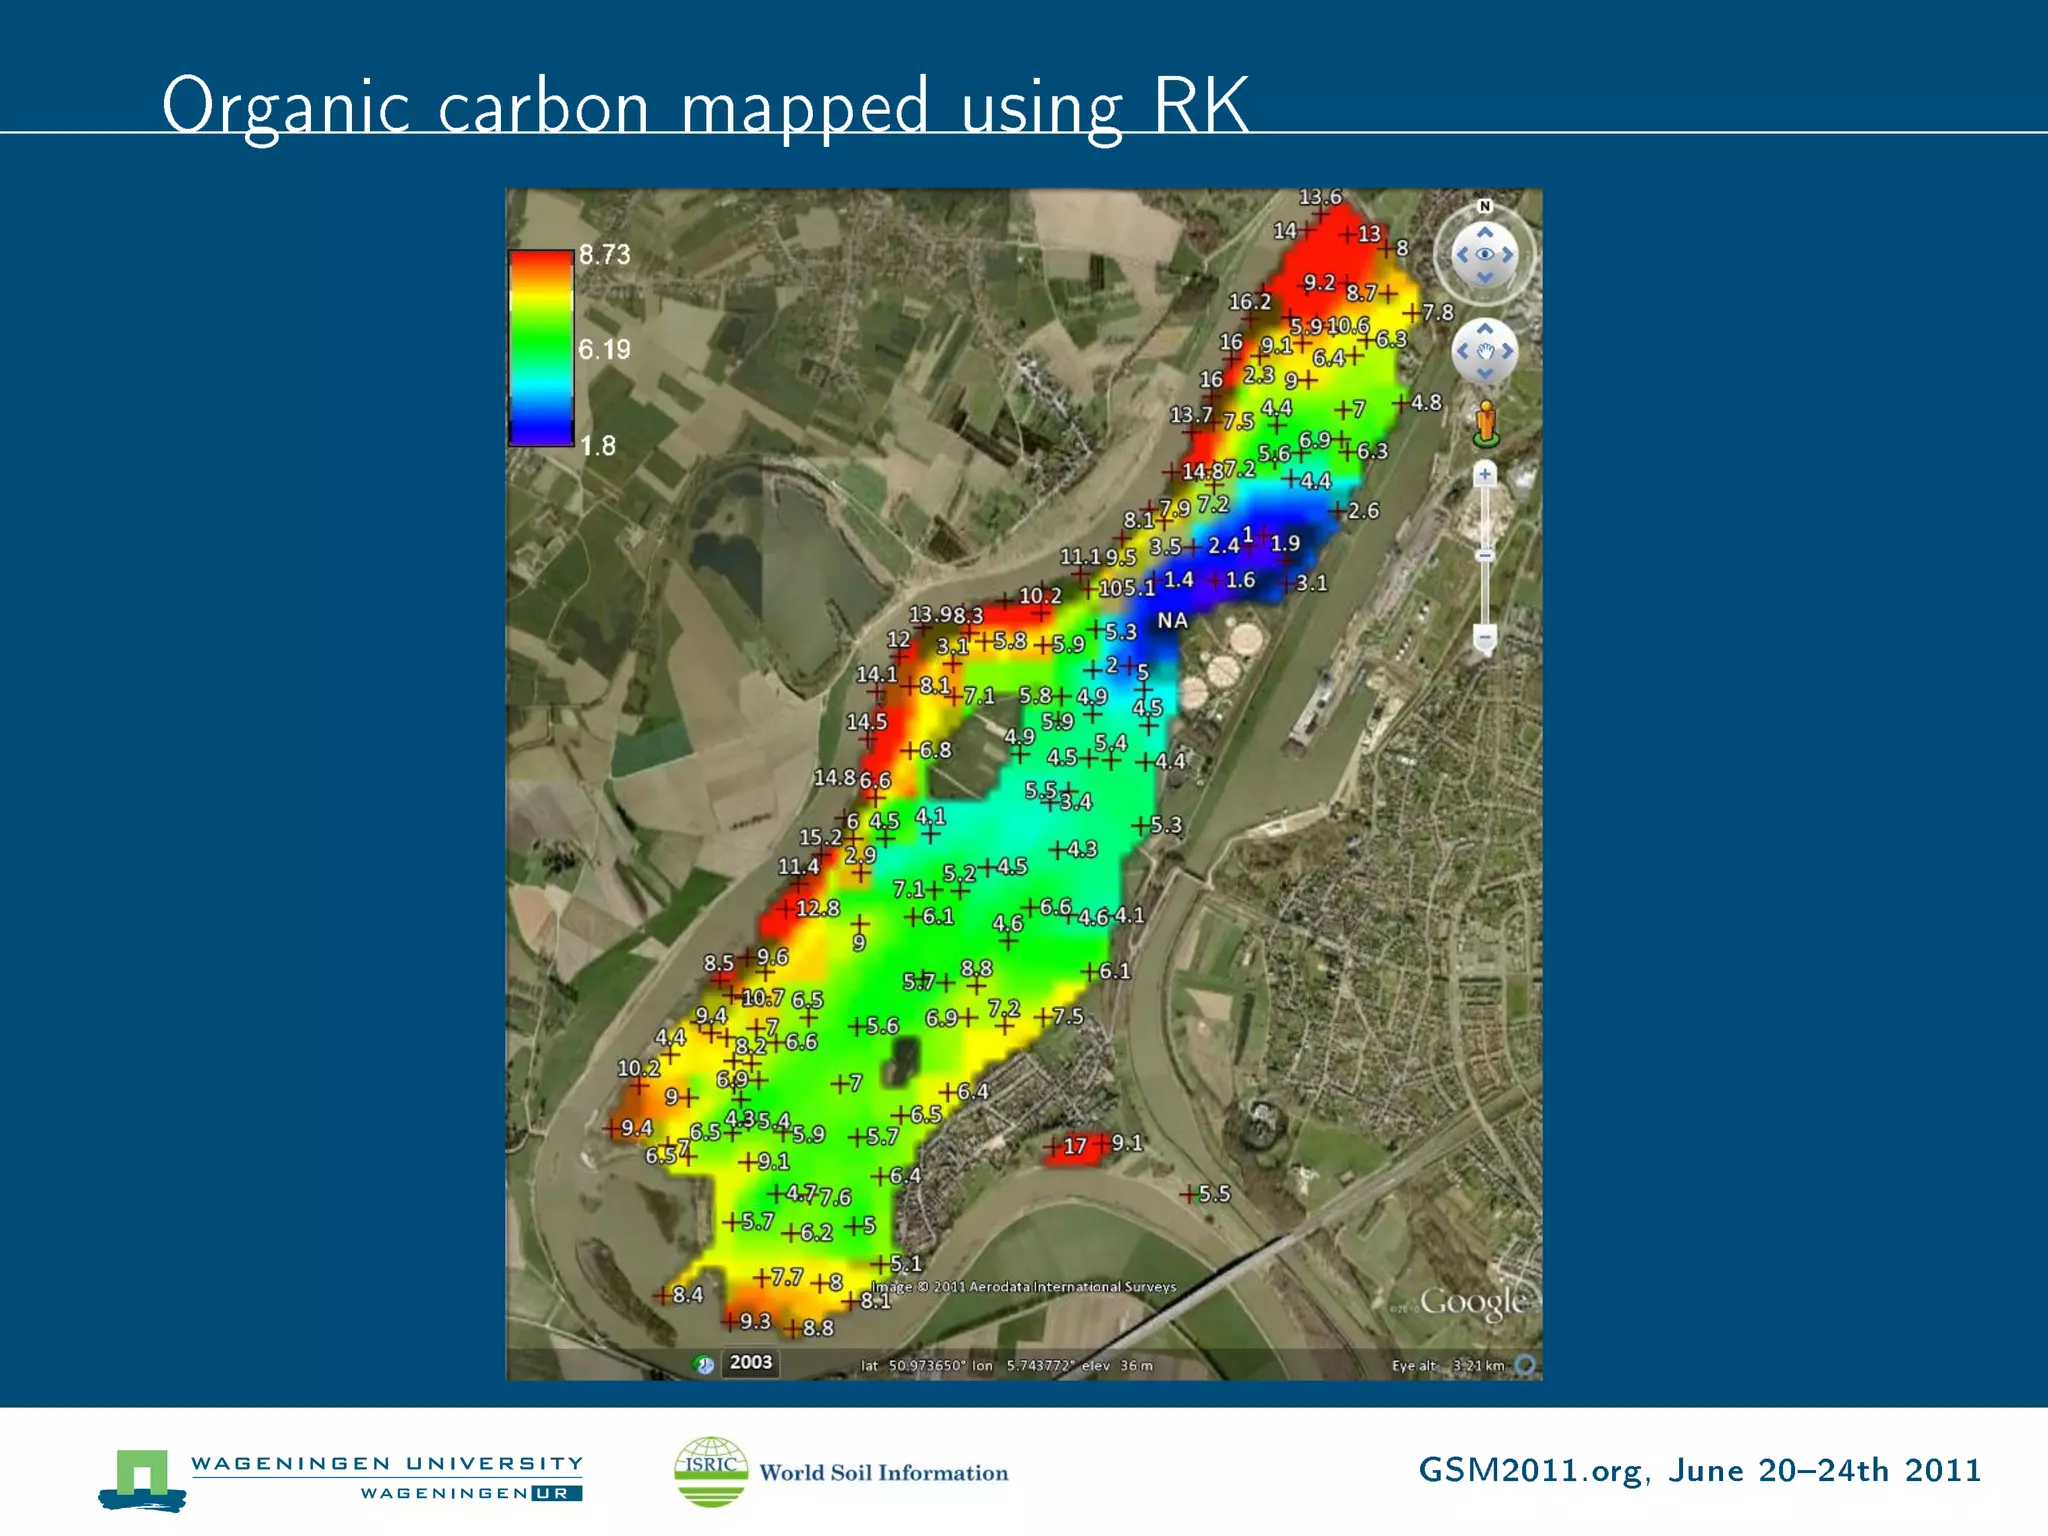
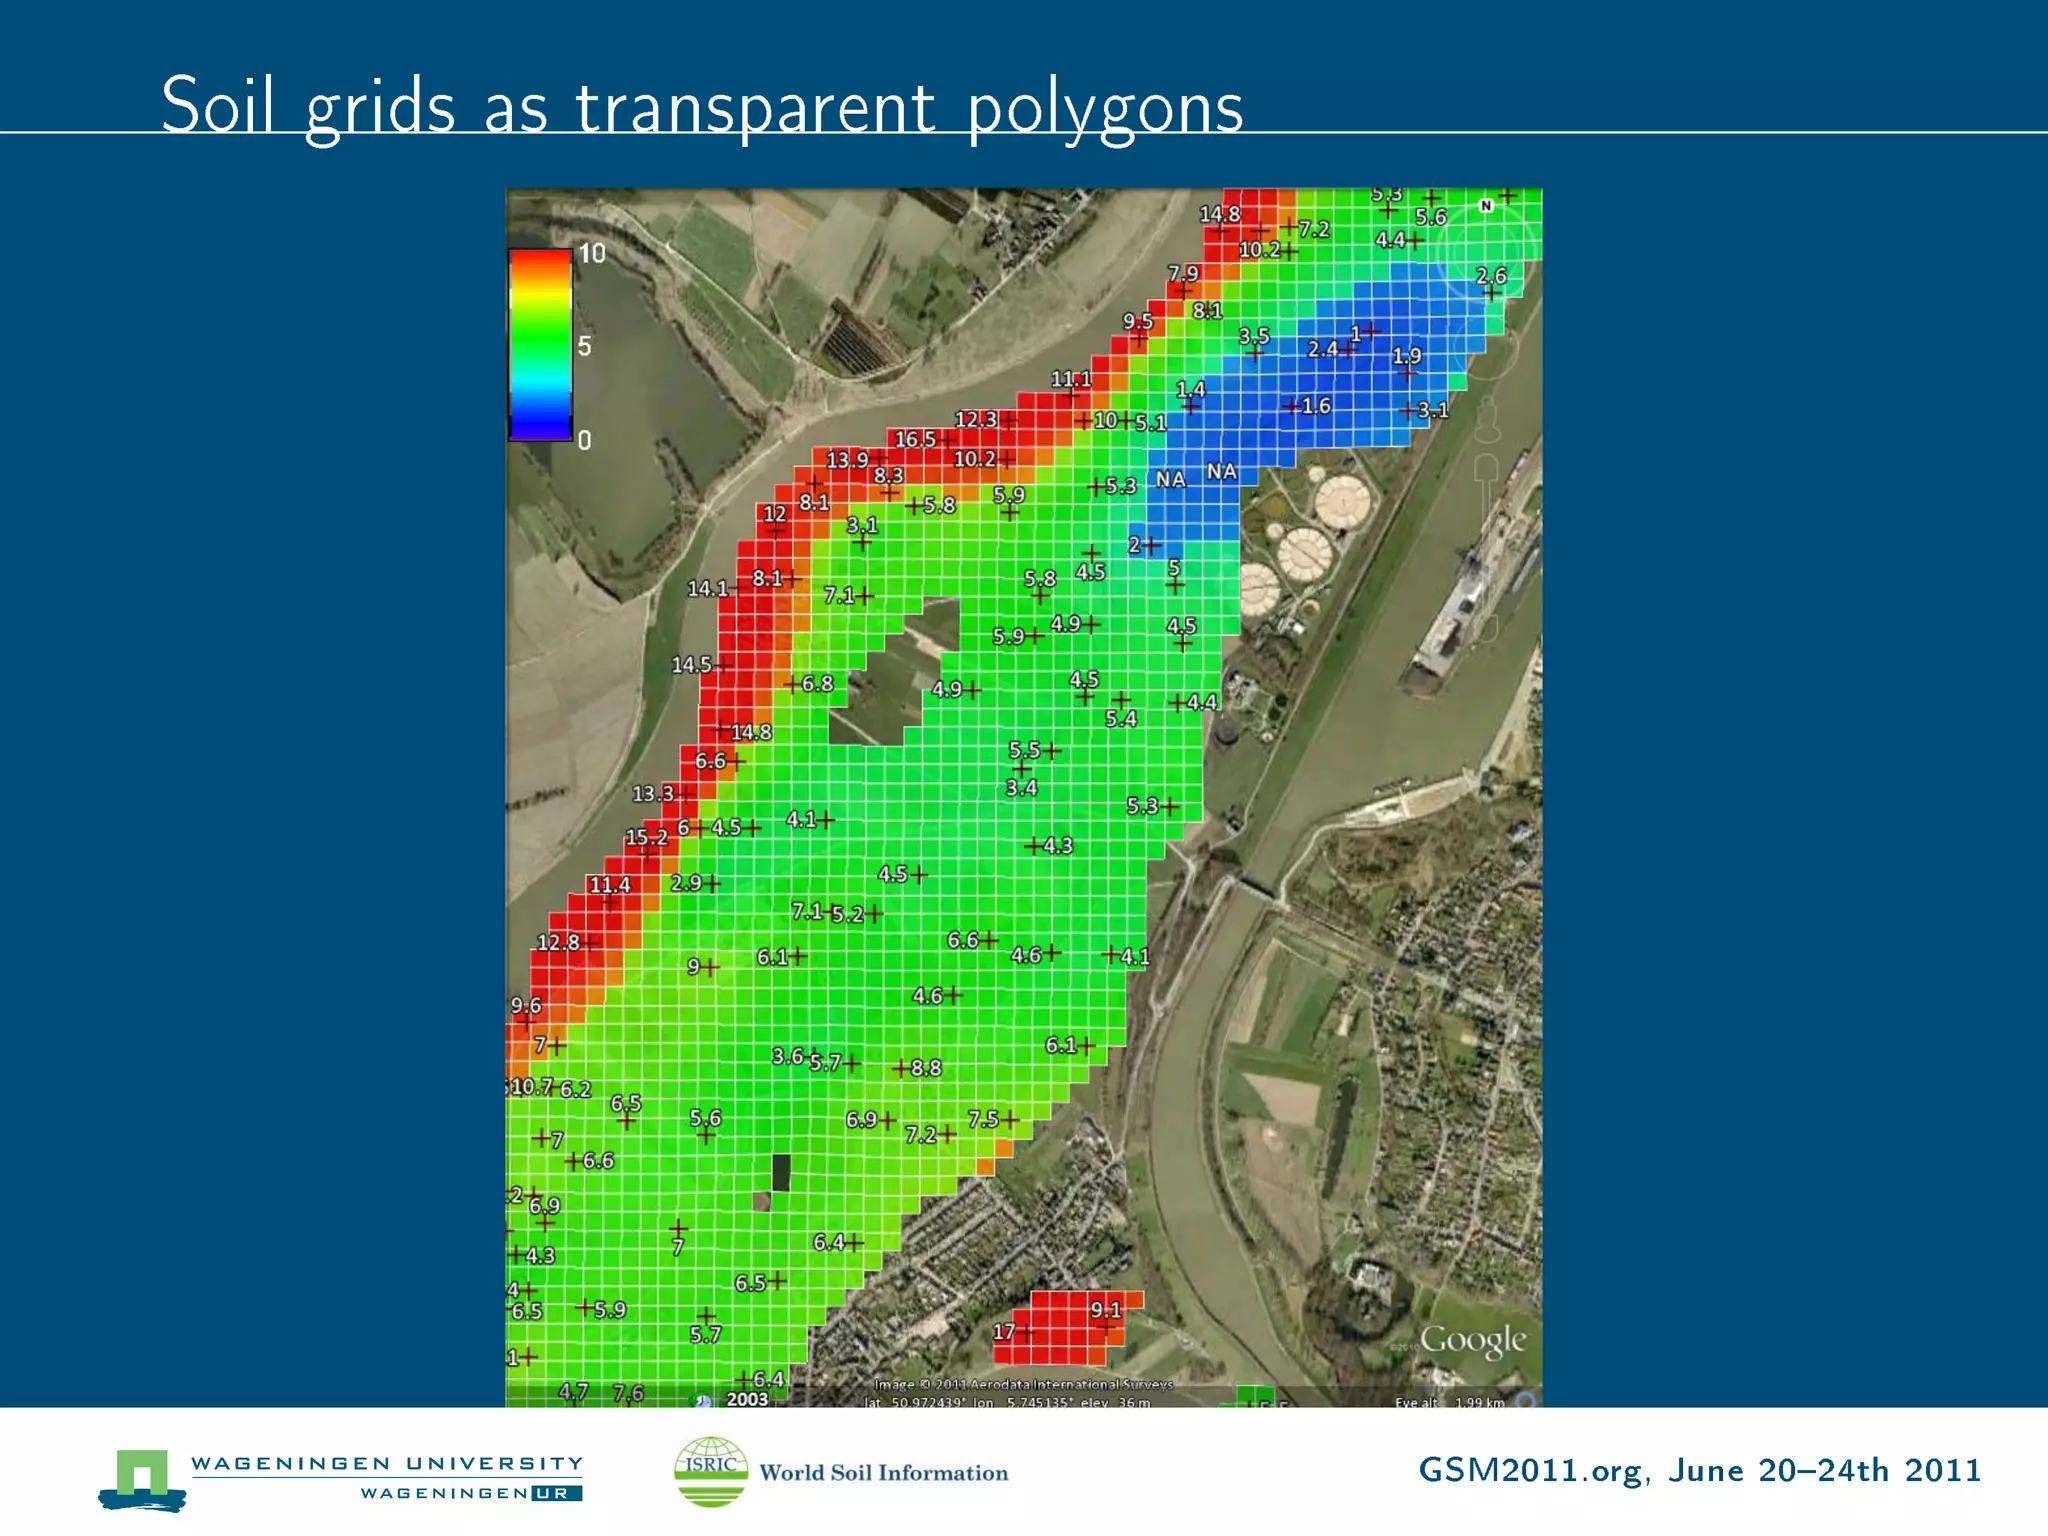
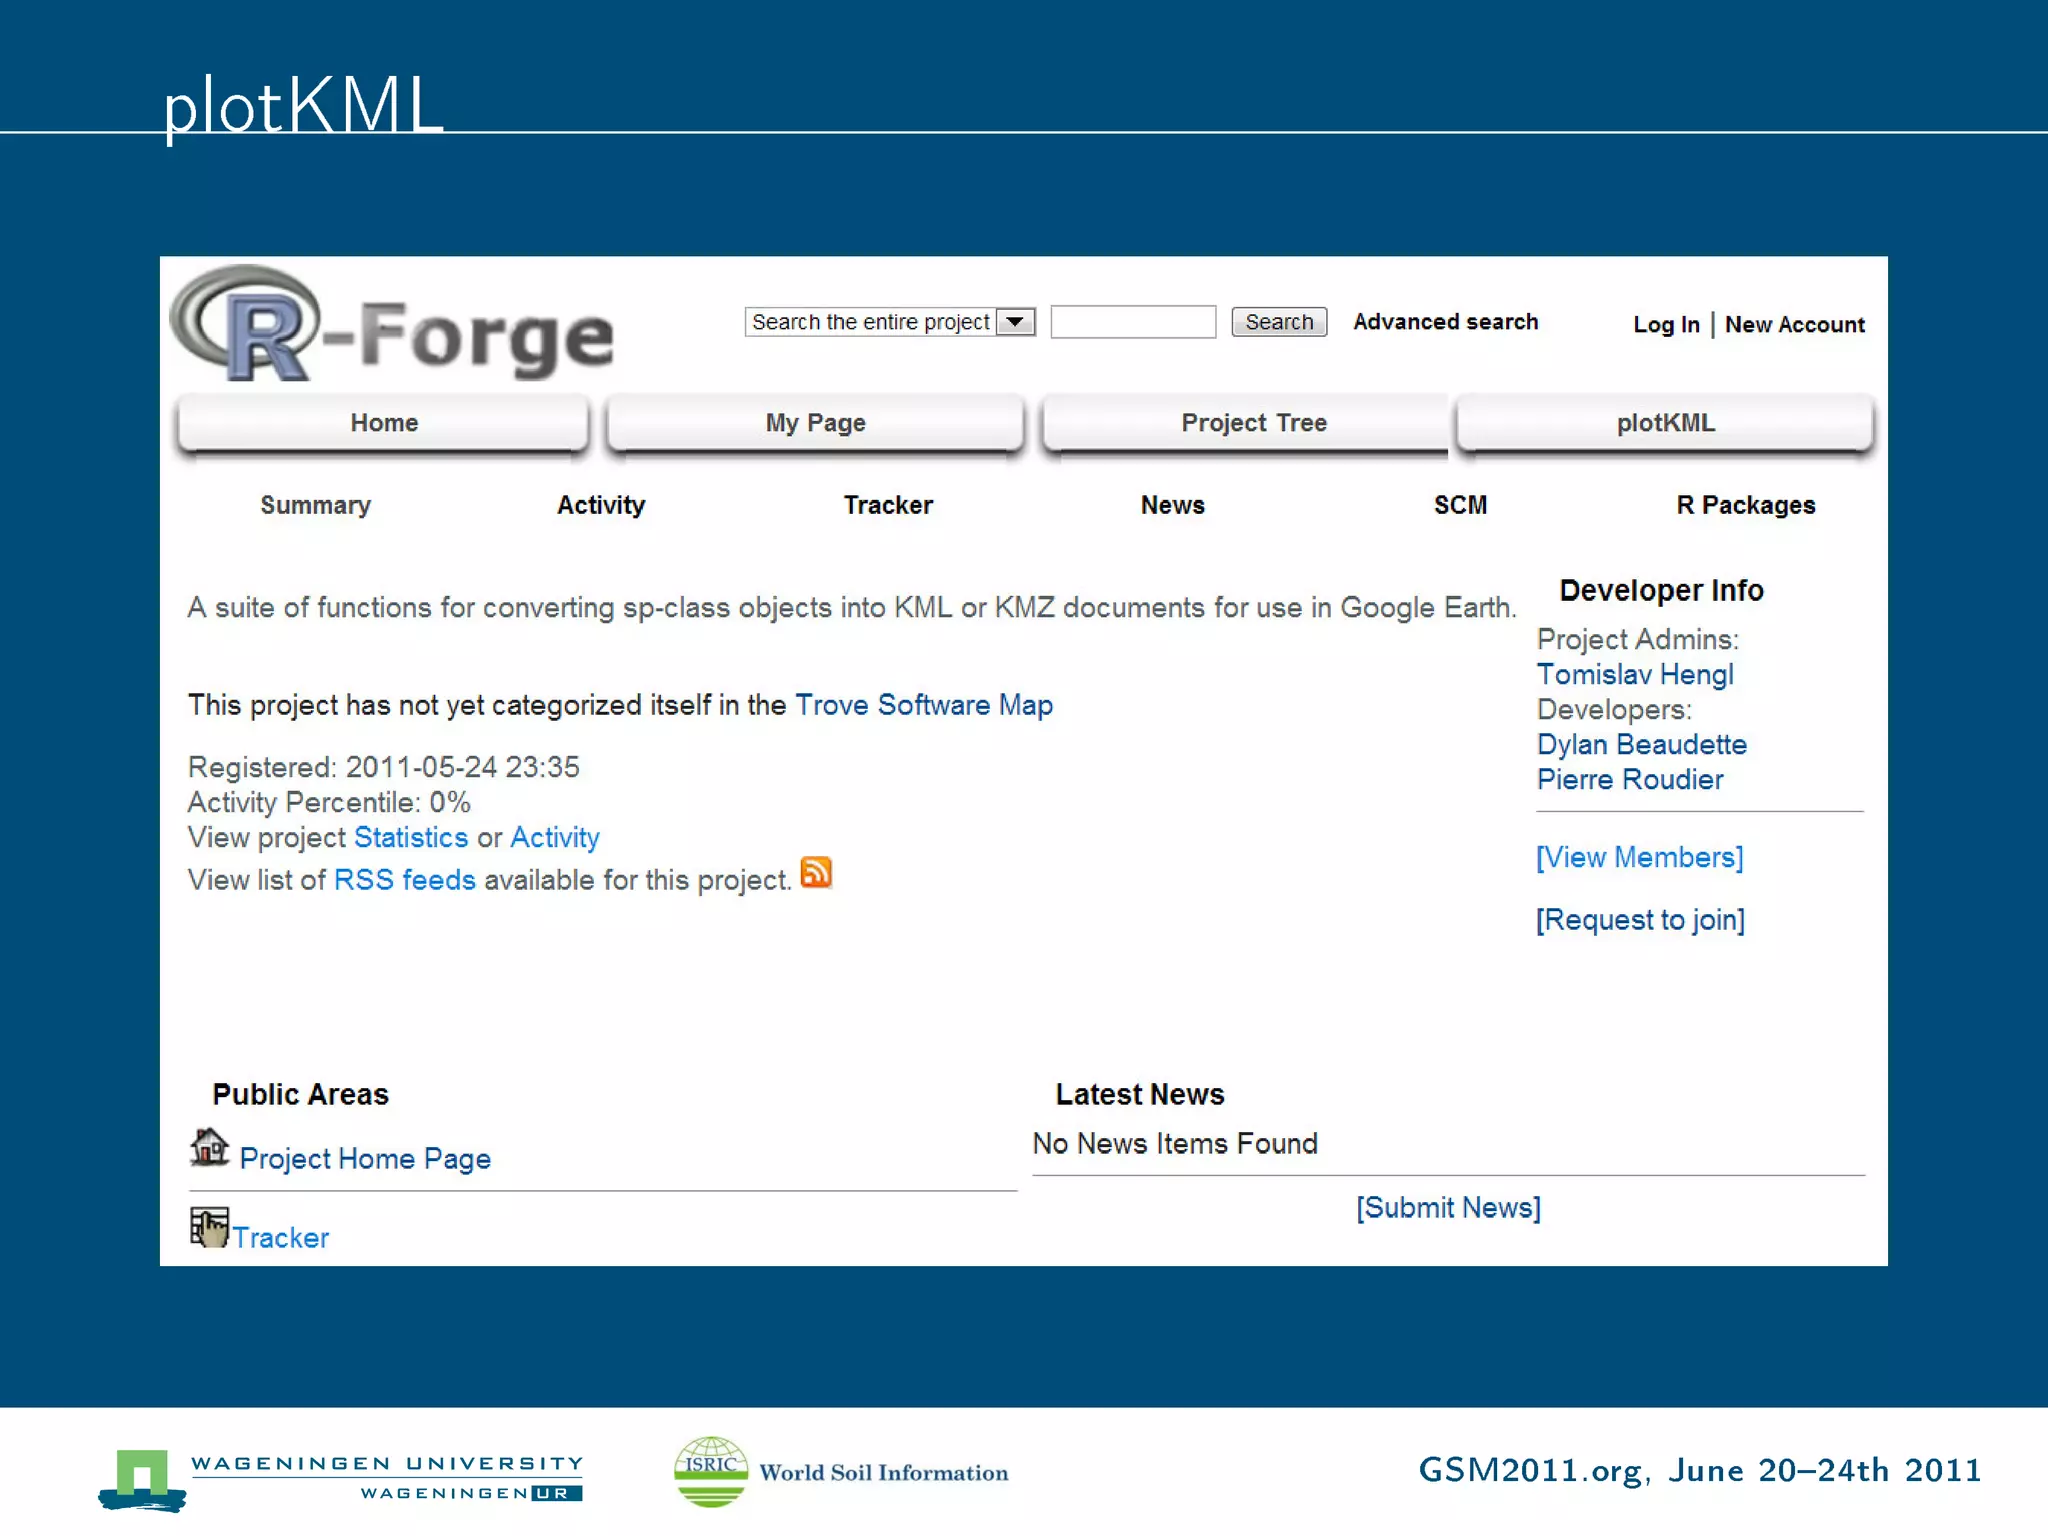
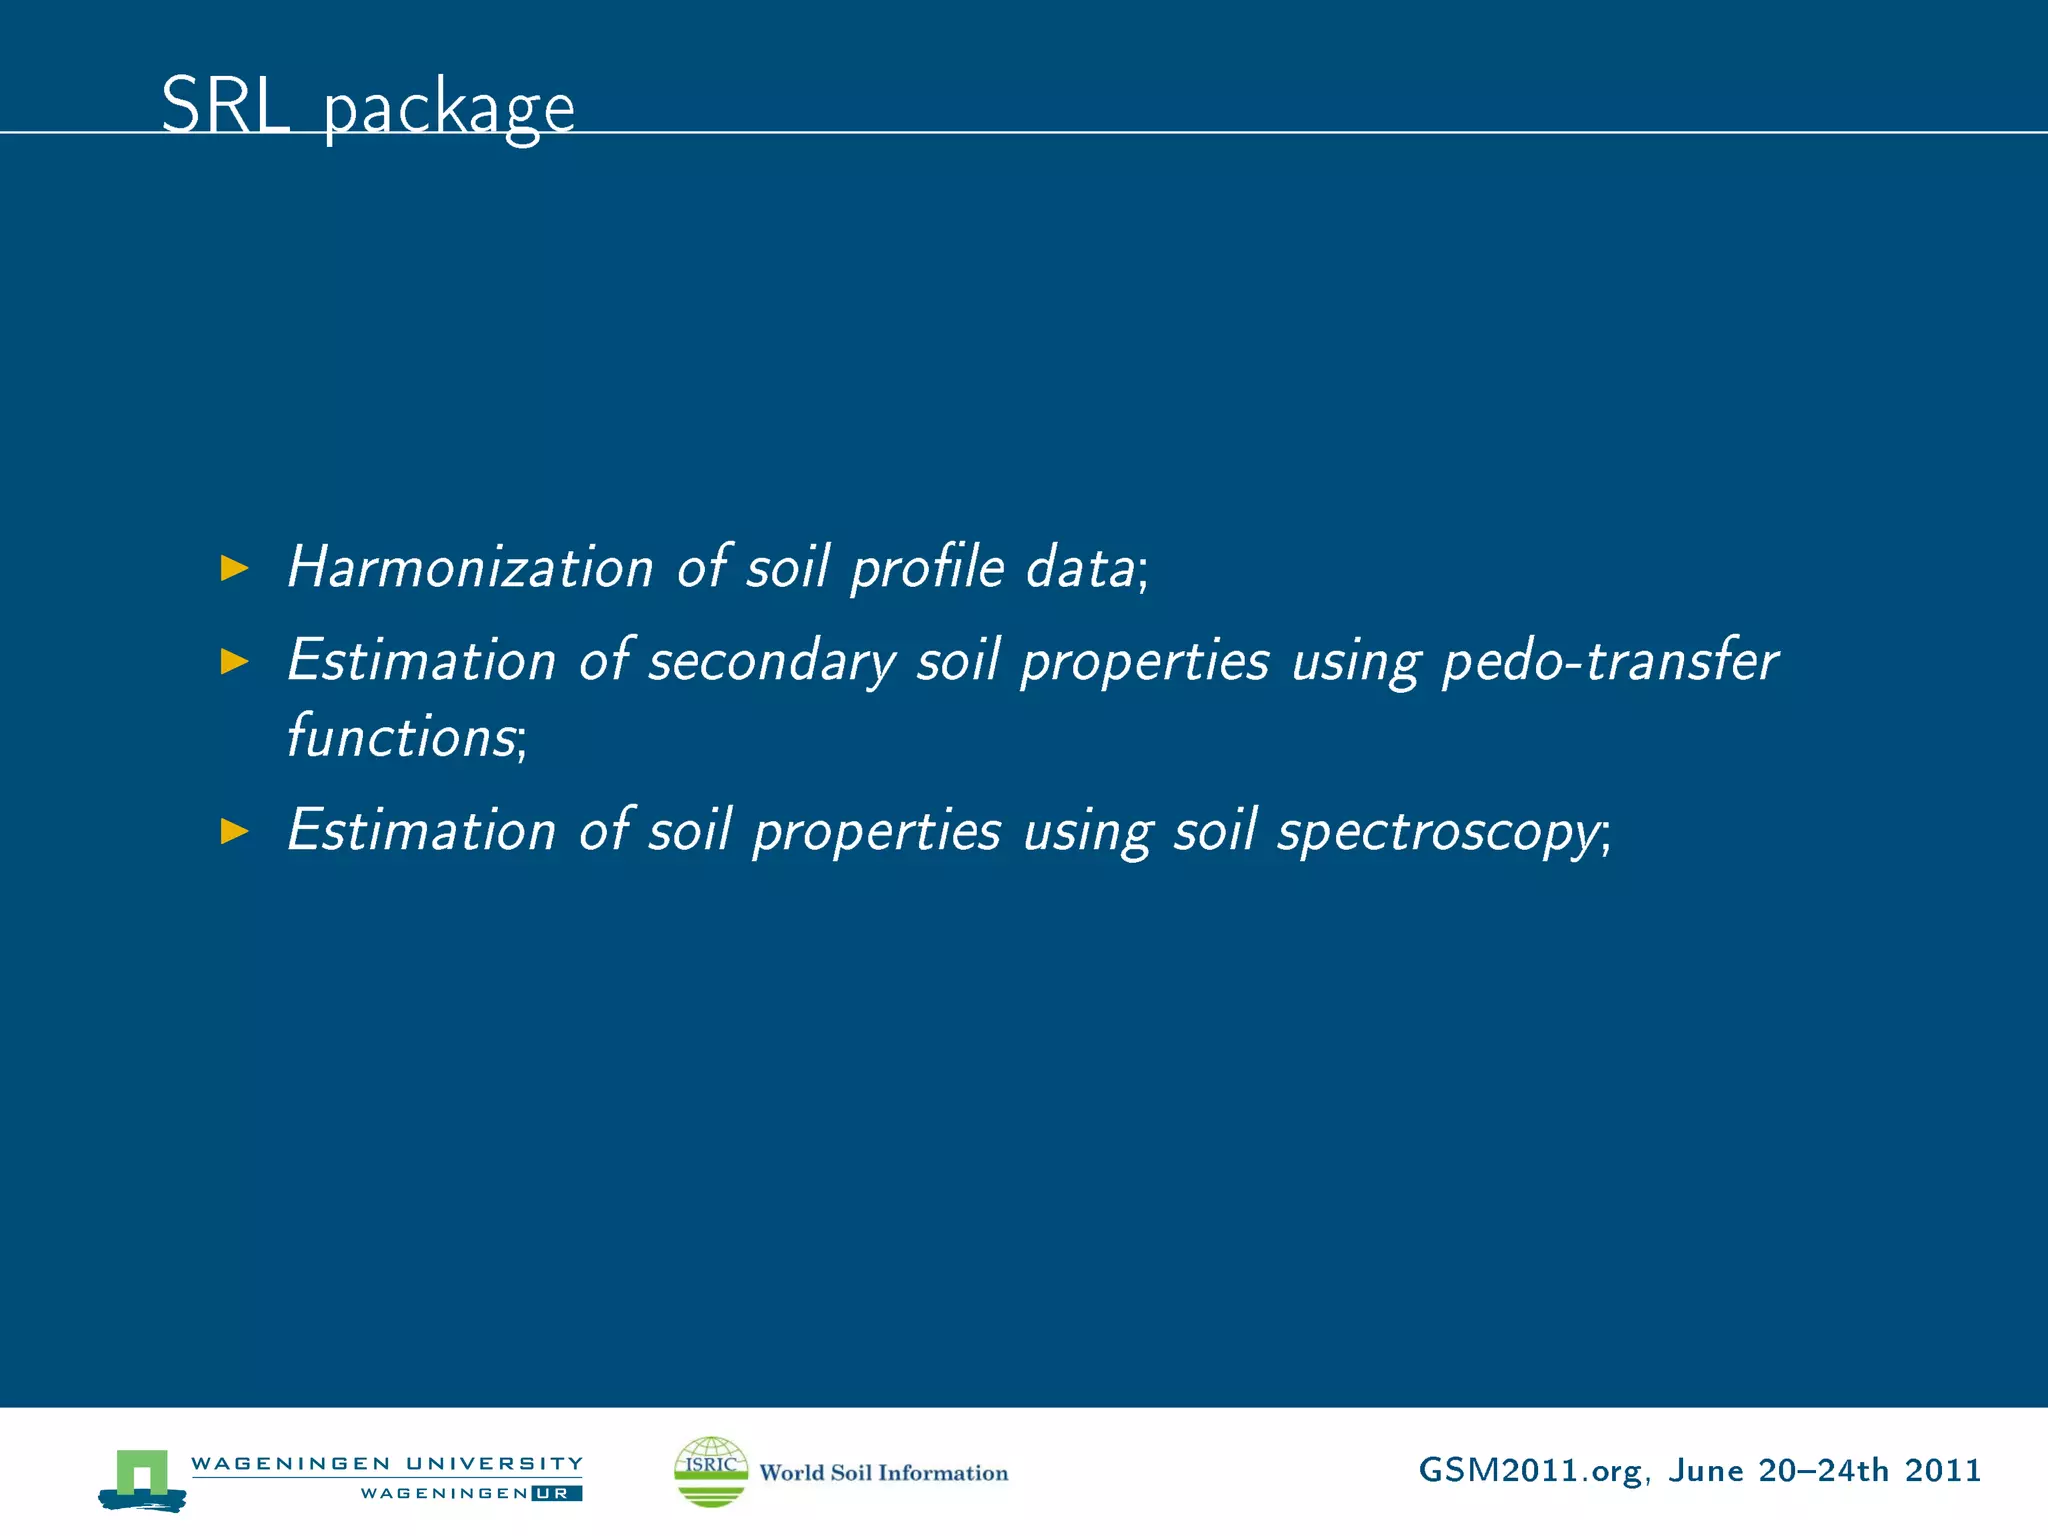
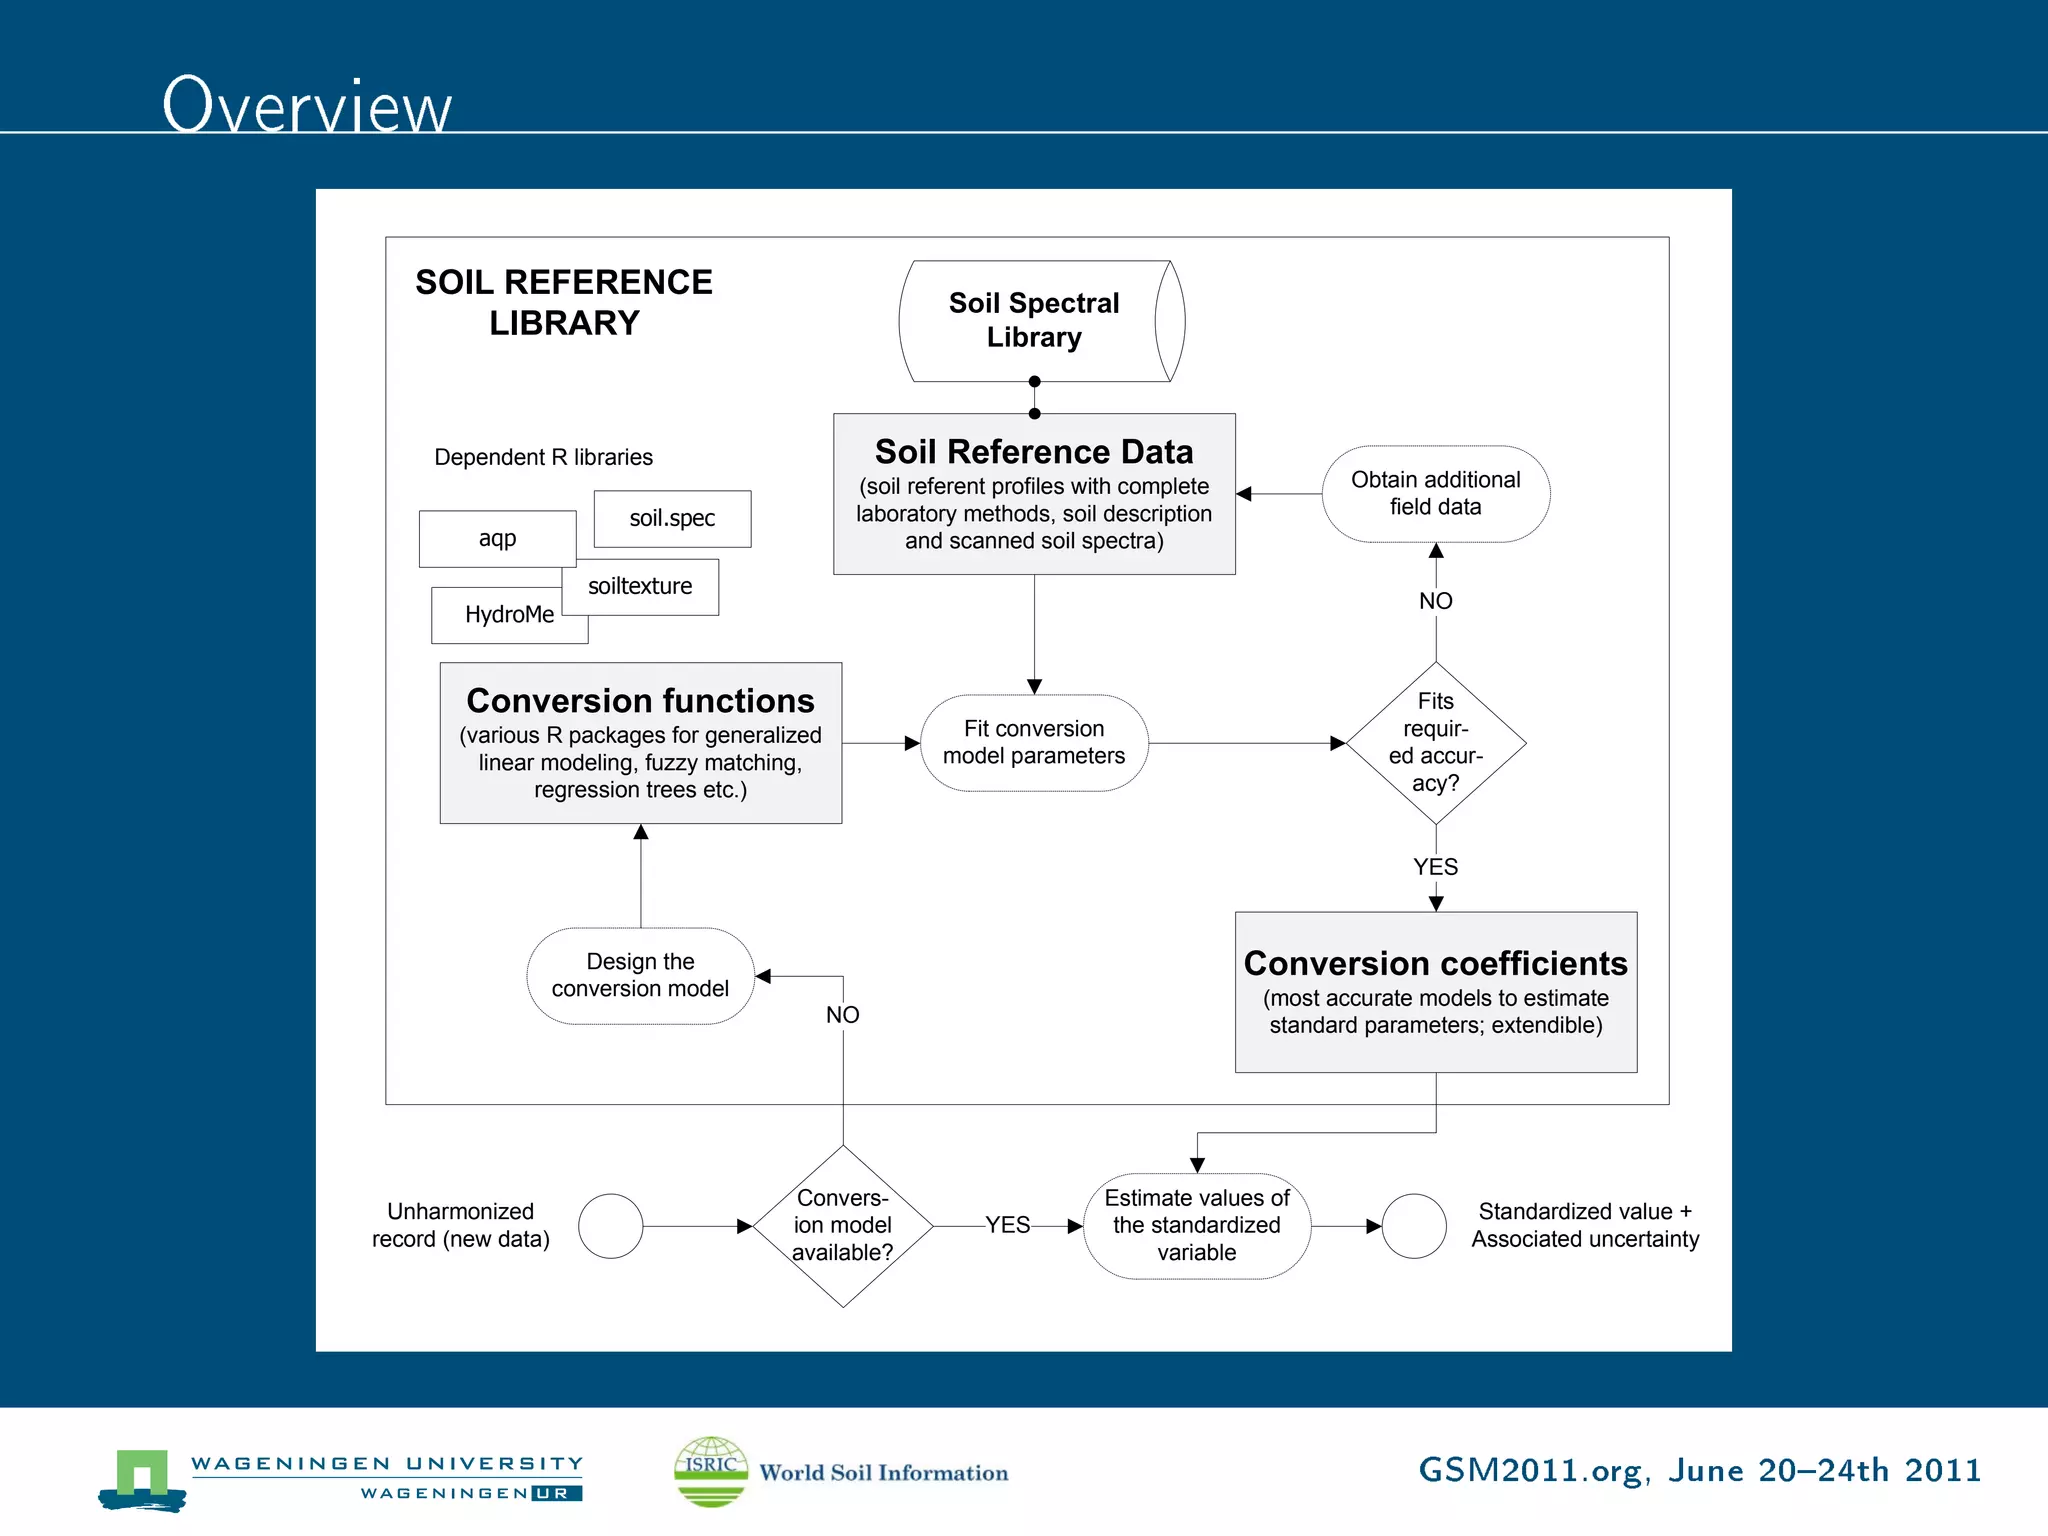
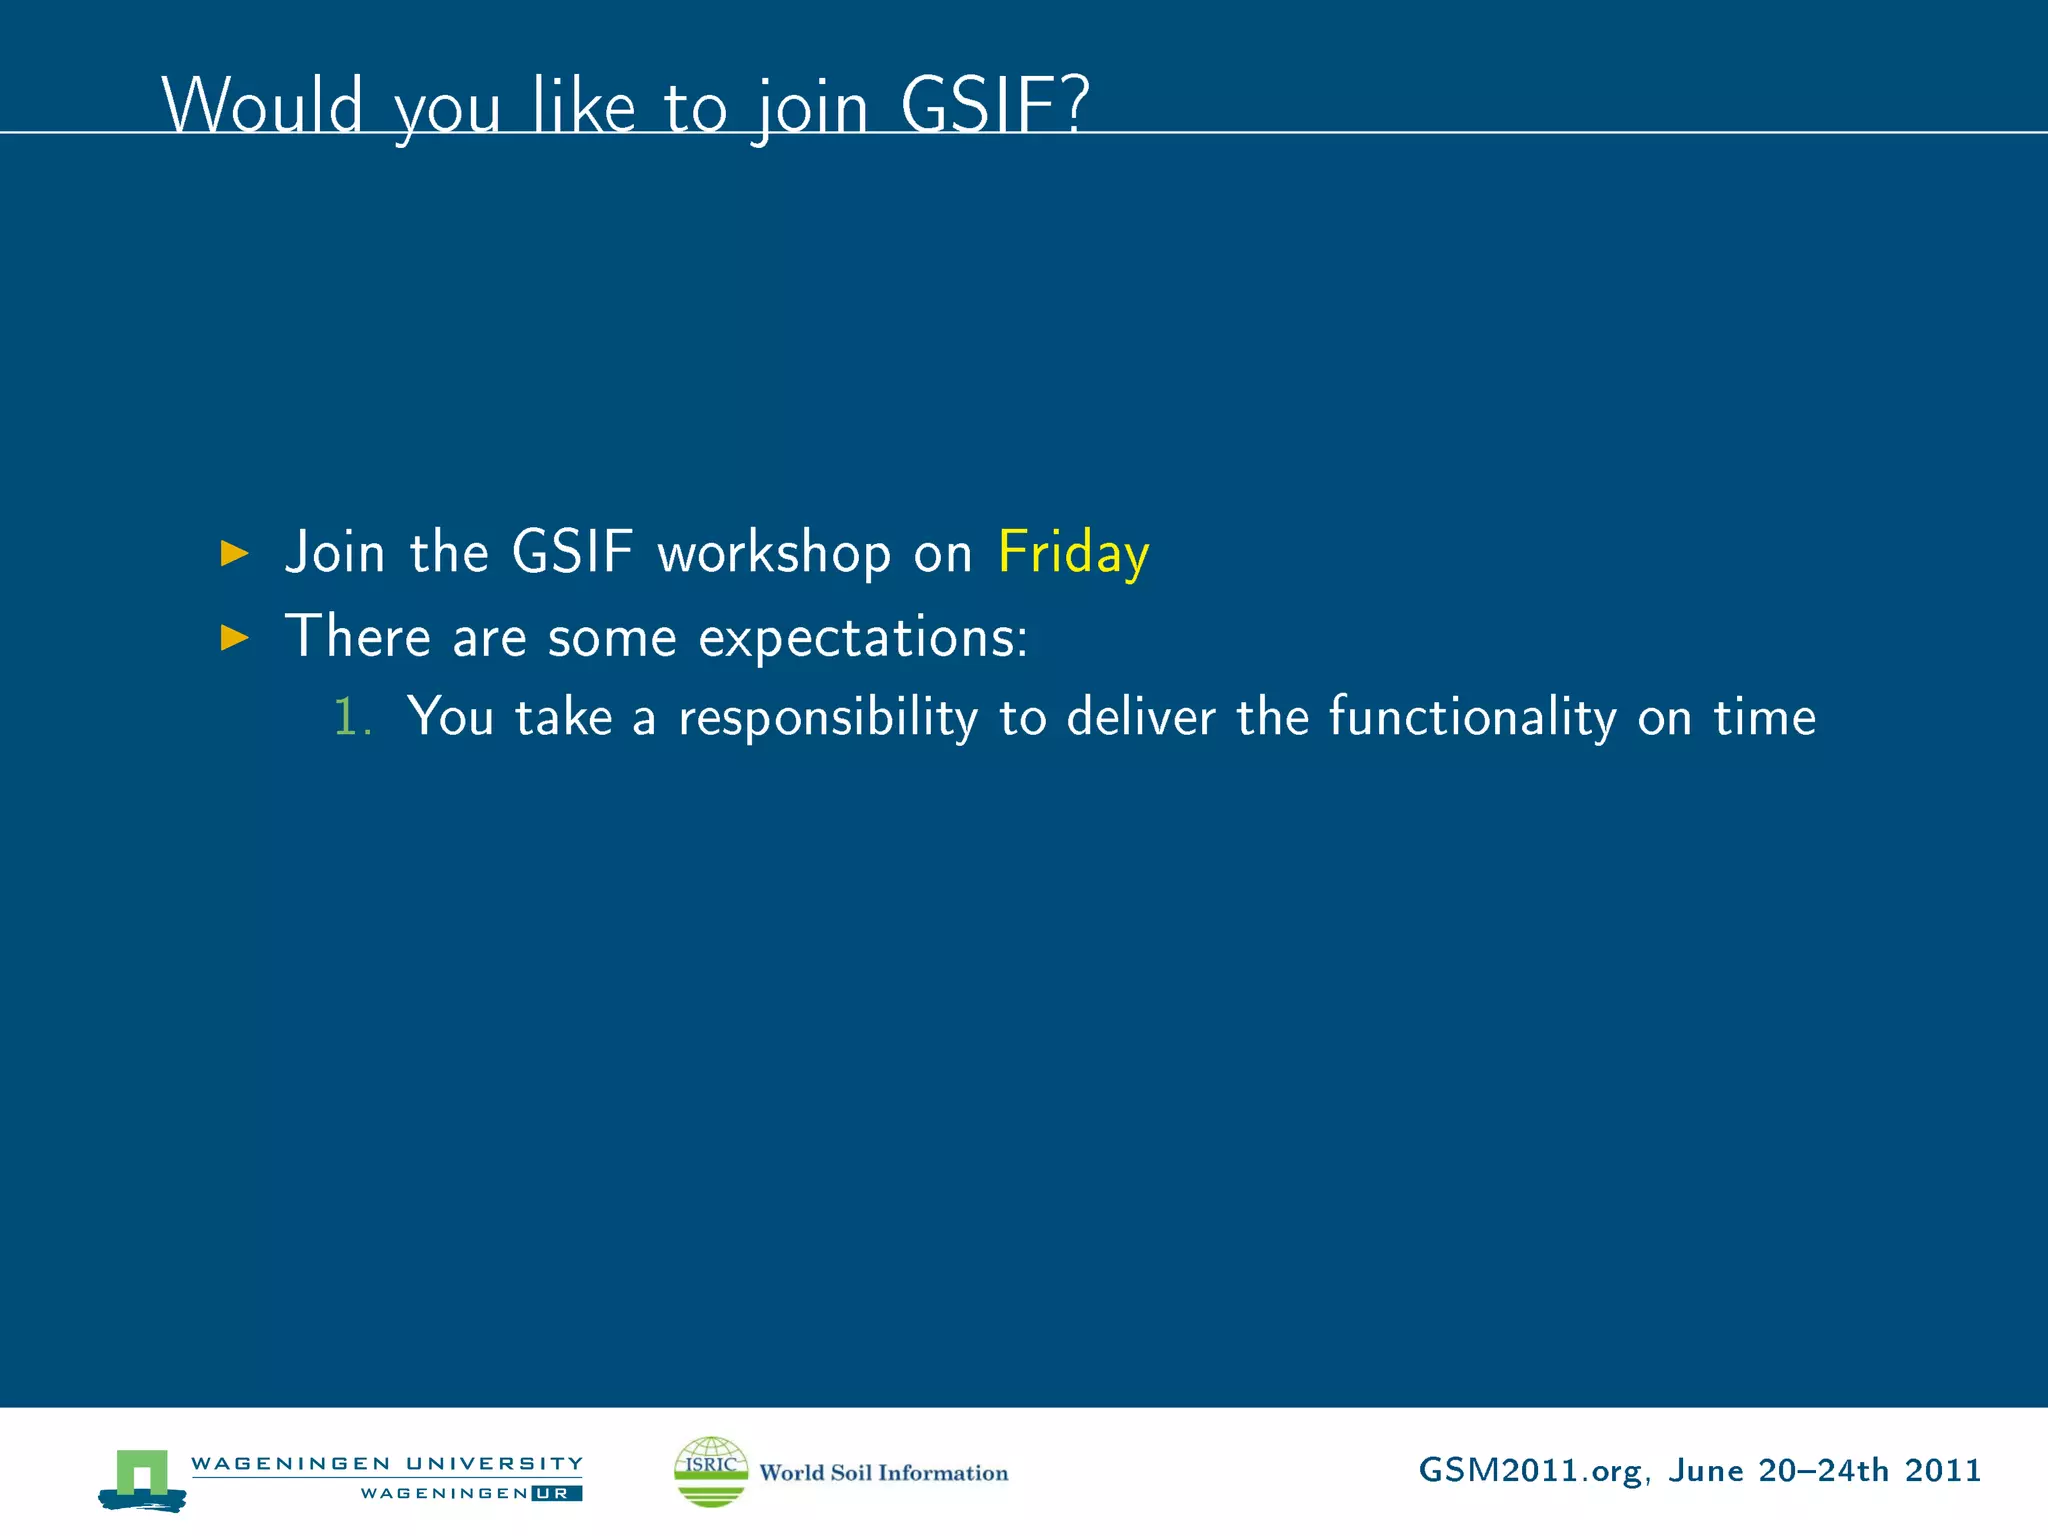
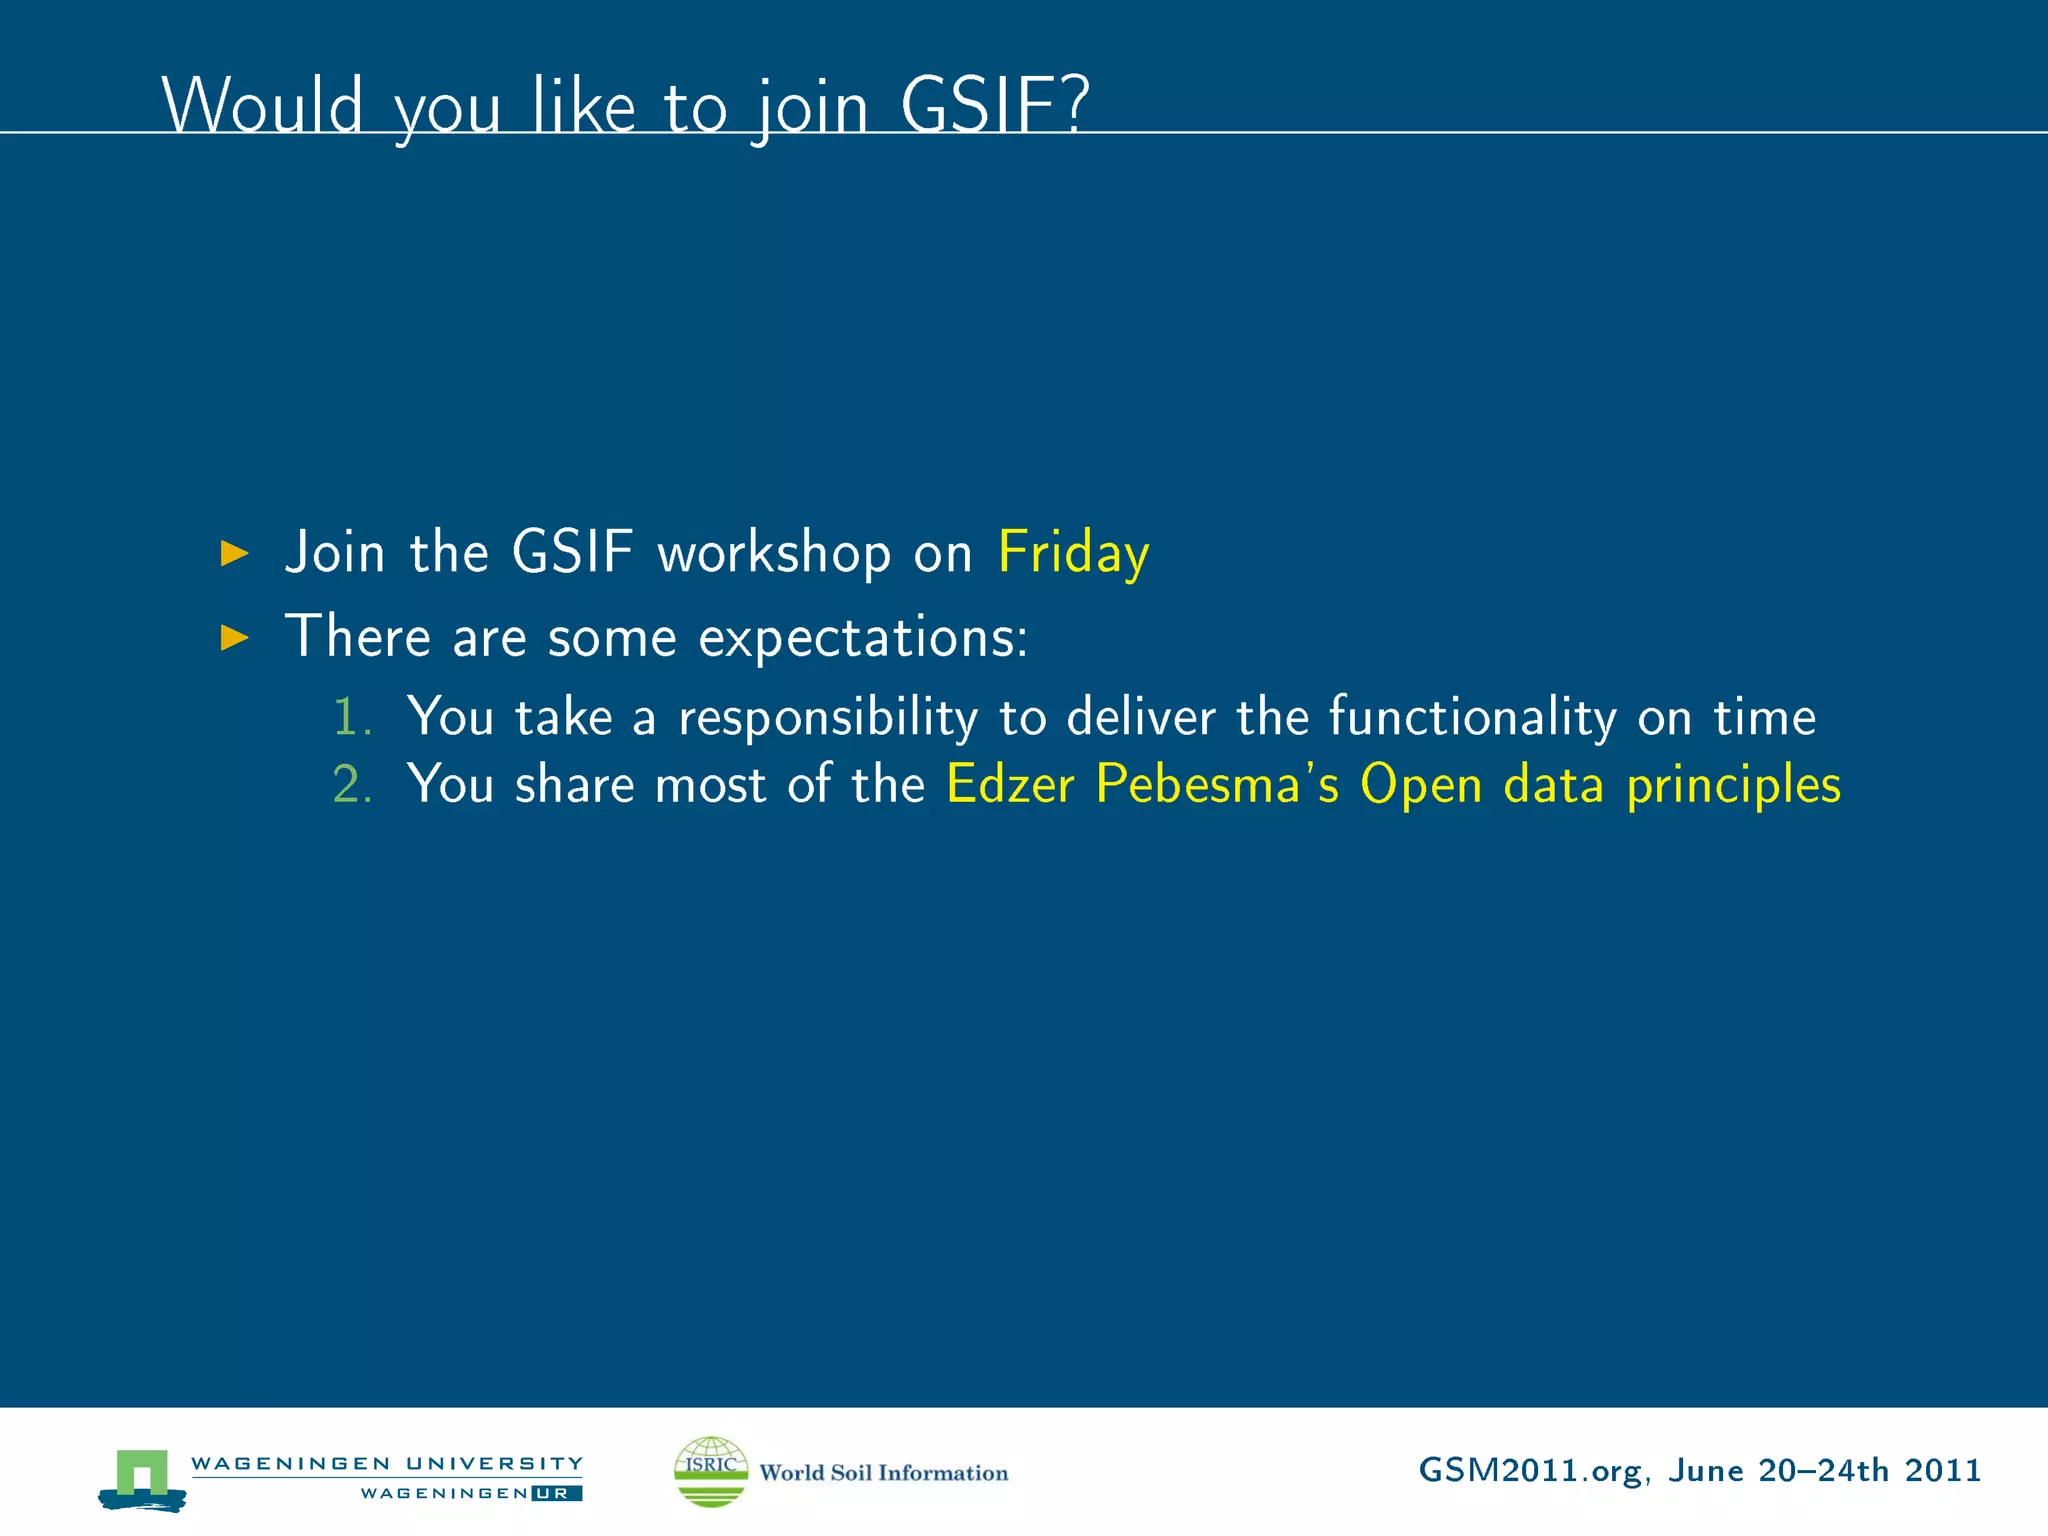
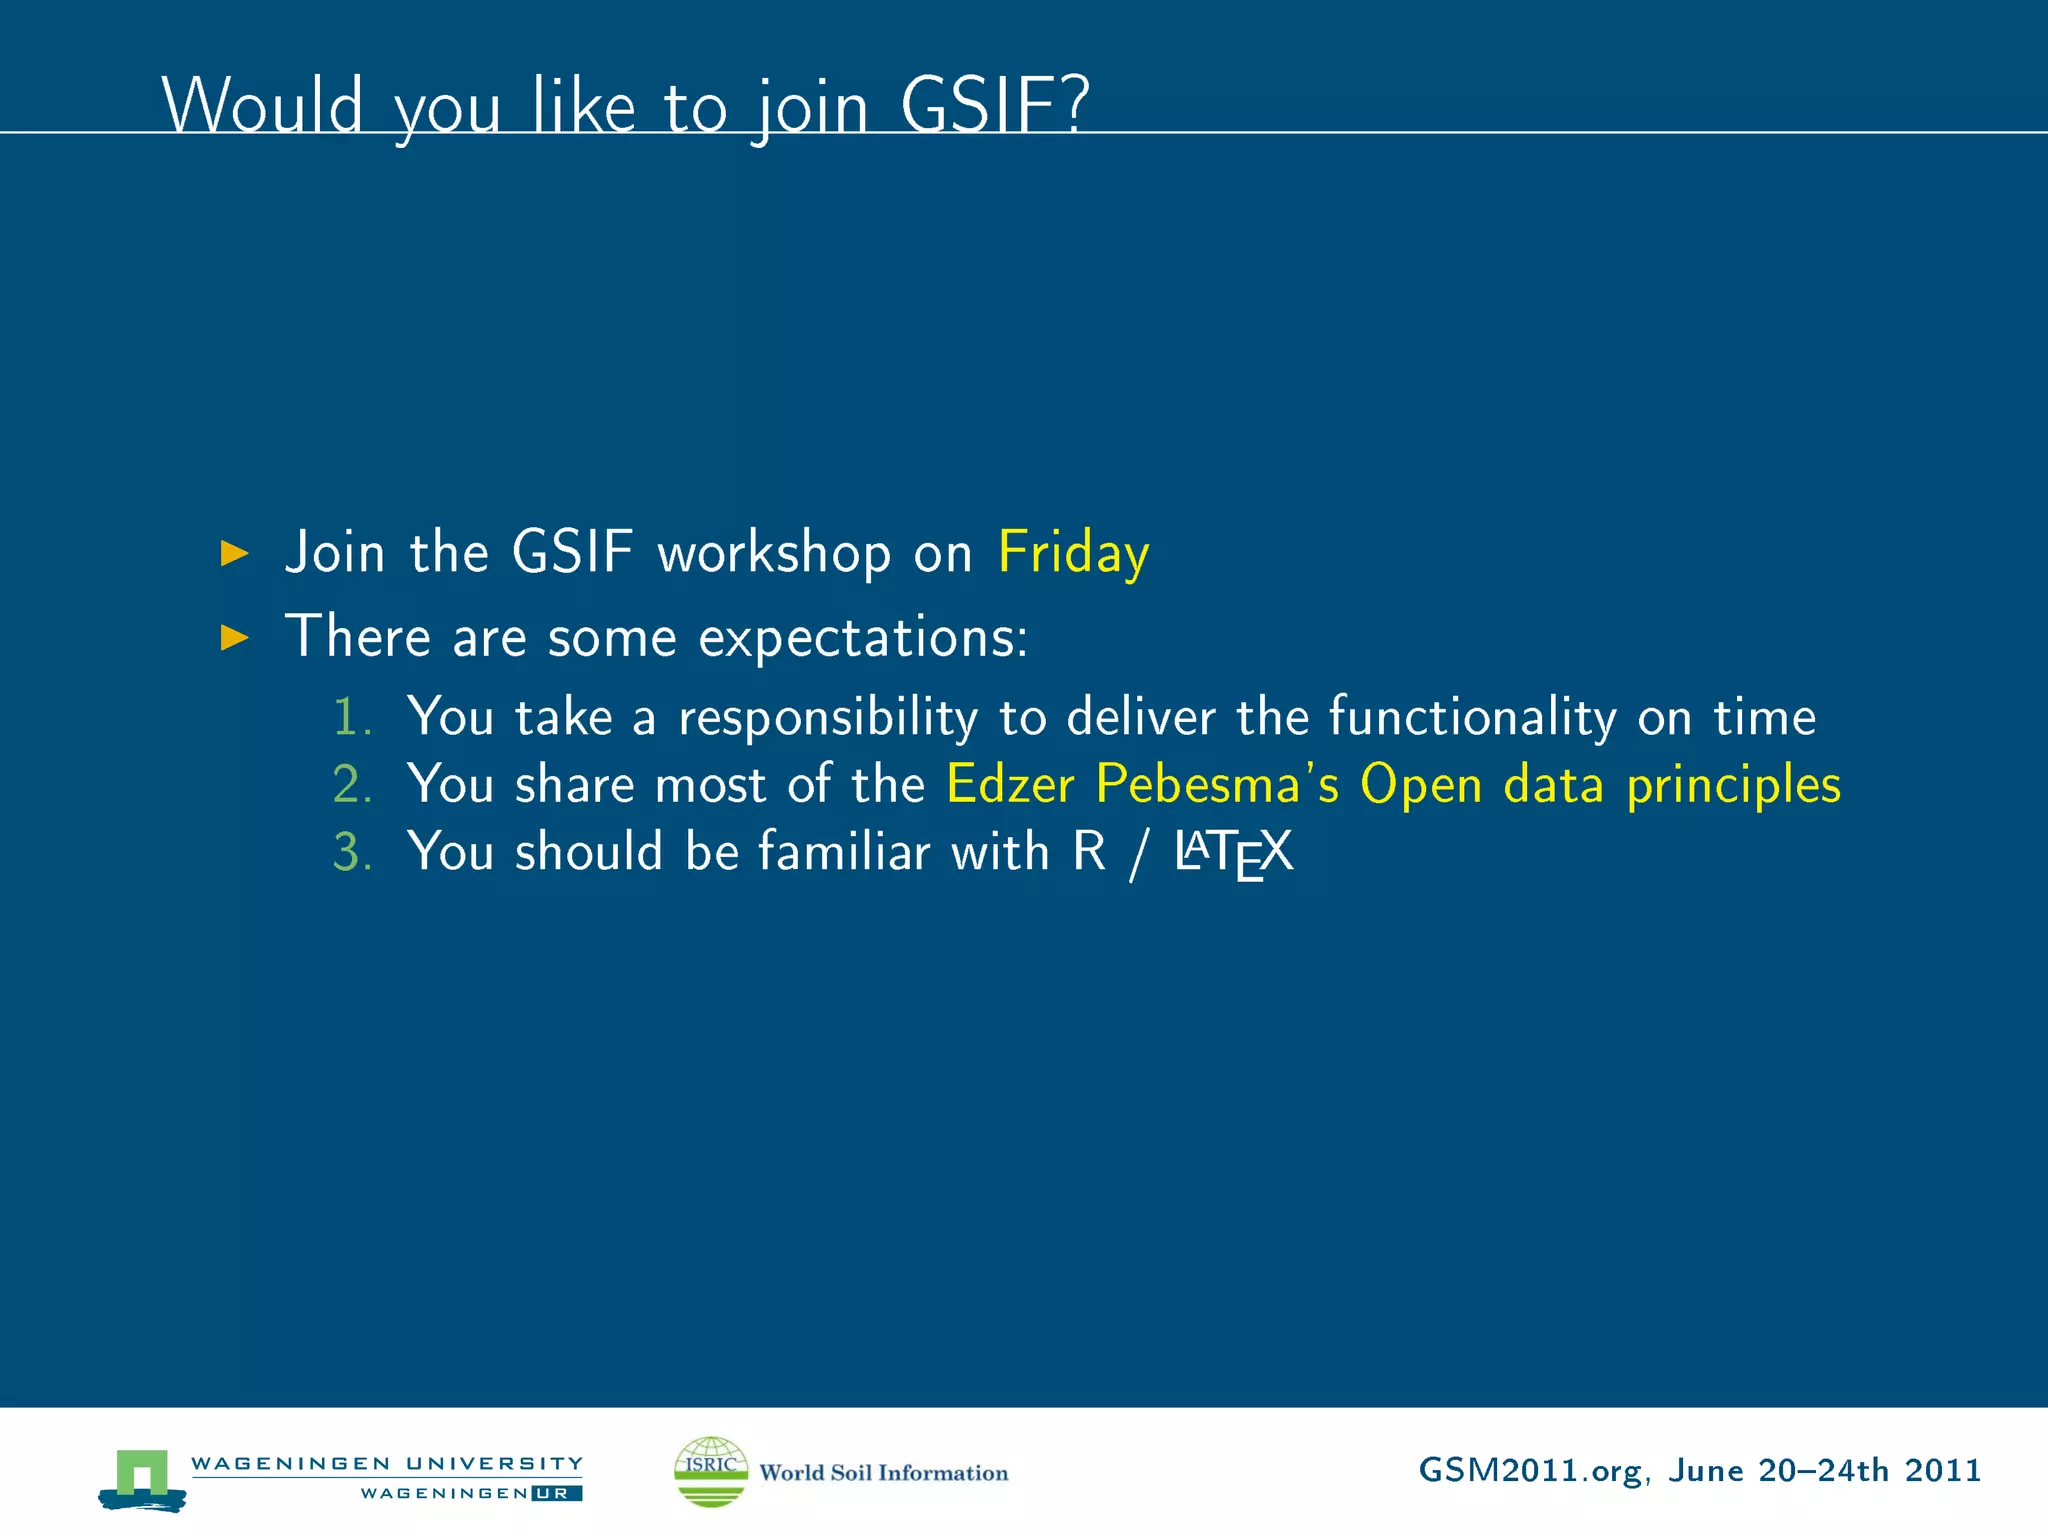
This document discusses the development of software tools called Global Soil Information Facilities (GSIF) for global soil mapping. It describes existing GSIF components like global soil databases and proposed new modules for tasks like data entry, harmonization, spatial analysis, and visualization. Key proposed software include the Global Soil Mapping package, plotKML for visualization, and the Soil Reference Library package. The document outlines the status of current work and provides next steps like releasing initial packages and continuing development through user feedback. It encourages participation in the GSIF workshop to help develop the software functionality.
These slides were presented at the first osgeo.wageningen event by several participants in a 5 minute pitch on current work using opensource geospatial software
La presentazione del Progetto SmartGeo a cura di Guido Satta, in occasione dell'evento "Bonifiche ambientali e potenzialità delle imprese" che si è tenuto a Cagliari il 7 novembre 2014.
Slides used in an EDINA webinar on Geology Digimap, on 27th February 2013. Covers the British Geological Survey map data and services that are available in Geology Digimap, a subscription service for UK further education and higher education.
Slides used in a Digimap webinar in February 2013. Covers available map data in the Digimap Collections (subscription services for UK further and higher edcation) and its use in ArcGIS. Information on data formats, data conversion tools and data styling.
Investigation of the Lake Victoria Region (Africa: Tanzania, Kenya and Uganda)Universität Salzburg
This poster is a student assignment for a course 'GISA 02 GIS: Geographical Information Systems - Advanced Course 0701', a part of the MSc studies. It presents an ArcGIS based spatial analysis of the Victoria Lake region including environmental, biological, social and economic characteristics of the region. The methodology includes data organizing and management in ArcGIS 9.3. Operations and technique: ArcGIS Spatial Analyst. Project architecture: ArcCatalog. Spatial referencing and re-projection: ArcToolbox. Data include DEMs: elevations (USGS). 2 tiles of the USGS DEM, Land cover data (raster), Population data: UNEP, ArcGIS vector.shp files of administrative boundaries fof Uganda, Tanzania, Kenya. Data preprocessing include following data preparation. Initial vector data: UNEP .shp. Spatial reference properties: Africa Albers Equal Area Conic projection, standard parallels 20 and -23, central meridian 25 and Datum WGS-84, Projection GEOGRAPHIC, Spheroid CLARKE1866. Data conversion from ASCII text data format to raster using ArcToolbox / Conversion Tools / ASCII to Raster (Climate precipitation data). Data were projected, processed and several layer formatting and overlays were created. Mapping was created using ArcMap. Victoria Lake has unique environment, important role in the economy of countries supporting 25 M people through fish catchment reaching up to 90-270$ per capita per annum. Kenya, Tanzania and Uganda control 6%, 49% and 45% of the lake surface. Lake catchment provides livelihood of 1/3 of the population of 3 countries with agricultural economy supported by fishing and agriculture (tea and coffee plantations).
Accurate and rapid big spatial data processing by scripting cartographic algo...Universität Salzburg
Accurate and rapid big spatial data processing by scripting cartographic algorithms: advanced seafloor mapping of the deep-sea trenches along the margins of the Pacific Ocean
Bringing Geospatial Analysis to the Social Studies: an Assessment of the City...Universität Salzburg
Current poster presents an example of Landsat TM image processing using ENVI GIS. Research area: Taipei, Taiwan. Located on the north of the island, Taipei is Taiwan’s core urban, political and economic center; population >2.6 M continuing to expand affecting urban landscapes. Research aim: spatio- temporal analysis of urban dynamics in study area during 15 years (1990- 2005) Research objective: application of GIS methodology and remote sens- ing data to spatial analysis for a case study of Taipei. Data: Landsat TM images taken from the USGS. Software: ENVI GIS. Workflow includes following steps: 1) Preliminary processing 2) Creation color composites 3) Classification using K-means algorithm 4) Mapping using classification results 5) Accuracy assessment. The preliminary data processing includes image contrast stretching, which is useful as by default, ENVI displays images with a 2\% linear contrast stretch. For better contrast the histogram equalization contrast stretch was applied to the image in order to enhance the visual quality. The analysis of landscape changes was performed by geospatial analysis. 2 satellite images Landsat TM were processed and classified using ENVI GIS. Result of classification: areas occupied by different land cover types were calculated and analyzed. It has been detected that different parts of the city of Taipei were developing with different rate and intensity. 3 different residential types of the city were recognized and mapped. The results demonstrated following outcomes: 1) intensive urban development of the city of Taipei; 2) decline of green areas and natural spaces and, on the contrary, increase in anthropogenic urban spaces; 3) not parallel urban development in different districts of the city of Taipei during the 15-year period of 1990-2005.
Java Tech & Tools | Mapping, GIS and Geolocating Data in Java | Joachim Van d...JAX London
2011-11-02 | 03:45 PM - 04:35 PM
Introduction to mapping, geographic information systems and geolocalization. After covering basics like layers and projections, data formats and standards we will look at open source tools and Java libraries which can help you to build working solutions.
The User-participated Geospatial Web as Open PlatformChanny Yun
It's presentation of speaking in GIS International Seminar in Korea. You can refer to my full document in http://channy.creation.net/blog/data/channy/gis-seminar-2007.pdf
Francesca Gottschalk - How can education support child empowerment.pptxEduSkills OECD
Francesca Gottschalk from the OECD’s Centre for Educational Research and Innovation presents at the Ask an Expert Webinar: How can education support child empowerment?
Model Attribute Check Company Auto PropertyCeline George
In Odoo, the multi-company feature allows you to manage multiple companies within a single Odoo database instance. Each company can have its own configurations while still sharing common resources such as products, customers, and suppliers.
How to Make a Field invisible in Odoo 17Celine George
It is possible to hide or invisible some fields in odoo. Commonly using “invisible” attribute in the field definition to invisible the fields. This slide will show how to make a field invisible in odoo 17.
The Roman Empire A Historical Colossus.pdfkaushalkr1407
The Roman Empire, a vast and enduring power, stands as one of history's most remarkable civilizations, leaving an indelible imprint on the world. It emerged from the Roman Republic, transitioning into an imperial powerhouse under the leadership of Augustus Caesar in 27 BCE. This transformation marked the beginning of an era defined by unprecedented territorial expansion, architectural marvels, and profound cultural influence.
The empire's roots lie in the city of Rome, founded, according to legend, by Romulus in 753 BCE. Over centuries, Rome evolved from a small settlement to a formidable republic, characterized by a complex political system with elected officials and checks on power. However, internal strife, class conflicts, and military ambitions paved the way for the end of the Republic. Julius Caesar’s dictatorship and subsequent assassination in 44 BCE created a power vacuum, leading to a civil war. Octavian, later Augustus, emerged victorious, heralding the Roman Empire’s birth.
Under Augustus, the empire experienced the Pax Romana, a 200-year period of relative peace and stability. Augustus reformed the military, established efficient administrative systems, and initiated grand construction projects. The empire's borders expanded, encompassing territories from Britain to Egypt and from Spain to the Euphrates. Roman legions, renowned for their discipline and engineering prowess, secured and maintained these vast territories, building roads, fortifications, and cities that facilitated control and integration.
The Roman Empire’s society was hierarchical, with a rigid class system. At the top were the patricians, wealthy elites who held significant political power. Below them were the plebeians, free citizens with limited political influence, and the vast numbers of slaves who formed the backbone of the economy. The family unit was central, governed by the paterfamilias, the male head who held absolute authority.
Culturally, the Romans were eclectic, absorbing and adapting elements from the civilizations they encountered, particularly the Greeks. Roman art, literature, and philosophy reflected this synthesis, creating a rich cultural tapestry. Latin, the Roman language, became the lingua franca of the Western world, influencing numerous modern languages.
Roman architecture and engineering achievements were monumental. They perfected the arch, vault, and dome, constructing enduring structures like the Colosseum, Pantheon, and aqueducts. These engineering marvels not only showcased Roman ingenuity but also served practical purposes, from public entertainment to water supply.
Palestine last event orientationfvgnh .pptxRaedMohamed3
An EFL lesson about the current events in Palestine. It is intended to be for intermediate students who wish to increase their listening skills through a short lesson in power point.
Synthetic Fiber Construction in lab .pptxPavel ( NSTU)
Synthetic fiber production is a fascinating and complex field that blends chemistry, engineering, and environmental science. By understanding these aspects, students can gain a comprehensive view of synthetic fiber production, its impact on society and the environment, and the potential for future innovations. Synthetic fibers play a crucial role in modern society, impacting various aspects of daily life, industry, and the environment. ynthetic fibers are integral to modern life, offering a range of benefits from cost-effectiveness and versatility to innovative applications and performance characteristics. While they pose environmental challenges, ongoing research and development aim to create more sustainable and eco-friendly alternatives. Understanding the importance of synthetic fibers helps in appreciating their role in the economy, industry, and daily life, while also emphasizing the need for sustainable practices and innovation.
Acetabularia Information For Class 9 .docxvaibhavrinwa19
Acetabularia acetabulum is a single-celled green alga that in its vegetative state is morphologically differentiated into a basal rhizoid and an axially elongated stalk, which bears whorls of branching hairs. The single diploid nucleus resides in the rhizoid.
Honest Reviews of Tim Han LMA Course Program.pptxtimhan337
Personal development courses are widely available today, with each one promising life-changing outcomes. Tim Han’s Life Mastery Achievers (LMA) Course has drawn a lot of interest. In addition to offering my frank assessment of Success Insider’s LMA Course, this piece examines the course’s effects via a variety of Tim Han LMA course reviews and Success Insider comments.
The French Revolution, which began in 1789, was a period of radical social and political upheaval in France. It marked the decline of absolute monarchies, the rise of secular and democratic republics, and the eventual rise of Napoleon Bonaparte. This revolutionary period is crucial in understanding the transition from feudalism to modernity in Europe.
For more information, visit-www.vavaclasses.com
Overview on Edible Vaccine: Pros & Cons with Mechanism
GSIF utilities
1. Global Soil Information Facilities
Software developments
Tomislav Hengl
ISRIC World Soil Information, Wageningen University
GSM2011.org, June 2024th 2011
2. Acknowledgement
1. Hannes Reuter GIS and WPS functionality.
2. Pierre Roudier Dylan Beaudette plotKML package.
3. Brendon Malone David Jacquier spline tting
function.
4. Keith Shepherd Bob MacMillan Soil Reference
Library.
GSM2011.org, June 2024th 2011
3. GSIF components
1. Cyber infrastructure for input, analysis and visualization of
data.
2. Global databases (legacy data, gridded covariates) that are
main inputs to global soil mapping.
3. Software tools (modules and packages) and manuals for
creation of geoinformation, for instance, according to
the GlobalSoilMap.net specications.
4. Standards and protocols for data entry, map generation and
data sharing.
GSM2011.org, June 2024th 2011
5. Overview
Open Soil Profiles Soil covariates (worldgrids)
Global Continental scale Country/state-level
Soil variables
Soil site info
Soil analytical data
Descriptive properties 5.6 km repository 1 km repository 250 m repository
R packages
Map import module
Data entry module
Harmonization module
Spline fitting
Spatial analysis module
(Servers) cyber infrastructure Data visualization
Data export
Soil property maps Webmapping API
Six+four key soil parameters
Global coverage (organic carbon, pH, clay, silt,
sand, coarse fragments)
Real-time spatial prediction
at six standard depths (0-5, 5-
(Google Maps)
15, 15-30, 30-60, 60-100, 100-
GlobalSoilMap.net functionality
200 cm)
for web-applications
and with included upper and
Geo-serving and geoprocessing
lower 95% probability ranges
functionality
100 m (250 m, 1 km and 5.6 km)
GSM2011.org, June 2024th 2011
6. GSIF modules
New soil profile
New covariates
data
MAP IMPORT MODULE DATA ENTRY MODULE
Upload of gridded maps to the soilprofiles.org: live data
soilgrids.org repository; entry forms for point data; HARMONISATION MODULE
Meta-data generation tool; Geo-registry module; Translation of laboratory
Automated map matching and Automated data screening and methods (correlation)
validation (mask maps); detection of gross errors and Upscaling / downscaling
Automated conversion and artifacts; functionality
harmonization of soil polygon Data translation (re-
maps; formatting) functionality
SPATIAL ANALYSIS MODULE
Overlay (covariates) and
regression analysis;
Multiscale prediction - trend
models;
Variogram analysis (automap);
Prediction and simulations;
Cross-validation;
Predict secondary soil
Open Soil Profiles
Soil Gridded Covariates (soilprofiles.org)
parameters (PTF)
(soilgrids.org)
DATA EXPORT MODULE SUPPORT MODULE
Subsetting and export to GIS Help and F.A.Q.
data formats (geotiff and ESRI Variable descriptions
Shape file), KML and table (meta-data)
formats (DBF); Search functionality
API services to serve the data (manuals and user
without accessing URL (e.g. forums, demos and
via mobile-phone); multimedia)
Data serving
Soil property maps
(globalsoilmap.net)
GSM2011.org, June 2024th 2011
7. Proposed implementation
1. Produce a suite of utilities to import, re-format, analyze
and visualize spatial soil data
GSM2011.org, June 2024th 2011
8. Proposed implementation
1. Produce a suite of utilities to import, re-format, analyze
and visualize spatial soil data
2. Design them so they t the needs of operational global
soil mapping
GSM2011.org, June 2024th 2011
9. Proposed implementation
1. Produce a suite of utilities to import, re-format, analyze
and visualize spatial soil data
2. Design them so they t the needs of operational global
soil mapping
3. Focus on using R+OSGeo
GSM2011.org, June 2024th 2011
10. Proposed implementation
1. Produce a suite of utilities to import, re-format, analyze
and visualize spatial soil data
2. Design them so they t the needs of operational global
soil mapping
3. Focus on using R+OSGeo
4. Get the whole DSM community involved (in design, in
development, in use)
GSM2011.org, June 2024th 2011
11. Proposed implementation
1. Produce a suite of utilities to import, re-format, analyze
and visualize spatial soil data
2. Design them so they t the needs of operational global
soil mapping
3. Focus on using R+OSGeo
4. Get the whole DSM community involved (in design, in
development, in use)
5. Provide training in development and use to countries and
nodes
GSM2011.org, June 2024th 2011
12. List of utilities
1. Global soil mapping (core) package GSIF
GSM2011.org, June 2024th 2011
13. List of utilities
1. Global soil mapping (core) package GSIF
2. Soil visualization package plotKML
GSM2011.org, June 2024th 2011
14. List of utilities
1. Global soil mapping (core) package GSIF
2. Soil visualization package plotKML
3. Soil Reference Library SRL
GSM2011.org, June 2024th 2011
15. List of utilities
1. Global soil mapping (core) package GSIF
2. Soil visualization package plotKML
3. Soil Reference Library SRL
4. Geo-services (PythonWPS, Geoserver, RServe, GDAL utilities)
GSM2011.org, June 2024th 2011
16. Functionality (GSIF)
Estimate the spatial domain and the tiling system;
Fit splines to soil horizon records and convert from block to
point support in vertical dimension;
Query and download point and gridded data from the data
portals;
Convert harmonized soil prole data from relational structure
to single table records;
Automatically lter suspicious records and detect outliers in
the soil prole records;
Generate one set of globally consistent predictions using point
observations (OSP) and gridded predictors (worldgrids);
Convert gridded predictions to formats required for submission
to GSIF;
Generate metadata and data analysis reports using XML
formats;
GSM2011.org, June 2024th 2011
17. Status (GSIF)
Progress so far:
Derive cell ID for any location in the world and estimate
number of 1degree blocks required to map an area (based on
a land mask);
Fit equal-area splines to soil prole data (the method of
Bishop et al. (1999));
Get values at point locations from worldgrids.org (covariates);
Convert site-horizon DB to single-table structure;
GSM2011.org, June 2024th 2011
18. Functionality (plotKML)
Visualize soil proles measurements (using the original soil
colors);
Visualize soil prole photographs;
Plot results of prediction (soil property maps) using standard
color schemes;
Default distribution model for the GlobalSoilMap.net property
maps (?);
Visualize uncertainty of the maps;
GSM2011.org, June 2024th 2011
29. SRL package
Harmonization of soil prole data;
Estimation of secondary soil properties using pedo-transfer
functions;
Estimation of soil properties using soil spectroscopy;
GSM2011.org, June 2024th 2011
30. Overview
SOIL REFERENCE
Soil Spectral
LIBRARY Library
Dependent R libraries Soil Reference Data
(soil referent profiles with complete Obtain additional
laboratory methods, soil description field data
soil.spec
aqp and scanned soil spectra)
soiltexture
NO
HydroMe
Conversion functions Fits
(various R packages for generalized Fit conversion requir-
linear modeling, fuzzy matching, model parameters ed accur-
regression trees etc.) acy?
YES
Design the Conversion coefficients
conversion model (most accurate models to estimate
NO standard parameters; extendible)
Convers- Estimate values of
Unharmonized Standardized value +
ion model YES the standardized
record (new data) Associated uncertainty
available? variable
GSM2011.org, June 2024th 2011
31. Status
It is not dicult to build a package, but to get soil reference
data
We would need (at least) 300500 points:
Points have to be representative (hypercube sampling, the
whole world)
Each point should be sampled using standard protocol (soil
eld description, soil lab analysis, soil spectroscopy)
Project designers need to decide if existing samples can be
used as well as new ones
We probably need new point samples
GSM2011.org, June 2024th 2011
32. ISRIC monoliths
Figure: ISRIC referent samples (monoliths) and occurrence probability.
Derived using the MaxEnt package (climatic images, HWSD and
vegetation maps).
GSM2011.org, June 2024th 2011
33. Main principles of programming
1. Hide complexity from the users (scale, eective precision, 3D
geostat)
2. Deliver data and results so that no software training is required
to open it (KML)
3. Link to R+OSGeo community (do not invent functionality that
already exists and is operational)
GSM2011.org, June 2024th 2011
34. Why R?
1. It is a trustworthy software because it is open source
GSM2011.org, June 2024th 2011
35. Why R?
1. It is a trustworthy software because it is open source
2. It is accessible to anyone via most of Operating Systems
GSM2011.org, June 2024th 2011
36. Why R?
1. It is a trustworthy software because it is open source
2. It is accessible to anyone via most of Operating Systems
3. People in developing countries can start picking things
up today!
GSM2011.org, June 2024th 2011
37. Why R?
1. It is a trustworthy software because it is open source
2. It is accessible to anyone via most of Operating Systems
3. People in developing countries can start picking things
up today!
4. It is the fastest growing open source environments for
statistical computing
GSM2011.org, June 2024th 2011
38. Why R?
1. It is a trustworthy software because it is open source
2. It is accessible to anyone via most of Operating Systems
3. People in developing countries can start picking things
up today!
4. It is the fastest growing open source environments for
statistical computing
5. It can handle space-time data
GSM2011.org, June 2024th 2011
39. Why R?
1. It is a trustworthy software because it is open source
2. It is accessible to anyone via most of Operating Systems
3. People in developing countries can start picking things
up today!
4. It is the fastest growing open source environments for
statistical computing
5. It can handle space-time data
6. It is professional (made by top-minds in the business)
GSM2011.org, June 2024th 2011
40. Next steps
Release plotKML and GSIF packages v0.1
Continue developing the functionality via R-forge
Use users feedback to improve
Optimize the processing speed and improve usability on various
platforms
Incorporate this functionality within WPS
GSM2011.org, June 2024th 2011
41. Would you like to join GSIF?
Join the GSIF workshop on Friday
GSM2011.org, June 2024th 2011
42. Would you like to join GSIF?
Join the GSIF workshop on Friday
There are some expectations:
GSM2011.org, June 2024th 2011
43. Would you like to join GSIF?
Join the GSIF workshop on Friday
There are some expectations:
1. You take a responsibility to deliver the functionality on time
GSM2011.org, June 2024th 2011
44. Would you like to join GSIF?
Join the GSIF workshop on Friday
There are some expectations:
1. You take a responsibility to deliver the functionality on time
2. You share most of the Edzer Pebesma's Open data principles
GSM2011.org, June 2024th 2011
45. Would you like to join GSIF?
Join the GSIF workshop on Friday
There are some expectations:
1. You take a responsibility to deliver the functionality on time
2. You share most of the Edzer Pebesma's Open data principles
A
3. You should be familiar with R / LTEX
GSM2011.org, June 2024th 2011