Worksheet and workbooks linking
•
0 likes•99 views

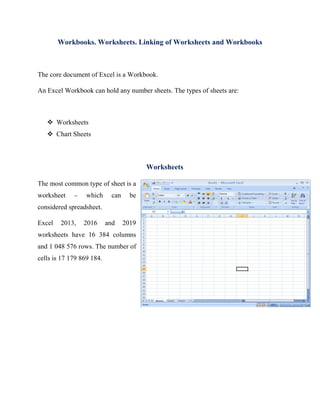
The core document of Excel is a Workbook. Everything that you do in Excel takes place in a Workbook...
Report
Share
Report
Share
Download to read offline

Recommended
Powerpoint school
This document provides an introduction to Microsoft Excel spreadsheets. It discusses the basics of workbooks, worksheets, cells, columns, rows and cell references. It also summarizes functions for importing/exporting data, formatting cells, copying formulas, using auto-fill, creating charts, sorting data, templates, copying cells, relative addressing, and saving/printing worksheets.
Chapter 4
This document provides an introduction to Microsoft Excel 2007. It explains that Excel is a spreadsheet program that allows users to enter data, perform calculations using formulas and functions, and create charts. Key aspects of the Excel interface are described, including the ribbon interface with tabs like Home, Insert, and Page Layout. Functions like summing values in cells are demonstrated as examples of calculations. Advantages of Excel like ease of data entry, recalculation of formulas, and presentation of data in charts are highlighted.
The 10 Ways Data Preparation Can Enhance Excel
Learn how a data preparation tool can enhance your excel experience and cut down on manual data preparation.
INTRODUCTION TO MS EXCEL 2010
This document provides an introduction to Microsoft Excel 2010. It discusses starting Excel and opening a blank spreadsheet. It defines key Excel concepts like worksheets, which are single pages within a workbook file. The document explains that a workbook can contain multiple worksheets and is the Excel file itself. It includes instructions for students to complete practice exercises in the textbook to reinforce their learning.
Spreadsheets Concepts and Vocab
This document introduces key concepts and vocabulary related to spreadsheets. It defines a spreadsheet as a computer program that arranges data into columns and rows for calculations. A workbook contains one or more worksheets, each made up of cells located at the intersection of rows and columns. Cells can contain values, labels, or formulas beginning with an equal sign. Functions are preset formulas that perform calculations using arguments within parentheses. Other concepts covered include the formula bar, data types, autosum, charts, formatting cells, and sorting data.
Export outlook contacts distribution list to excel
The document provides instructions for exporting Outlook contacts and distribution lists to Excel, editing the file, and then importing it back into Outlook. It describes exporting a contacts list from Outlook to a text file, editing the file in Notepad to contain only firstname, lastname, and email, and then importing this file into Excel. It further details defining a name field in Excel, and then importing the Excel data back into Outlook contacts by mapping fields. The overall process allows transferring contacts between Outlook and Excel.
Starting With Microsoft Excel
Excel is spreadsheet software that allows users to create tables to store, organize, and analyze data arranged in rows and columns. It performs automatic calculations on numerical values and creates graphs and charts. Excel is part of the Microsoft Office suite of productivity software and uses a grid of cells referenced by column letters and row numbers to enter text, numbers, and formulas. Users can designate a range of cells as a table to easily add and manage rows of related data. Charts in Excel include pie charts for percentages, column charts for comparisons, bar charts for horizontal comparisons, and line charts for trends over time.
Using microsoft excel
A spreadsheet is a computer program that simulates a paper ledger sheet for organizing and analyzing data through rows and columns of cells. It allows for manual or electronic tracking of information like grades, inventories, and data analysis. The electronic spreadsheet features an active cell indicator to identify the active cell's address, making basic tasks easier than with manual ledgers through features like rows numbered sequentially, columns identified by letters, and cells located at each intersection.
What is a spreadsheet
This document provides an introduction to creating and using spreadsheets in the classroom. It defines what a spreadsheet is, including rows, columns, cells and formulas. It discusses Microsoft Excel as the dominant spreadsheet application and includes a sample classroom spreadsheet analyzing student data. It also lists resources and example classroom projects using spreadsheets and outlines next steps to download sample spreadsheets and complete a U.S. Census assignment.
Uses of MSExcel
MS Excel
Excel is an Electronic Spreadsheet Program.
An electronic spreadsheet is a computer software program that is used for storing, organizing and manipulating data.
The basic layout of computerized spreadsheets is the same as the paper ones.
slide 1:Uses In education Graphic presentation :
Using Excel can enhance understanding of content within a graphic presentation of the information; it provides a visual representation of data that makes it easier to analyze.
slide 2:As a teaching tool, students can see how different types of graphs and charts can be used to represent the same series of data.
slide 3:Excel is specialized software that lets you create:Entering tabular data
Calculate large data
Analyzing Student performance
Interpret data
Maintaining student records
Computing grades
Sorting a list
slide 4:Calculated…
slide 5: grade assess final result
slide 6:some other use..Compare values
view, copy, zoom, and print
Understanding relationship between things
slide 7:Share information on web:
Excel can easily convert any chart or data set into a web page, making it very easy to share information among groups.
Many universities are using this model for data sharing between students who aren't even on the same continent.
slide 8:Business Uses of Excel
slide 9:Excel as Analytical Tool
Excel as Corporate Budgeting
Excel as Inventory Management
Excel as Create forms and consolidating results
Excel as Finding Profit Breakeven
Excel as Manage name list or data records
Management Dashboards
Formulas in ms excel for statistics(report2 in ict math ed)
Microsoft Excel allows users to enter numerical and financial data into spreadsheets and perform statistical analysis on that data. It contains many built-in statistical formulas that can be easily applied by selecting the formula type, choosing the specific formula, and configuring it with cell references to the data. However, Excel does not support some more advanced statistical methods like multiple comparison tests, nonparametric tests, or principal components analysis. The Analysis ToolPak add-in expands Excel's statistical analysis capabilities.
Database Relationships
The document discusses database relationships and how they allow data from different tables to be linked and retrieved collectively. It provides examples of how tables in a music store database could be related, including an Inventory table linked to a Royalty table and a Sales table. The keys to relationships are primary keys that create unique links between tables and foreign keys that are primary keys from one table used in another. Relationships can be one-to-one, one-to-many, or many-to-many, and junction tables are used for many-to-many relationships.
What is SPSS?
What is SPSS (Theory)?
Data Editor
Variable definition
Briefing for SPSS
How to subscribe SPSS?
Recommended books on SPSS
Uses for SPSS (Data Management)
Uses for SPSS (Data Analysis)
Sql joins
This document discusses different types of SQL joins: inner join, outer join, and cross join. It explains that inner joins return only matching records from both tables, while outer joins return all records from one table and matching records from the other table. The three types of outer joins are left, right, and full outer joins. Cross joins return all possible combinations of records between the two tables. Syntax examples and sample queries are provided to illustrate each type of join.
SPSS vs Stata: The Best Ever Comparison
Here is the best ever comparison between SPSS vs Stata. Have a look on our latest PDF to differentiate between SPSS and Stata.
Introduction to excel - application to statistics
Slides for the Introduction to Excel - Application to Statistics workshop for UNSW Business Society Core Skills Workshops series Semester 1, 2011
SPSS
Here are the steps to merge the data files:
1. Open the file Student_1 containing information on the first 5 students.
2. Go to Data > Merge Files > Add Cases.
3. Select the file Student_2 containing information on the additional 3 students.
4. The cases from Student_1 will be merged with the cases from Student_2.
5. Save the merged file as Student.
6. Open the file Student.
7. Go to Data > Merge Files > Add Variables.
8. Select the file Student_3 containing the Marks variable.
9. The variables from Student_3 will be added to the cases in Student.
CCPRO 2016 Power Presentation
This document provides an overview of Power Query and Power Pivot. It discusses how Power Query allows users to import data from various sources using a point-and-click interface and transform the data. Power Pivot then allows users to create data models and relationships between tables for analysis using powerful DAX formulas in Excel pivot tables.
Ms access tutorial
This document provides an overview of building a database in Microsoft Access 2007. It discusses planning the database structure, deciding on a purpose, listing the data to store, and the main parts of database design like fields, tables, primary keys, and data types. It also covers creating relationships between tables, using queries to extract data, and includes self-assessment quizzes to test the reader's understanding.
Lect 10 Zaheer Abbas
A linked list is a linear data structure where each element is linked to the next element via a pointer. Each element, called a node, contains data and a pointer to the next node. The first node is referenced by a pointer called the head. Linked lists allow for efficient insertion and removal of nodes throughout the list since nodes are not confined to adjacent memory locations. Linked lists can grow and shrink dynamically as nodes are added or removed.
In press checking with crossref API
Instructions from University of Leeds on their in press checking process using the crossref API. From UKCORR members' day 2018.
Handouts how to use microsoft access to conduct an overlap analysis
Part of poster presentation "Creating eJournal Management Reports using Microsoft Access" at the 2013 Charleston Conference.
Standard Algorithms
Linked lists are data structures that store items sequentially by linking each item to the next. They have flexible ordering and dynamic sizes but searching requires traversing the entire list. Items can be efficiently inserted, added to either end, or deleted by adjusting pointer links between items.
Linked Lists
Linked lists are data structures that store items sequentially by linking each item to the next. Unlike arrays, linked lists do not have a fixed size and can expand or reduce dynamically. They are more memory efficient than arrays but items cannot be accessed directly by index and must be traversed sequentially. Items can be inserted or deleted by changing the pointer links between items, and added to the beginning, end, or between other items in the list.
TLE
1. A primary key uniquely identifies each record in a table and cannot contain duplicate values. It can be a single field or combination of fields.
2. A foreign key is a field in one table that matches the primary key of another table, linking the two tables. Unlike primary keys, tables can have multiple foreign keys and foreign key values are not required to be unique.
3. Primary keys and foreign keys are used to define relationships between tables, with the primary key from one table acting as a foreign key in another table to link related data.
Using financial functions in ms excel
This document discusses financial functions in Microsoft Excel. It begins with a basic introduction to Excel, describing how it simulates a worksheet with cells that can contain formulas calculating values from other cells. It then explains that financial functions are useful for professionals to automate calculations and get accurate solutions. Some common financial functions in Excel are listed, including SUM, FUTURE VALUE OF ANNUITY, PRESENT VALUE OF ANNUITY, and NET PRESENT VALUE. Formulas for each of these functions are also provided.
SAP ABAP data dictionary
1) The data dictionary is a virtual database that contains metadata (data about data) such as the definition of tables, fields, domains and other database objects. It provides information for data manipulation and processing.
2) Key data dictionary objects include domains, which define field attributes like type and length; data elements, which define field semantics; and tables, which store records of data. Transparent tables can be created to store custom tables.
3) System fields store system-related data like date and time, while structures store temporary data during runtime and views combine data from multiple tables.
SPSS vs Stata: All You need to Know
This document compares the statistical software packages SPSS and Stata. It outlines their key features, uses, and functions. SPSS allows data summarization and visualization while Stata offers advanced modeling techniques like latent class analysis. Both can perform a wide range of statistical analyses and create publication-quality reports, but Stata's added packages provide more specialized modeling options.
ITB - UNIT 4.pdf
This document provides an introduction and overview of spreadsheets and Microsoft Excel. It defines what a spreadsheet is, outlines key features and elements of Excel including cells, worksheets, formatting, formulas, functions, charts and pivot tables. It also describes various data analysis tools in Excel like sorting, filtering, conditional formatting, and how to perform tasks like what-if analysis using goal seek and scenario manager. The document is intended as a reference for using spreadsheets, especially Microsoft Excel, in a business context.
Microsoft Excel Training
This document provides an overview of Microsoft Excel. It discusses that Excel is a spreadsheet application used to organize data into tables and perform calculations. Key points covered include:
- Excel uses a grid of rows and columns to display data in worksheets.
- Common tasks in Excel include entering data, formatting cells, adjusting worksheet layout, printing, using formulas and functions, and creating charts and pivot tables.
- Advanced features include conditional formatting, comments, grouping worksheets, and sharing workbooks with other users.
More Related Content
What's hot
What is a spreadsheet
This document provides an introduction to creating and using spreadsheets in the classroom. It defines what a spreadsheet is, including rows, columns, cells and formulas. It discusses Microsoft Excel as the dominant spreadsheet application and includes a sample classroom spreadsheet analyzing student data. It also lists resources and example classroom projects using spreadsheets and outlines next steps to download sample spreadsheets and complete a U.S. Census assignment.
Uses of MSExcel
MS Excel
Excel is an Electronic Spreadsheet Program.
An electronic spreadsheet is a computer software program that is used for storing, organizing and manipulating data.
The basic layout of computerized spreadsheets is the same as the paper ones.
slide 1:Uses In education Graphic presentation :
Using Excel can enhance understanding of content within a graphic presentation of the information; it provides a visual representation of data that makes it easier to analyze.
slide 2:As a teaching tool, students can see how different types of graphs and charts can be used to represent the same series of data.
slide 3:Excel is specialized software that lets you create:Entering tabular data
Calculate large data
Analyzing Student performance
Interpret data
Maintaining student records
Computing grades
Sorting a list
slide 4:Calculated…
slide 5: grade assess final result
slide 6:some other use..Compare values
view, copy, zoom, and print
Understanding relationship between things
slide 7:Share information on web:
Excel can easily convert any chart or data set into a web page, making it very easy to share information among groups.
Many universities are using this model for data sharing between students who aren't even on the same continent.
slide 8:Business Uses of Excel
slide 9:Excel as Analytical Tool
Excel as Corporate Budgeting
Excel as Inventory Management
Excel as Create forms and consolidating results
Excel as Finding Profit Breakeven
Excel as Manage name list or data records
Management Dashboards
Formulas in ms excel for statistics(report2 in ict math ed)
Microsoft Excel allows users to enter numerical and financial data into spreadsheets and perform statistical analysis on that data. It contains many built-in statistical formulas that can be easily applied by selecting the formula type, choosing the specific formula, and configuring it with cell references to the data. However, Excel does not support some more advanced statistical methods like multiple comparison tests, nonparametric tests, or principal components analysis. The Analysis ToolPak add-in expands Excel's statistical analysis capabilities.
Database Relationships
The document discusses database relationships and how they allow data from different tables to be linked and retrieved collectively. It provides examples of how tables in a music store database could be related, including an Inventory table linked to a Royalty table and a Sales table. The keys to relationships are primary keys that create unique links between tables and foreign keys that are primary keys from one table used in another. Relationships can be one-to-one, one-to-many, or many-to-many, and junction tables are used for many-to-many relationships.
What is SPSS?
What is SPSS (Theory)?
Data Editor
Variable definition
Briefing for SPSS
How to subscribe SPSS?
Recommended books on SPSS
Uses for SPSS (Data Management)
Uses for SPSS (Data Analysis)
Sql joins
This document discusses different types of SQL joins: inner join, outer join, and cross join. It explains that inner joins return only matching records from both tables, while outer joins return all records from one table and matching records from the other table. The three types of outer joins are left, right, and full outer joins. Cross joins return all possible combinations of records between the two tables. Syntax examples and sample queries are provided to illustrate each type of join.
SPSS vs Stata: The Best Ever Comparison
Here is the best ever comparison between SPSS vs Stata. Have a look on our latest PDF to differentiate between SPSS and Stata.
Introduction to excel - application to statistics
Slides for the Introduction to Excel - Application to Statistics workshop for UNSW Business Society Core Skills Workshops series Semester 1, 2011
SPSS
Here are the steps to merge the data files:
1. Open the file Student_1 containing information on the first 5 students.
2. Go to Data > Merge Files > Add Cases.
3. Select the file Student_2 containing information on the additional 3 students.
4. The cases from Student_1 will be merged with the cases from Student_2.
5. Save the merged file as Student.
6. Open the file Student.
7. Go to Data > Merge Files > Add Variables.
8. Select the file Student_3 containing the Marks variable.
9. The variables from Student_3 will be added to the cases in Student.
CCPRO 2016 Power Presentation
This document provides an overview of Power Query and Power Pivot. It discusses how Power Query allows users to import data from various sources using a point-and-click interface and transform the data. Power Pivot then allows users to create data models and relationships between tables for analysis using powerful DAX formulas in Excel pivot tables.
Ms access tutorial
This document provides an overview of building a database in Microsoft Access 2007. It discusses planning the database structure, deciding on a purpose, listing the data to store, and the main parts of database design like fields, tables, primary keys, and data types. It also covers creating relationships between tables, using queries to extract data, and includes self-assessment quizzes to test the reader's understanding.
Lect 10 Zaheer Abbas
A linked list is a linear data structure where each element is linked to the next element via a pointer. Each element, called a node, contains data and a pointer to the next node. The first node is referenced by a pointer called the head. Linked lists allow for efficient insertion and removal of nodes throughout the list since nodes are not confined to adjacent memory locations. Linked lists can grow and shrink dynamically as nodes are added or removed.
In press checking with crossref API
Instructions from University of Leeds on their in press checking process using the crossref API. From UKCORR members' day 2018.
Handouts how to use microsoft access to conduct an overlap analysis
Part of poster presentation "Creating eJournal Management Reports using Microsoft Access" at the 2013 Charleston Conference.
Standard Algorithms
Linked lists are data structures that store items sequentially by linking each item to the next. They have flexible ordering and dynamic sizes but searching requires traversing the entire list. Items can be efficiently inserted, added to either end, or deleted by adjusting pointer links between items.
Linked Lists
Linked lists are data structures that store items sequentially by linking each item to the next. Unlike arrays, linked lists do not have a fixed size and can expand or reduce dynamically. They are more memory efficient than arrays but items cannot be accessed directly by index and must be traversed sequentially. Items can be inserted or deleted by changing the pointer links between items, and added to the beginning, end, or between other items in the list.
TLE
1. A primary key uniquely identifies each record in a table and cannot contain duplicate values. It can be a single field or combination of fields.
2. A foreign key is a field in one table that matches the primary key of another table, linking the two tables. Unlike primary keys, tables can have multiple foreign keys and foreign key values are not required to be unique.
3. Primary keys and foreign keys are used to define relationships between tables, with the primary key from one table acting as a foreign key in another table to link related data.
Using financial functions in ms excel
This document discusses financial functions in Microsoft Excel. It begins with a basic introduction to Excel, describing how it simulates a worksheet with cells that can contain formulas calculating values from other cells. It then explains that financial functions are useful for professionals to automate calculations and get accurate solutions. Some common financial functions in Excel are listed, including SUM, FUTURE VALUE OF ANNUITY, PRESENT VALUE OF ANNUITY, and NET PRESENT VALUE. Formulas for each of these functions are also provided.
SAP ABAP data dictionary
1) The data dictionary is a virtual database that contains metadata (data about data) such as the definition of tables, fields, domains and other database objects. It provides information for data manipulation and processing.
2) Key data dictionary objects include domains, which define field attributes like type and length; data elements, which define field semantics; and tables, which store records of data. Transparent tables can be created to store custom tables.
3) System fields store system-related data like date and time, while structures store temporary data during runtime and views combine data from multiple tables.
SPSS vs Stata: All You need to Know
This document compares the statistical software packages SPSS and Stata. It outlines their key features, uses, and functions. SPSS allows data summarization and visualization while Stata offers advanced modeling techniques like latent class analysis. Both can perform a wide range of statistical analyses and create publication-quality reports, but Stata's added packages provide more specialized modeling options.
What's hot (20)
Formulas in ms excel for statistics(report2 in ict math ed)
Formulas in ms excel for statistics(report2 in ict math ed)
Handouts how to use microsoft access to conduct an overlap analysis
Handouts how to use microsoft access to conduct an overlap analysis
Similar to Worksheet and workbooks linking
ITB - UNIT 4.pdf
This document provides an introduction and overview of spreadsheets and Microsoft Excel. It defines what a spreadsheet is, outlines key features and elements of Excel including cells, worksheets, formatting, formulas, functions, charts and pivot tables. It also describes various data analysis tools in Excel like sorting, filtering, conditional formatting, and how to perform tasks like what-if analysis using goal seek and scenario manager. The document is intended as a reference for using spreadsheets, especially Microsoft Excel, in a business context.
Microsoft Excel Training
This document provides an overview of Microsoft Excel. It discusses that Excel is a spreadsheet application used to organize data into tables and perform calculations. Key points covered include:
- Excel uses a grid of rows and columns to display data in worksheets.
- Common tasks in Excel include entering data, formatting cells, adjusting worksheet layout, printing, using formulas and functions, and creating charts and pivot tables.
- Advanced features include conditional formatting, comments, grouping worksheets, and sharing workbooks with other users.
Getting started with_microsoft_excel
This document provides an introduction to Microsoft Excel by covering the Excel interface, opening and saving worksheets, entering and editing data, building formulas and functions, and formatting and printing data. It explores the components of the Excel window including the standard toolbar, formatting toolbar, formula bar, name box, row and column headings, active cell, and fill handle. It also describes how to enter and edit data, move around the worksheet, copy and move data, and work with Excel documents by opening, saving, and creating new workbooks.
MS Office Access Tutorial
This document provides an overview of Microsoft Access and database concepts. It includes sections on getting started with Access, navigating the environment, database terms like tables, queries, forms and reports, and how to create and manage a database including adding tables, fields, records, relationships and running queries. The document aims to introduce users to key Access features and the basics of setting up and working with an Access database.
advance excell notes EMERSON EDUARDO RODRIGUES
This document provides an overview of key Excel features and functions for formatting worksheets, entering and editing data, printing worksheets, and more. It discusses topics like the Excel interface, creating and saving workbooks/worksheets, inserting and deleting rows/columns, formatting cells and worksheets, using auto-fill, and printing options for worksheets or selections. The document is intended as a basic introduction and reference for common Excel tasks.
advance excell notes EMERSON EDUARDO RODRIGUES
This document provides an overview of key Excel features and functions for formatting worksheets, entering and editing data, printing worksheets, and more. It discusses topics like the Excel interface, creating and saving workbooks/worksheets, inserting and deleting rows/columns, formatting cells and worksheets, using auto-fill, and printing options for worksheets or the entire workbook. The document is intended as a basic introduction and reference for common Excel tasks.
NCompass Live: Excel for Librarians
NCompass Live - Aug. 22, 2018
http://nlc.nebraska.gov/ncompasslive/
Microsoft Excel has a variety of uses in the library world from keeping track of budgets or managing program registrations to viewing circulation or collection statistics. Learn some hints and tips for working with already existing spreadsheets as well as building your own. We’ll also take a look at Google Sheets and see how that compares with Excel.
Presenter: Megan Boggs, Seward (NE) Memorial Library.
My tableau
As a leading data visualization tool Tableau has many desirable and unique features. Its powerful data discovery and exploration application allows you to answer important questions in seconds. You can use Tableau's drag and drop interface to visualize any data, explore different views, and even combine multiple databases together easily. It does not need any complex scripting. Anyone who understands the business problem can address it with a visualization of the relevant data. When the analysis is finished, sharing with others is as easy as publishing to Tableau Server.
MS Excel Module 2012
The document provides an overview of key features in Microsoft Excel 2007, including spreadsheets, the Microsoft Office button, ribbon, quick access toolbar, and customizing Excel. It describes how to work with workbooks and worksheets, such as creating, opening, saving workbooks, entering data, and using commands like find and replace. It also covers manipulating data through copying, pasting, sorting, filtering, and other functions. Finally, it discusses enhancing worksheets and workbooks through formatting cells, merging cells, hiding rows and columns, and managing multiple worksheets.
Exp2003 exl ppt_03
This document discusses how charts can be used to convey messages through visual representations of data. It describes different chart types like pie charts, column charts, and stacked column charts and explains how to create and modify charts using the Chart Wizard and toolbar tools in Excel. It also covers linking and embedding charts in other documents, as well as multitasking between applications using the taskbar. The key points are how to select the appropriate chart type to fit the data and convey the intended message, and how to create and modify charts to effectively communicate information visually.
ms excel for mba first sem students of dr hs gour university sagar(m.p)
This document provides an overview and introduction to Microsoft Excel. It discusses the Excel screen layout including titles bars, menus, toolbars, and worksheets. It describes how to navigate and enter data into cells. Various Excel functions are also outlined such as formulas for addition, subtraction, multiplication and division. Other topics covered include formatting worksheets, creating charts, printing, and keyboard shortcuts. The document serves as a basic guide for getting started using Excel.
Teaching Excel
The document is a tutorial for using Microsoft Excel. It provides step-by-step instructions on how to navigate the Excel interface and use basic functions. The tutorial covers topics such as navigating the Excel screen, entering formulas and data, formatting worksheets, creating charts, and using keyboard shortcuts. It also includes explanations and instructions for common Excel tasks like opening and saving files, editing data, printing worksheets, and more.
CREATING SAVING & OPENING SPREADSHEET USING WORKSHEET https://youtu.be/r8Qj5D...
This document provides an introduction to spreadsheets and Microsoft Excel. It explains that a spreadsheet is a grid of rows and columns used to enter and analyze data. It describes how to start Excel, open and save workbooks, and explores the basic parts of a workbook like worksheets, columns, rows, and cells. Examples of using spreadsheets for finances, grades, and other purposes are provided.
Ms office excel
The document provides an overview of key features in Microsoft Excel 2007, including spreadsheets, the ribbon interface, formulas, charts, and other formatting and analysis tools. It describes spreadsheet components like workbooks, worksheets, and cells. It explains the ribbon tabs and groups that contain formatting and function tools. It also provides instructions for common tasks like entering formulas, creating charts, formatting cells and text, hiding and arranging worksheets, and printing worksheets.
27 Excel Hacks to Make You a Superstar
This document shows 27 awesome Excel hacks that you can put into use instantly. These in-demand Excel tips will supercharge your Excel efficiency.
Introduction microsoft excel 2007
This document provides instructions for using basic features in Microsoft Excel, including:
- Opening and navigating the Excel interface
- Entering data into cells
- Formatting cells and adjusting column widths/row heights
- Using AutoSum to calculate totals
- Saving workbooks
- Inserting and deleting rows/columns of data
- Using basic formulas
- Printing and previewing worksheets
- Autofilling data to expand budgets over multiple periods
Uses & applications of microsoft excel in vph research
Microsoft Excel is a spreadsheet application that allows users to enter and organize data into columns and rows, perform calculations with formulas, and visualize data through graphs and charts. It consists of worksheets where data is entered into cells that are organized by columns and rows. Common functions include formatting cells, filtering and sorting data, and using formulas to analyze data through calculations and pivot tables to examine relationships between variables.
Excel notes
The document discusses various features of Excel including pivot tables, conditional formatting, charts and graphics, auto-fill, paste special, built-in formulas, data sorting and filtering, and password protection. It also discusses the different parts of the Excel window including workbooks, the ribbon, tabs, the workspace, cells, formulas, and sheet tabs. Finally, it describes different types of charts in Excel like column, bar, line, area, pie, doughnut, XY scatter, and surface charts. It also provides an example of how to filter data in Excel to view specific records.
Microsoft excel training module
The document is a tutorial for learning how to use Microsoft Excel. It contains 10 steps:
1. The table of contents shows the topics
2. Click on topic links to begin learning
3. Learn at your own pace by clicking action buttons
4. Use the tutorial as a reference once familiar with Excel
The tutorial covers Excel basics like the screen, menus, worksheets, entering formulas and data, formatting, charts, and printing. It provides instructions on common tasks and encourages self-paced learning through the interactive material.
Linking chart from excel with power point
The compilation shows the steps by steps on how work like chart, lines, surfaces and tables from excel can be linked with power point.
Similar to Worksheet and workbooks linking (20)
ms excel for mba first sem students of dr hs gour university sagar(m.p)
ms excel for mba first sem students of dr hs gour university sagar(m.p)
CREATING SAVING & OPENING SPREADSHEET USING WORKSHEET https://youtu.be/r8Qj5D...
CREATING SAVING & OPENING SPREADSHEET USING WORKSHEET https://youtu.be/r8Qj5D...
Uses & applications of microsoft excel in vph research
Uses & applications of microsoft excel in vph research
More from Ilgar Zarbaliyev
Calculating Bank Withdrawal Interest and Time A Helpful Template.pdf
Welcome to "Calculating Bank Withdrawal Interest and Time: A Helpful Template" newsletter!
In this insightful newsletter, we dive into the world of banking and provide you with valuable information on how to calculate the interest and time involved in your bank withdrawals. Whether you're a seasoned investor, a curious saver, or simply someone looking to make the most out of your banking transactions, this newsletter is here to guide you.
We understand that determining the interest earned and the time it takes for your bank withdrawals to mature can be complex. That's why our team of experts has curated a handy template that simplifies the process. With our step-by-step instructions and expert tips, you'll gain a better understanding of how to accurately calculate your earnings and plan your financial goals effectively.
Stay updated with the latest trends and insights in the banking industry, learn how to make informed decisions, and discover strategies to maximize your returns. Our newsletter is designed to empower you with the knowledge and tools you need to navigate the world of bank withdrawals with confidence.
So, join us today and embark on a journey towards financial success! Sign up now for our "Calculating Bank Withdrawal Interest and Time: A Helpful Template" newsletter and unlock the secrets to optimizing your banking experience.
Row, Column, Index, Match, Offset Functions. Excel Tutorial
This document provides summaries and examples of Excel functions for working with rows, columns, references, and lookups:
- It explains the ROW and COLUMN functions which return the row or column number of a cell reference.
- The INDIRECT function allows changing a cell reference within a formula without changing the formula itself.
- OFFSET returns a reference that is a specified number of rows and columns from another cell or range.
- INDEX returns a value or reference from within a table or range based on row and column indexes.
- MATCH searches for an item in a range and returns its relative position, useful for lookups.
New Dynamic Array Functions. Excel Tutorial
In September, 2018, we released dynamic array formulas for Excel for Microsoft 365. The differences between dynamic arrays
and legacy Ctrl+Shift+Enter (CSE) formulas are discussed below.
Dynamic array formulas:
Can "spill" outside the cell bounds where the formula is entered. The following example shows the RANDARRAY function in
D1, which spills across D1:F5, or 5 rows by 3 columns. The dynamic array formula tec
Fill series. Data validation. Excel Tutorial
If you have inherited workbooks from
someone else or if you have imported
data from external data sources, you
have probably come across data that
was either structured or formatted (or
both) in such a way that it was either
difficult to read or difficult to work
with. It could be mainframe data that
arrives as all-uppercase letters, dates
that appear in non-date formats,
phone numbers that don’t have dashes
or parentheses, or fields that combine
multiple pieces of data (such as first
names and last names).
HR Insights
This report summarizes job interviews conducted during a job acceptance process, including the total number of consultations and participants, consultations grouped by performance, safety, health, pay policy and working hours, start and end dates of consultations shown in a table, unique worker numbers by position and region in a donut chart, filtering by name of workers and first/second interviewees, number of workers after first and second interviews shown in bars by happy, normal and unhappy criteria, and a table with names of workers, interview dates, interviewers, and interview results. The report was prepared using knowledge from the Enterprise DNA portal.
Sales Analysis Power BI Dashboard
This document discusses a Power BI report on sales analysis created by the author after participating in Enterprise DNA programs. The report contains KPIs like total revenue, total sales, unique orders and average daily sales calculated through DAX measures. It includes pie charts showing information by region, product group and store performance, and allows filtering by sales channel and time. Total revenues are shown over running totals, quarters and in an area chart comparing the current and previous month. Seventeen measures were written in the report.
SUPPLIERS INSIGHTS
This four page report contains supplier quality metrics from seven measures. The first page includes a table of total defects by category and charts of total defects by month/year and type. The second page shows regional defect data by factory in bars and scatter charts. The third page contains bar charts of defects by material and type along with a table of totals by vendor. The fourth page displays downtime analysis with cards of totals, area charts of downtime by material for the current and previous year, and bar and map charts of downtime by category, vendor and plant location. The report applies learning from the Enterprise DNA portal.
What if analysis-goal_seek
What-If Analysis is the process of changing the values in cells to see how those changes will affect the outcome of formulas on the worksheet.
Four kinds of What-If Analysis tools come with Excel: Scenarios, Goal Seek, Solver, and Data Tables. Scenarios and Data Tables take sets of input values and determine possible results.
(https://support.office.com/en-us/article/introduction-to-what-if-analysis-22bffa5f-e891-4acc-bf7a-e4645c446fb4)
Scenarios: It is a collection of input values that are placed in formulas to get a result.
Goal Seek: It is used to find desired result by changing an input value.
Solver: It is used to find optimal solutions for all kind of decision issues.
Data Table: It is a range of cells where one column consists of a series of values, called input cells.
What if-analysis scenarios
By using What-If Analysis tools in Excel, you can use several different sets of values in one or more formulas to explore all the various results.
For example, you can do What-If Analysis to build two budgets that each assumes a certain level of revenue. Or, you can specify a result that you want a formula to produce, and then determine what sets of values will produce that result. Excel provides several different tools to help you perform the type of analysis that fits your needs.
A Scenario is a set of values that Excel saves and can substitute automatically in cells on a worksheet. You can create and save different groups of values on a worksheet and then switch to any of these new scenarios to view different results.
For example, suppose you have two budget scenarios: a worst case and a best case. You can use the Scenario Manager to create both scenarios on the same worksheet, and then switch between them. For each scenario, you specify the cells that change and the values to use for that scenario. When you switch between scenarios, the result cell changes to reflect the different changing cell values.
Recipe
Dear Excel Lovers!
Dear Fast Food Lovers!
And Dear Pizza, Kebab Lovers!
The Excel template file contains menus, including the foods and quantities used in the preparation of 27 (twenty seven) kinds of dishes.
The file consists of 6 sheets.
You can use "RecipeContent" sheet as a cover in the .
On the "ReadytouseProducts" sheet, served 27 kinds of meals are shown with pictures, prices, costs, and income rates.
In the "PurchasedIngredients" Sheet, the ingredients used in the preparation of 27 different dishes are shown together with their prices.
In the "RecipeCostCalculator" Sheet, the ingredients used in the preparation of each dish, are shown with their quantities and prices .
In the "RecipeAnalysisPivotTables" sheet, the detailed report of the dishes through slicers is presented by using the pivot table.
And in the last "Dish Cost Report" Sheet, user can get the necessary information including ingredients, total cost, prices, used weight, etc. in the form of report.
User may add some other expenses like gas, water, etc at the bottom of the report.
We can present this report to the management in the form of a summary and detailed report of the menus.
Excel features and functions such as Data Validation, Upper, Concatenate, Unique, Filter, Sumifs are used in this template.
Template can be downloaded from the following link:
https://www.eloquens.com/tool/pN1nsdNZ/finance/restaurant-financial-plans-templates/kebabs-sandwiches-and-pizzas-recipes-and-ideas
Bon Appetit
Dynamic Amortization Schedule
Financial Schedules- Amortization Schedule
An amortization schedule is a table detailing each periodic payment on an amortizing loan, as generated by an amortization calculator. Amortization refers to the process of paying off a debt over time through regular payments.
https://en.wikipedia.org/wiki/Amortization_schedule
Static Amortization Schedule
Financial Schedules- Amortization Schedule
An amortization schedule is a table detailing each periodic payment on an amortizing loan, as generated by an amortization calculator. Amortization refers to the process of paying off a debt over time through regular payments.
Casings Transactions Spreadsheet
This template will help you to follow your inventory
File can be loaded clicking the next link:
https://drive.google.com/file/d/1lXNY-BC1DBH9UChxjPGLv2FeM9WmHgnB/view?usp=sharing
Credit or investment calculation template
This template will help you to calculate Credit/Investment. Template has been designed dynamically. You may download this template from the next link:
https://drive.google.com/file/d/1WheE3gk5qXJU8g5QRZ42XMXA07OOrD9s/view?usp=sharing
Moving average and linear forecast 6
Moving Average and Forecast Charts made based upon Şişecam Group of Companies' Sales Numbers.
https://drive.google.com/file/d/1D-QaITnyW7gnksvW5YsJpx1eW2Gh_LYE/view?usp=sharing
Migration Tornado Chart
https://drive.google.com/file/d/18Bknjkf0IRibLe6u3sDtVYXHNCjKOrz1/view?usp=sharing
Dynamic diagram
Dynamic Diagram based upon the data (import from geographic regions) of the State Statistical Committee of the Republic of Azerbaijan...
https://drive.google.com/file/d/12vDU0sqV2Yx14AY10CvgoB2kaamCt1BZ/view?usp=sharing
Sales dashboard
https://drive.google.com/file/d/1rZ52j44RM73tdMZkdg1JkjY0b6mHAlrh/view?usp=sharing
This file is about Sales Dashboard Preparation.
Learned from @Karen Abecia after attending webinar organized by @Celia Alves. Thanks them.
Excel shortcuts formula related
This document lists keyboard shortcuts for formula-related tasks in Excel, including inserting autosum formulas with Alt+=, toggling cell references between absolute and relative with F4, displaying the insert function dialog with Shift+F3, and evaluating parts of a formula with F9. It also includes shortcuts for selecting formula-referenced cells like Ctrl+[/] and toggling between value and formula display with Ctrl+`.
More from Ilgar Zarbaliyev (20)
Calculating Bank Withdrawal Interest and Time A Helpful Template.pdf
Calculating Bank Withdrawal Interest and Time A Helpful Template.pdf
Row, Column, Index, Match, Offset Functions. Excel Tutorial
Row, Column, Index, Match, Offset Functions. Excel Tutorial
Recently uploaded
Beyond the Basics of A/B Tests: Highly Innovative Experimentation Tactics You...
This webinar will explore cutting-edge, less familiar but powerful experimentation methodologies which address well-known limitations of standard A/B Testing. Designed for data and product leaders, this session aims to inspire the embrace of innovative approaches and provide insights into the frontiers of experimentation!
一比一原版(Harvard毕业证书)哈佛大学毕业证如何办理
毕业原版【微信:41543339】【(Harvard毕业证书)哈佛大学毕业证】【微信:41543339】成绩单、外壳、offer、留信学历认证(永久存档真实可查)采用学校原版纸张、特殊工艺完全按照原版一比一制作(包括:隐形水印,阴影底纹,钢印LOGO烫金烫银,LOGO烫金烫银复合重叠,文字图案浮雕,激光镭射,紫外荧光,温感,复印防伪)行业标杆!精益求精,诚心合作,真诚制作!多年品质 ,按需精细制作,24小时接单,全套进口原装设备,十五年致力于帮助留学生解决难题,业务范围有加拿大、英国、澳洲、韩国、美国、新加坡,新西兰等学历材料,包您满意。
【我们承诺采用的是学校原版纸张(纸质、底色、纹路),我们拥有全套进口原装设备,特殊工艺都是采用不同机器制作,仿真度基本可以达到100%,所有工艺效果都可提前给客户展示,不满意可以根据客户要求进行调整,直到满意为止!】
【业务选择办理准则】
一、工作未确定,回国需先给父母、亲戚朋友看下文凭的情况,办理一份就读学校的毕业证【微信41543339】文凭即可
二、回国进私企、外企、自己做生意的情况,这些单位是不查询毕业证真伪的,而且国内没有渠道去查询国外文凭的真假,也不需要提供真实教育部认证。鉴于此,办理一份毕业证【微信41543339】即可
三、进国企,银行,事业单位,考公务员等等,这些单位是必需要提供真实教育部认证的,办理教育部认证所需资料众多且烦琐,所有材料您都必须提供原件,我们凭借丰富的经验,快捷的绿色通道帮您快速整合材料,让您少走弯路。
留信网认证的作用:
1:该专业认证可证明留学生真实身份
2:同时对留学生所学专业登记给予评定
3:国家专业人才认证中心颁发入库证书
4:这个认证书并且可以归档倒地方
5:凡事获得留信网入网的信息将会逐步更新到个人身份内,将在公安局网内查询个人身份证信息后,同步读取人才网入库信息
6:个人职称评审加20分
7:个人信誉贷款加10分
8:在国家人才网主办的国家网络招聘大会中纳入资料,供国家高端企业选择人才
留信网服务项目:
1、留学生专业人才库服务(留信分析)
2、国(境)学习人员提供就业推荐信服务
3、留学人员区块链存储服务
→ 【关于价格问题(保证一手价格)】
我们所定的价格是非常合理的,而且我们现在做得单子大多数都是代理和回头客户介绍的所以一般现在有新的单子 我给客户的都是第一手的代理价格,因为我想坦诚对待大家 不想跟大家在价格方面浪费时间
对于老客户或者被老客户介绍过来的朋友,我们都会适当给一些优惠。
选择实体注册公司办理,更放心,更安全!我们的承诺:客户在留信官方认证查询网站查询到认证通过结果后付款,不成功不收费!
The Ipsos - AI - Monitor 2024 Report.pdf
According to Ipsos AI Monitor's 2024 report, 65% Indians said that products and services using AI have profoundly changed their daily life in the past 3-5 years.
一比一原版(GWU,GW文凭证书)乔治·华盛顿大学毕业证如何办理
毕业原版【微信:176555708】【(GWU,GW毕业证书)乔治·华盛顿大学毕业证】【微信:176555708】成绩单、外壳、offer、留信学历认证(永久存档真实可查)采用学校原版纸张、特殊工艺完全按照原版一比一制作(包括:隐形水印,阴影底纹,钢印LOGO烫金烫银,LOGO烫金烫银复合重叠,文字图案浮雕,激光镭射,紫外荧光,温感,复印防伪)行业标杆!精益求精,诚心合作,真诚制作!多年品质 ,按需精细制作,24小时接单,全套进口原装设备,十五年致力于帮助留学生解决难题,业务范围有加拿大、英国、澳洲、韩国、美国、新加坡,新西兰等学历材料,包您满意。
【我们承诺采用的是学校原版纸张(纸质、底色、纹路),我们拥有全套进口原装设备,特殊工艺都是采用不同机器制作,仿真度基本可以达到100%,所有工艺效果都可提前给客户展示,不满意可以根据客户要求进行调整,直到满意为止!】
【业务选择办理准则】
一、工作未确定,回国需先给父母、亲戚朋友看下文凭的情况,办理一份就读学校的毕业证【微信176555708】文凭即可
二、回国进私企、外企、自己做生意的情况,这些单位是不查询毕业证真伪的,而且国内没有渠道去查询国外文凭的真假,也不需要提供真实教育部认证。鉴于此,办理一份毕业证【微信176555708】即可
三、进国企,银行,事业单位,考公务员等等,这些单位是必需要提供真实教育部认证的,办理教育部认证所需资料众多且烦琐,所有材料您都必须提供原件,我们凭借丰富的经验,快捷的绿色通道帮您快速整合材料,让您少走弯路。
留信网认证的作用:
1:该专业认证可证明留学生真实身份
2:同时对留学生所学专业登记给予评定
3:国家专业人才认证中心颁发入库证书
4:这个认证书并且可以归档倒地方
5:凡事获得留信网入网的信息将会逐步更新到个人身份内,将在公安局网内查询个人身份证信息后,同步读取人才网入库信息
6:个人职称评审加20分
7:个人信誉贷款加10分
8:在国家人才网主办的国家网络招聘大会中纳入资料,供国家高端企业选择人才
留信网服务项目:
1、留学生专业人才库服务(留信分析)
2、国(境)学习人员提供就业推荐信服务
3、留学人员区块链存储服务
→ 【关于价格问题(保证一手价格)】
我们所定的价格是非常合理的,而且我们现在做得单子大多数都是代理和回头客户介绍的所以一般现在有新的单子 我给客户的都是第一手的代理价格,因为我想坦诚对待大家 不想跟大家在价格方面浪费时间
对于老客户或者被老客户介绍过来的朋友,我们都会适当给一些优惠。
选择实体注册公司办理,更放心,更安全!我们的承诺:客户在留信官方认证查询网站查询到认证通过结果后付款,不成功不收费!
ViewShift: Hassle-free Dynamic Policy Enforcement for Every Data Lake
Dynamic policy enforcement is becoming an increasingly important topic in today’s world where data privacy and compliance is a top priority for companies, individuals, and regulators alike. In these slides, we discuss how LinkedIn implements a powerful dynamic policy enforcement engine, called ViewShift, and integrates it within its data lake. We show the query engine architecture and how catalog implementations can automatically route table resolutions to compliance-enforcing SQL views. Such views have a set of very interesting properties: (1) They are auto-generated from declarative data annotations. (2) They respect user-level consent and preferences (3) They are context-aware, encoding a different set of transformations for different use cases (4) They are portable; while the SQL logic is only implemented in one SQL dialect, it is accessible in all engines.
#SQL #Views #Privacy #Compliance #DataLake
Analysis insight about a Flyball dog competition team's performance
Insight of my analysis about a Flyball dog competition team's last year performance. Find more: https://github.com/rolandnagy-ds/flyball_race_analysis/tree/main
一比一原版(Coventry毕业证书)考文垂大学毕业证如何办理
毕业原版【微信:41543339】【(Coventry毕业证书)考文垂大学毕业证】【微信:41543339】成绩单、外壳、offer、留信学历认证(永久存档真实可查)采用学校原版纸张、特殊工艺完全按照原版一比一制作(包括:隐形水印,阴影底纹,钢印LOGO烫金烫银,LOGO烫金烫银复合重叠,文字图案浮雕,激光镭射,紫外荧光,温感,复印防伪)行业标杆!精益求精,诚心合作,真诚制作!多年品质 ,按需精细制作,24小时接单,全套进口原装设备,十五年致力于帮助留学生解决难题,业务范围有加拿大、英国、澳洲、韩国、美国、新加坡,新西兰等学历材料,包您满意。
【我们承诺采用的是学校原版纸张(纸质、底色、纹路),我们拥有全套进口原装设备,特殊工艺都是采用不同机器制作,仿真度基本可以达到100%,所有工艺效果都可提前给客户展示,不满意可以根据客户要求进行调整,直到满意为止!】
【业务选择办理准则】
一、工作未确定,回国需先给父母、亲戚朋友看下文凭的情况,办理一份就读学校的毕业证【微信41543339】文凭即可
二、回国进私企、外企、自己做生意的情况,这些单位是不查询毕业证真伪的,而且国内没有渠道去查询国外文凭的真假,也不需要提供真实教育部认证。鉴于此,办理一份毕业证【微信41543339】即可
三、进国企,银行,事业单位,考公务员等等,这些单位是必需要提供真实教育部认证的,办理教育部认证所需资料众多且烦琐,所有材料您都必须提供原件,我们凭借丰富的经验,快捷的绿色通道帮您快速整合材料,让您少走弯路。
留信网认证的作用:
1:该专业认证可证明留学生真实身份
2:同时对留学生所学专业登记给予评定
3:国家专业人才认证中心颁发入库证书
4:这个认证书并且可以归档倒地方
5:凡事获得留信网入网的信息将会逐步更新到个人身份内,将在公安局网内查询个人身份证信息后,同步读取人才网入库信息
6:个人职称评审加20分
7:个人信誉贷款加10分
8:在国家人才网主办的国家网络招聘大会中纳入资料,供国家高端企业选择人才
留信网服务项目:
1、留学生专业人才库服务(留信分析)
2、国(境)学习人员提供就业推荐信服务
3、留学人员区块链存储服务
→ 【关于价格问题(保证一手价格)】
我们所定的价格是非常合理的,而且我们现在做得单子大多数都是代理和回头客户介绍的所以一般现在有新的单子 我给客户的都是第一手的代理价格,因为我想坦诚对待大家 不想跟大家在价格方面浪费时间
对于老客户或者被老客户介绍过来的朋友,我们都会适当给一些优惠。
选择实体注册公司办理,更放心,更安全!我们的承诺:客户在留信官方认证查询网站查询到认证通过结果后付款,不成功不收费!
一比一原版(牛布毕业证书)牛津布鲁克斯大学毕业证如何办理
毕业原版【微信:41543339】【(牛布毕业证书)牛津布鲁克斯大学毕业证】【微信:41543339】成绩单、外壳、offer、留信学历认证(永久存档真实可查)采用学校原版纸张、特殊工艺完全按照原版一比一制作(包括:隐形水印,阴影底纹,钢印LOGO烫金烫银,LOGO烫金烫银复合重叠,文字图案浮雕,激光镭射,紫外荧光,温感,复印防伪)行业标杆!精益求精,诚心合作,真诚制作!多年品质 ,按需精细制作,24小时接单,全套进口原装设备,十五年致力于帮助留学生解决难题,业务范围有加拿大、英国、澳洲、韩国、美国、新加坡,新西兰等学历材料,包您满意。
【我们承诺采用的是学校原版纸张(纸质、底色、纹路),我们拥有全套进口原装设备,特殊工艺都是采用不同机器制作,仿真度基本可以达到100%,所有工艺效果都可提前给客户展示,不满意可以根据客户要求进行调整,直到满意为止!】
【业务选择办理准则】
一、工作未确定,回国需先给父母、亲戚朋友看下文凭的情况,办理一份就读学校的毕业证【微信41543339】文凭即可
二、回国进私企、外企、自己做生意的情况,这些单位是不查询毕业证真伪的,而且国内没有渠道去查询国外文凭的真假,也不需要提供真实教育部认证。鉴于此,办理一份毕业证【微信41543339】即可
三、进国企,银行,事业单位,考公务员等等,这些单位是必需要提供真实教育部认证的,办理教育部认证所需资料众多且烦琐,所有材料您都必须提供原件,我们凭借丰富的经验,快捷的绿色通道帮您快速整合材料,让您少走弯路。
留信网认证的作用:
1:该专业认证可证明留学生真实身份
2:同时对留学生所学专业登记给予评定
3:国家专业人才认证中心颁发入库证书
4:这个认证书并且可以归档倒地方
5:凡事获得留信网入网的信息将会逐步更新到个人身份内,将在公安局网内查询个人身份证信息后,同步读取人才网入库信息
6:个人职称评审加20分
7:个人信誉贷款加10分
8:在国家人才网主办的国家网络招聘大会中纳入资料,供国家高端企业选择人才
留信网服务项目:
1、留学生专业人才库服务(留信分析)
2、国(境)学习人员提供就业推荐信服务
3、留学人员区块链存储服务
→ 【关于价格问题(保证一手价格)】
我们所定的价格是非常合理的,而且我们现在做得单子大多数都是代理和回头客户介绍的所以一般现在有新的单子 我给客户的都是第一手的代理价格,因为我想坦诚对待大家 不想跟大家在价格方面浪费时间
对于老客户或者被老客户介绍过来的朋友,我们都会适当给一些优惠。
选择实体注册公司办理,更放心,更安全!我们的承诺:客户在留信官方认证查询网站查询到认证通过结果后付款,不成功不收费!
STATATHON: Unleashing the Power of Statistics in a 48-Hour Knowledge Extravag...
"Join us for STATATHON, a dynamic 2-day event dedicated to exploring statistical knowledge and its real-world applications. From theory to practice, participants engage in intensive learning sessions, workshops, and challenges, fostering a deeper understanding of statistical methodologies and their significance in various fields."
一比一原版(UO毕业证)渥太华大学毕业证如何办理
UO毕业证录取书【微信95270640】购买(渥太华大学毕业证成绩单硕士学历)Q微信95270640代办UO学历认证留信网伪造渥太华大学学位证书精仿渥太华大学本科/硕士文凭证书补办渥太华大学 diplomaoffer,Transcript购买渥太华大学毕业证成绩单购买UO假毕业证学位证书购买伪造渥太华大学文凭证书学位证书,专业办理雅思、托福成绩单,学生ID卡,在读证明,海外各大学offer录取通知书,毕业证书,成绩单,文凭等材料:1:1完美还原毕业证、offer录取通知书、学生卡等各种在读或毕业材料的防伪工艺(包括 烫金、烫银、钢印、底纹、凹凸版、水印、防伪光标、热敏防伪、文字图案浮雕,激光镭射,紫外荧光,温感光标)学校原版上有的工艺我们一样不会少,不论是老版本还是最新版本,都能保证最高程度还原,力争完美以求让所有同学都能享受到完美的品质服务。
文凭办理流程:
1客户提供办理信息:姓名生日专业学位毕业时间等(如信息不确定可以咨询顾问:微信95270640我们有专业老师帮你查询);
2开始安排制作毕业证成绩单电子图;
3毕业证成绩单电子版做好以后发送给您确认;
4毕业证成绩单电子版您确认信息无误之后安排制作成品;
5成品做好拍照或者视频给您确认;
6快递给客户(国内顺丰国外DHLUPS等快读邮寄)。
7完成交易删除客户资料
高精端提供以下服务:
一:渥太华大学渥太华大学毕业证文凭证书全套材料从防伪到印刷水印底纹到钢印烫金
二:真实使馆认证(留学人员回国证明)使馆存档
三:真实教育部认证教育部存档教育部留服网站可查
四:留信认证留学生信息网站可查
五:与学校颁发的相关证件1:1纸质尺寸制定(定期向各大院校毕业生购买最新版本毕,业证成绩单保证您拿到的是鲁昂大学内部最新版本毕业证成绩单微信95270640)
A.为什么留学生需要操作留信认证?
留信认证全称全国留学生信息服务网认证,隶属于北京中科院。①留信认证门槛条件更低,费用更美丽,并且包过,完单周期短,效率高②留信认证虽然不能去国企,但是一般的公司都没有问题,因为国内很多公司连基本的留学生学历认证都不了解。这对于留学生来说,这就比自己光拿一个证书更有说服力,因为留学学历可以在留信网站上进行查询!
B.为什么我们提供的毕业证成绩单具有使用价值?
查询留服认证是国内鉴别留学生海外学历的唯一途径但认证只是个体行为不是所有留学生都操作所以没有办理认证的留学生的学历在国内也是查询不到的他们也仅仅只有一张文凭。所以这时候我们提供的和学校颁发的一模一样的毕业证成绩单就有了使用价值。只硕大的蛇皮袋手里拎着长铁钩正站在门口朝黑色的屋内张望不好坏人小偷山娃一怔却也灵机一动立马仰起头双手拢在嘴边朝楼上大喊:“爸爸爸——有人找——那人一听朝山娃尴尬地笑笑悻悻地走了山娃立马“嘭的一声将铁门锁死心却咚咚地乱跳当山娃跟父亲说起这事时父亲很吃惊抚摸着山娃的头说还好醒得及时要不家早被人掏空了到时连电视也没得看啰不过父亲还是夸山娃能临危不乱随机应变有胆有谋山娃笑笑说那都是书上学的看童话和小说时多
University of New South Wales degree offer diploma Transcript
澳洲UNSW毕业证书制作新南威尔士大学假文凭定制Q微168899991做UNSW留信网教留服认证海牙认证改UNSW成绩单GPA做UNSW假学位证假文凭高仿毕业证申请新南威尔士大学University of New South Wales degree offer diploma Transcript
06-04-2024 - NYC Tech Week - Discussion on Vector Databases, Unstructured Dat...
06-04-2024 - NYC Tech Week - Discussion on Vector Databases, Unstructured Data and AI
Discussion on Vector Databases, Unstructured Data and AI
https://www.meetup.com/unstructured-data-meetup-new-york/
This meetup is for people working in unstructured data. Speakers will come present about related topics such as vector databases, LLMs, and managing data at scale. The intended audience of this group includes roles like machine learning engineers, data scientists, data engineers, software engineers, and PMs.This meetup was formerly Milvus Meetup, and is sponsored by Zilliz maintainers of Milvus.
一比一原版(Glasgow毕业证书)格拉斯哥大学毕业证如何办理
毕业原版【微信:41543339】【(Glasgow毕业证书)格拉斯哥大学毕业证】【微信:41543339】成绩单、外壳、offer、留信学历认证(永久存档真实可查)采用学校原版纸张、特殊工艺完全按照原版一比一制作(包括:隐形水印,阴影底纹,钢印LOGO烫金烫银,LOGO烫金烫银复合重叠,文字图案浮雕,激光镭射,紫外荧光,温感,复印防伪)行业标杆!精益求精,诚心合作,真诚制作!多年品质 ,按需精细制作,24小时接单,全套进口原装设备,十五年致力于帮助留学生解决难题,业务范围有加拿大、英国、澳洲、韩国、美国、新加坡,新西兰等学历材料,包您满意。
【我们承诺采用的是学校原版纸张(纸质、底色、纹路),我们拥有全套进口原装设备,特殊工艺都是采用不同机器制作,仿真度基本可以达到100%,所有工艺效果都可提前给客户展示,不满意可以根据客户要求进行调整,直到满意为止!】
【业务选择办理准则】
一、工作未确定,回国需先给父母、亲戚朋友看下文凭的情况,办理一份就读学校的毕业证【微信41543339】文凭即可
二、回国进私企、外企、自己做生意的情况,这些单位是不查询毕业证真伪的,而且国内没有渠道去查询国外文凭的真假,也不需要提供真实教育部认证。鉴于此,办理一份毕业证【微信41543339】即可
三、进国企,银行,事业单位,考公务员等等,这些单位是必需要提供真实教育部认证的,办理教育部认证所需资料众多且烦琐,所有材料您都必须提供原件,我们凭借丰富的经验,快捷的绿色通道帮您快速整合材料,让您少走弯路。
留信网认证的作用:
1:该专业认证可证明留学生真实身份
2:同时对留学生所学专业登记给予评定
3:国家专业人才认证中心颁发入库证书
4:这个认证书并且可以归档倒地方
5:凡事获得留信网入网的信息将会逐步更新到个人身份内,将在公安局网内查询个人身份证信息后,同步读取人才网入库信息
6:个人职称评审加20分
7:个人信誉贷款加10分
8:在国家人才网主办的国家网络招聘大会中纳入资料,供国家高端企业选择人才
留信网服务项目:
1、留学生专业人才库服务(留信分析)
2、国(境)学习人员提供就业推荐信服务
3、留学人员区块链存储服务
→ 【关于价格问题(保证一手价格)】
我们所定的价格是非常合理的,而且我们现在做得单子大多数都是代理和回头客户介绍的所以一般现在有新的单子 我给客户的都是第一手的代理价格,因为我想坦诚对待大家 不想跟大家在价格方面浪费时间
对于老客户或者被老客户介绍过来的朋友,我们都会适当给一些优惠。
选择实体注册公司办理,更放心,更安全!我们的承诺:客户在留信官方认证查询网站查询到认证通过结果后付款,不成功不收费!
Intelligence supported media monitoring in veterinary medicine
Media monitoring in veterinary medicien
一比一原版(UCSF文凭证书)旧金山分校毕业证如何办理
毕业原版【微信:176555708】【(UCSF毕业证书)旧金山分校毕业证】【微信:176555708】成绩单、外壳、offer、留信学历认证(永久存档真实可查)采用学校原版纸张、特殊工艺完全按照原版一比一制作(包括:隐形水印,阴影底纹,钢印LOGO烫金烫银,LOGO烫金烫银复合重叠,文字图案浮雕,激光镭射,紫外荧光,温感,复印防伪)行业标杆!精益求精,诚心合作,真诚制作!多年品质 ,按需精细制作,24小时接单,全套进口原装设备,十五年致力于帮助留学生解决难题,业务范围有加拿大、英国、澳洲、韩国、美国、新加坡,新西兰等学历材料,包您满意。
【我们承诺采用的是学校原版纸张(纸质、底色、纹路),我们拥有全套进口原装设备,特殊工艺都是采用不同机器制作,仿真度基本可以达到100%,所有工艺效果都可提前给客户展示,不满意可以根据客户要求进行调整,直到满意为止!】
【业务选择办理准则】
一、工作未确定,回国需先给父母、亲戚朋友看下文凭的情况,办理一份就读学校的毕业证【微信176555708】文凭即可
二、回国进私企、外企、自己做生意的情况,这些单位是不查询毕业证真伪的,而且国内没有渠道去查询国外文凭的真假,也不需要提供真实教育部认证。鉴于此,办理一份毕业证【微信176555708】即可
三、进国企,银行,事业单位,考公务员等等,这些单位是必需要提供真实教育部认证的,办理教育部认证所需资料众多且烦琐,所有材料您都必须提供原件,我们凭借丰富的经验,快捷的绿色通道帮您快速整合材料,让您少走弯路。
留信网认证的作用:
1:该专业认证可证明留学生真实身份
2:同时对留学生所学专业登记给予评定
3:国家专业人才认证中心颁发入库证书
4:这个认证书并且可以归档倒地方
5:凡事获得留信网入网的信息将会逐步更新到个人身份内,将在公安局网内查询个人身份证信息后,同步读取人才网入库信息
6:个人职称评审加20分
7:个人信誉贷款加10分
8:在国家人才网主办的国家网络招聘大会中纳入资料,供国家高端企业选择人才
留信网服务项目:
1、留学生专业人才库服务(留信分析)
2、国(境)学习人员提供就业推荐信服务
3、留学人员区块链存储服务
→ 【关于价格问题(保证一手价格)】
我们所定的价格是非常合理的,而且我们现在做得单子大多数都是代理和回头客户介绍的所以一般现在有新的单子 我给客户的都是第一手的代理价格,因为我想坦诚对待大家 不想跟大家在价格方面浪费时间
对于老客户或者被老客户介绍过来的朋友,我们都会适当给一些优惠。
选择实体注册公司办理,更放心,更安全!我们的承诺:客户在留信官方认证查询网站查询到认证通过结果后付款,不成功不收费!
Learn SQL from basic queries to Advance queries
Dive into the world of data analysis with our comprehensive guide on mastering SQL! This presentation offers a practical approach to learning SQL, focusing on real-world applications and hands-on practice. Whether you're a beginner or looking to sharpen your skills, this guide provides the tools you need to extract, analyze, and interpret data effectively.
Key Highlights:
Foundations of SQL: Understand the basics of SQL, including data retrieval, filtering, and aggregation.
Advanced Queries: Learn to craft complex queries to uncover deep insights from your data.
Data Trends and Patterns: Discover how to identify and interpret trends and patterns in your datasets.
Practical Examples: Follow step-by-step examples to apply SQL techniques in real-world scenarios.
Actionable Insights: Gain the skills to derive actionable insights that drive informed decision-making.
Join us on this journey to enhance your data analysis capabilities and unlock the full potential of SQL. Perfect for data enthusiasts, analysts, and anyone eager to harness the power of data!
#DataAnalysis #SQL #LearningSQL #DataInsights #DataScience #Analytics
Experts live - Improving user adoption with AI
Bekijk de slides van onze sessie Enhancing Modern Workplace Efficiency op Experts Live 2024.
Recently uploaded (20)
Beyond the Basics of A/B Tests: Highly Innovative Experimentation Tactics You...
Beyond the Basics of A/B Tests: Highly Innovative Experimentation Tactics You...
ViewShift: Hassle-free Dynamic Policy Enforcement for Every Data Lake
ViewShift: Hassle-free Dynamic Policy Enforcement for Every Data Lake
Analysis insight about a Flyball dog competition team's performance
Analysis insight about a Flyball dog competition team's performance
Udemy_2024_Global_Learning_Skills_Trends_Report (1).pdf
Udemy_2024_Global_Learning_Skills_Trends_Report (1).pdf
STATATHON: Unleashing the Power of Statistics in a 48-Hour Knowledge Extravag...
STATATHON: Unleashing the Power of Statistics in a 48-Hour Knowledge Extravag...
University of New South Wales degree offer diploma Transcript
University of New South Wales degree offer diploma Transcript
06-04-2024 - NYC Tech Week - Discussion on Vector Databases, Unstructured Dat...
06-04-2024 - NYC Tech Week - Discussion on Vector Databases, Unstructured Dat...
Influence of Marketing Strategy and Market Competition on Business Plan
Influence of Marketing Strategy and Market Competition on Business Plan
Intelligence supported media monitoring in veterinary medicine
Intelligence supported media monitoring in veterinary medicine
Worksheet and workbooks linking
- 1. Workbooks. Worksheets. Linking of Worksheets and Workbooks The core document of Excel is a Workbook. An Excel Workbook can hold any number sheets. The types of sheets are: ❖ Worksheets ❖ Chart Sheets Worksheets The most common type of sheet is a worksheet – which can be considered spreadsheet. Excel 2013, 2016 and 2019 worksheets have 16 384 columns and 1 048 576 rows. The number of cells is 17 179 869 184.
- 2. Chartsheets A chart sheet holds a single chart. Chart sheets make it easier to locate a particular chart. Linking of Worksheets of Workbook The data for the calculation can be located not only on one sheet, but also on different sheets. When entering such a link in the formula, you need: 1. Go to the desired sheet 2. Select a cell or range of cells 3. Enter the sign of the next operation or end the formula with ENTER Enter
- 3. Type of links: Sales! A1: A23 or Return! $B$2, where Sales and Return are sheet names. You can switch between sheets with books using the keys: CTRL + PgUp (one sheet to the left) CTRL + PgDn (one sheet to the right) Linking of Workbooks The initial data for the calculation can be not only in one workbook, but also in different books. You must first open all linked books and when entering the formula: 1. Go to the desired book, sheet. 2. Select a cell or range of cells. 3. Enter the sign of the next operation or end the formula with ENTER View link: +'C:UsersUserDesktopSales_Tracking.xlsx'!SauagePriceList1208[@[Yeni Alış Qiyməti]] When you open the file (if other source books are closed) appears on the screen SECURITY WARNING. If you click Enable Content, then the calculation results will be updated.
- 4. To edit communication with an external source on the Data tab, in the group Queries & Connections, select Edit Links. In the Edit Links window, select the desired action: ▪ Update Values - update the selected source. ▪ Change source - change the external source in case of changing the file name or moving the source to another folder. ▪ Open Source - open the source file for viewing / editing. ▪ Break Link - disconnect from an external source. The formulas in the cells are replaced by the values that are currently received in the cells. The command cannot be undone, so you should create a copy of the file so that, if necessary, the original file with the formulas for future updates remains. ▪ Startup Prompt - the ability to configure the update option:
- 5. • Let users choose to display the alert or not • Don’t display the alert and don’t update automatic links • Don’t display the alert and update links You may use CTRL + Tab combination for the convenience to switch between open books… Sources: Google.com, John Walkenbach, Microsoft Excel 2013 Formulas. ISBN 978-1-118-49189-8 (ebk)