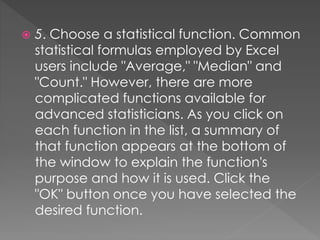
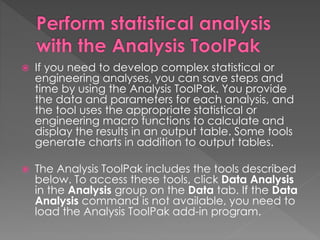
 Microsoft Excel is a versatile program 
for handling a variety of data formats. 
Numerical and financial data is 
commonly entered into Excel, which 
allows entries to be organized in rows 
and columns.
 Excel provides an array of formulas for 
analyzing this data once it is entered. 
Statistical formulas are particularly 
common in Excel, and the program 
has many built-in functions for 
constructing common calculations. It 
is possible to create statistical formulas 
quickly and easily in Excel.
 1. Open Excel. Add numerical data to 
the spreadsheet, or load a completed 
spreadsheet. 
 2. Click in an empty cell where you 
wish to place a statistical formula. Any 
cell can analyze data from any other 
group of cells. The formulas do not 
need to be in close proximity to the 
data.
 3. Click the "fx" button on the Excel 
toolbar. This button appears in front of 
the long white formula bar unique to 
Excel. A pop-up window will appear 
after you click the button. 
 4. Click the drop-down menu labeled 
"Select a category" in the pop-up window. 
Choose the "Statistical" category. The 
function list below this menu will change to 
reflect all the built-in Excel functions that 
may be used in statistical formulas.
 5. Choose a statistical function. Common 
statistical formulas employed by Excel 
users include "Average," "Median" and 
"Count." However, there are more 
complicated functions available for 
advanced statisticians. As you click on 
each function in the list, a summary of 
that function appears at the bottom of 
the window to explain the function's 
purpose and how it is used. Click the 
"OK" button once you have selected the 
desired function.
 6. Configure the statistical formula using the 
formula input box that appears after the 
function is selected. For example, for the 
"Median" function, two number fields 
appear. For most Excel functions, you can 
enter a number, a cell reference pointing 
to that number, or a cell range. For 
"Median," enter a separate number in each 
field, or click in a field then click on the 
spreadsheet to enter a particular cell's 
contents. Drag over a range of numbered 
cells on the spreadsheet to quickly include 
a collection of data in the formula.
 7. Press the "OK" button. The statistical 
formula is created and the results 
display in the selected cell.
Many statistical methods are not available in 
Excel. 
Commonly-used statistics and methods NOT 
available within Excel include: 
 * Boxplots 
 * p-values for the correlation coefficient 
 * Spearman’s and Kendall’s rank correlation 
coefficients 
 * 2-way ANOVA with unequal sample sizes 
(unbalanced data)
 * Multiple comparison tests (post-hoc 
tests following ANOVA) 
 * p-values for two-way ANOVA 
 * Levene’s test for equal variance 
 * Nonparametric tests, including rank-sum 
and Kruskal-Wallis 
 * Scatterplot arrays or brushing 
 * Principal components or other 
multivariate methods
 * GLM (generalized linear models) 
 * Survival analysis methods 
 * Regression diagnostics, such as 
Mallow’s Cp and PRESS 
 (it does compute adjusted r-squared) 
 * Durbin-Watson test for serial correlation 
 * LOESS smooths 
http://www.practicalstats.com/xlsstats/excelstats.html
 If you need to develop complex statistical or 
engineering analyses, you can save steps and 
time by using the Analysis ToolPak. You provide 
the data and parameters for each analysis, and 
the tool uses the appropriate statistical or 
engineering macro functions to calculate and 
display the results in an output table. Some tools 
generate charts in addition to output tables. 
 The Analysis ToolPak includes the tools described 
below. To access these tools, click Data Analysis 
in the Analysis group on the Data tab. If the Data 
Analysis command is not available, you need to 
load the Analysis ToolPak add-in program.
For a description of each tool, click on a 
tool name in the following list. 
 Anova 
 Correlation 
 Covariance 
 Descriptive Statistics 
 Exponential Smoothing 
 F-Test Two-Sample for Variances
Formulas in ms excel for statistics(report2 in ict math ed)

Formulas in ms excel for statistics(report2 in ict math ed)

  • 2.
     Microsoft Excelis a versatile program for handling a variety of data formats. Numerical and financial data is commonly entered into Excel, which allows entries to be organized in rows and columns.
  • 3.
     Excel providesan array of formulas for analyzing this data once it is entered. Statistical formulas are particularly common in Excel, and the program has many built-in functions for constructing common calculations. It is possible to create statistical formulas quickly and easily in Excel.
  • 4.
     1. OpenExcel. Add numerical data to the spreadsheet, or load a completed spreadsheet.  2. Click in an empty cell where you wish to place a statistical formula. Any cell can analyze data from any other group of cells. The formulas do not need to be in close proximity to the data.
  • 5.
     3. Clickthe "fx" button on the Excel toolbar. This button appears in front of the long white formula bar unique to Excel. A pop-up window will appear after you click the button.  4. Click the drop-down menu labeled "Select a category" in the pop-up window. Choose the "Statistical" category. The function list below this menu will change to reflect all the built-in Excel functions that may be used in statistical formulas.
  • 6.
     5. Choosea statistical function. Common statistical formulas employed by Excel users include "Average," "Median" and "Count." However, there are more complicated functions available for advanced statisticians. As you click on each function in the list, a summary of that function appears at the bottom of the window to explain the function's purpose and how it is used. Click the "OK" button once you have selected the desired function.
  • 7.
     6. Configurethe statistical formula using the formula input box that appears after the function is selected. For example, for the "Median" function, two number fields appear. For most Excel functions, you can enter a number, a cell reference pointing to that number, or a cell range. For "Median," enter a separate number in each field, or click in a field then click on the spreadsheet to enter a particular cell's contents. Drag over a range of numbered cells on the spreadsheet to quickly include a collection of data in the formula.
  • 8.
     7. Pressthe "OK" button. The statistical formula is created and the results display in the selected cell.
  • 9.
    Many statistical methodsare not available in Excel. Commonly-used statistics and methods NOT available within Excel include:  * Boxplots  * p-values for the correlation coefficient  * Spearman’s and Kendall’s rank correlation coefficients  * 2-way ANOVA with unequal sample sizes (unbalanced data)
  • 10.
     * Multiplecomparison tests (post-hoc tests following ANOVA)  * p-values for two-way ANOVA  * Levene’s test for equal variance  * Nonparametric tests, including rank-sum and Kruskal-Wallis  * Scatterplot arrays or brushing  * Principal components or other multivariate methods
  • 11.
     * GLM(generalized linear models)  * Survival analysis methods  * Regression diagnostics, such as Mallow’s Cp and PRESS  (it does compute adjusted r-squared)  * Durbin-Watson test for serial correlation  * LOESS smooths http://www.practicalstats.com/xlsstats/excelstats.html
  • 12.
     If youneed to develop complex statistical or engineering analyses, you can save steps and time by using the Analysis ToolPak. You provide the data and parameters for each analysis, and the tool uses the appropriate statistical or engineering macro functions to calculate and display the results in an output table. Some tools generate charts in addition to output tables.  The Analysis ToolPak includes the tools described below. To access these tools, click Data Analysis in the Analysis group on the Data tab. If the Data Analysis command is not available, you need to load the Analysis ToolPak add-in program.
  • 13.
    For a descriptionof each tool, click on a tool name in the following list.  Anova  Correlation  Covariance  Descriptive Statistics  Exponential Smoothing  F-Test Two-Sample for Variances