Sales Analysis Power BI Dashboard
•
0 likes•19 views

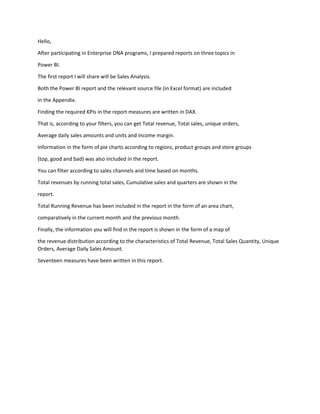
This document discusses a Power BI report on sales analysis created by the author after participating in Enterprise DNA programs. The report contains KPIs like total revenue, total sales, unique orders and average daily sales calculated through DAX measures. It includes pie charts showing information by region, product group and store performance, and allows filtering by sales channel and time. Total revenues are shown over running totals, quarters and in an area chart comparing the current and previous month. Seventeen measures were written in the report.
Recommended

Recommended
More Related Content
Similar to Sales Analysis Power BI Dashboard
Similar to Sales Analysis Power BI Dashboard (19)
More from Ilgar Zarbaliyev
More from Ilgar Zarbaliyev (20)
Recently uploaded
Recently uploaded (20)
Sales Analysis Power BI Dashboard
- 1. Hello, After participating in Enterprise DNA programs, I prepared reports on three topics in Power BI. The first report I will share will be Sales Analysis. Both the Power BI report and the relevant source file (in Excel format) are included in the Appendix. Finding the required KPIs in the report measures are written in DAX. That is, according to your filters, you can get Total revenue, Total sales, unique orders, Average daily sales amounts and units and income margin. Information in the form of pie charts according to regions, product groups and store groups (top, good and bad) was also included in the report. You can filter according to sales channels and time based on months. Total revenues by running total sales, Cumulative sales and quarters are shown in the report. Total Running Revenue has been included in the report in the form of an area chart, comparatively in the current month and the previous month. Finally, the information you will find in the report is shown in the form of a map of the revenue distribution according to the characteristics of Total Revenue, Total Sales Quantity, Unique Orders, Average Daily Sales Amount. Seventeen measures have been written in this report.