Dynamic diagram
•
0 likes•57 views

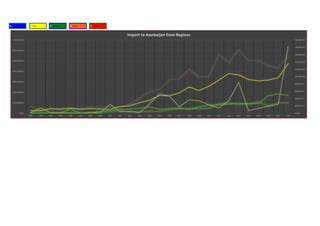
Dynamic Diagram based upon the data (import from geographic regions) of the State Statistical Committee of the Republic of Azerbaijan... https://drive.google.com/file/d/12vDU0sqV2Yx14AY10CvgoB2kaamCt1BZ/view?usp=sharing
Report
Share
Report
Share
Download to read offline
Recommended
Nigeria, Credit to Private Sector and Devaluation
There is a positive correlation between Credit to Private Sector and Importation. (As shown in Graph 1). Hence, an excessive uncontrolled growth in Credit to Private Sector inflates the demand side of the economy's external sector.
External shocks from Crude Oil receipts causes a decline in the supply side of the external sector.
Shortage of FX to serve the already inflated demand of FX eventually leads to Devaluation!
TRABAJO ENCARGADO
This document contains an economic analysis of a project in 3 sentences:
The analysis calculates cash flows over 4 years, discounts them using rates from 20% to 0%, and determines the net present value (VPN) is -S/. 815.58 at a discount rate of 20%. It also finds the internal rate of return (TIR) is 16%. Graphs show the project's net present value at different discount rates, with the breakeven point around 15-20%.
Primer trabajo de ing economica
This document contains calculations to determine the internal rate of return (TIR) of an investment project. It shows the cash flows over 5 years, including the initial investment amount, annual cash flows, and present value of each cash flow discounted at different rates. It then calculates the internal rate of return as 16.08%, the rate where the net present value equals 0. Charts are also included showing how the net present value changes as the discount rate is varied.
Calculating Bank Withdrawal Interest and Time A Helpful Template.pdf
Welcome to "Calculating Bank Withdrawal Interest and Time: A Helpful Template" newsletter!
In this insightful newsletter, we dive into the world of banking and provide you with valuable information on how to calculate the interest and time involved in your bank withdrawals. Whether you're a seasoned investor, a curious saver, or simply someone looking to make the most out of your banking transactions, this newsletter is here to guide you.
We understand that determining the interest earned and the time it takes for your bank withdrawals to mature can be complex. That's why our team of experts has curated a handy template that simplifies the process. With our step-by-step instructions and expert tips, you'll gain a better understanding of how to accurately calculate your earnings and plan your financial goals effectively.
Stay updated with the latest trends and insights in the banking industry, learn how to make informed decisions, and discover strategies to maximize your returns. Our newsletter is designed to empower you with the knowledge and tools you need to navigate the world of bank withdrawals with confidence.
So, join us today and embark on a journey towards financial success! Sign up now for our "Calculating Bank Withdrawal Interest and Time: A Helpful Template" newsletter and unlock the secrets to optimizing your banking experience.
Row, Column, Index, Match, Offset Functions. Excel Tutorial
This document provides summaries and examples of Excel functions for working with rows, columns, references, and lookups:
- It explains the ROW and COLUMN functions which return the row or column number of a cell reference.
- The INDIRECT function allows changing a cell reference within a formula without changing the formula itself.
- OFFSET returns a reference that is a specified number of rows and columns from another cell or range.
- INDEX returns a value or reference from within a table or range based on row and column indexes.
- MATCH searches for an item in a range and returns its relative position, useful for lookups.
New Dynamic Array Functions. Excel Tutorial
In September, 2018, we released dynamic array formulas for Excel for Microsoft 365. The differences between dynamic arrays
and legacy Ctrl+Shift+Enter (CSE) formulas are discussed below.
Dynamic array formulas:
Can "spill" outside the cell bounds where the formula is entered. The following example shows the RANDARRAY function in
D1, which spills across D1:F5, or 5 rows by 3 columns. The dynamic array formula tec
Fill series. Data validation. Excel Tutorial
If you have inherited workbooks from
someone else or if you have imported
data from external data sources, you
have probably come across data that
was either structured or formatted (or
both) in such a way that it was either
difficult to read or difficult to work
with. It could be mainframe data that
arrives as all-uppercase letters, dates
that appear in non-date formats,
phone numbers that don’t have dashes
or parentheses, or fields that combine
multiple pieces of data (such as first
names and last names).
HR Insights
This report summarizes job interviews conducted during a job acceptance process, including the total number of consultations and participants, consultations grouped by performance, safety, health, pay policy and working hours, start and end dates of consultations shown in a table, unique worker numbers by position and region in a donut chart, filtering by name of workers and first/second interviewees, number of workers after first and second interviews shown in bars by happy, normal and unhappy criteria, and a table with names of workers, interview dates, interviewers, and interview results. The report was prepared using knowledge from the Enterprise DNA portal.
Sales Analysis Power BI Dashboard
This document discusses a Power BI report on sales analysis created by the author after participating in Enterprise DNA programs. The report contains KPIs like total revenue, total sales, unique orders and average daily sales calculated through DAX measures. It includes pie charts showing information by region, product group and store performance, and allows filtering by sales channel and time. Total revenues are shown over running totals, quarters and in an area chart comparing the current and previous month. Seventeen measures were written in the report.
SUPPLIERS INSIGHTS
This four page report contains supplier quality metrics from seven measures. The first page includes a table of total defects by category and charts of total defects by month/year and type. The second page shows regional defect data by factory in bars and scatter charts. The third page contains bar charts of defects by material and type along with a table of totals by vendor. The fourth page displays downtime analysis with cards of totals, area charts of downtime by material for the current and previous year, and bar and map charts of downtime by category, vendor and plant location. The report applies learning from the Enterprise DNA portal.
What if analysis-goal_seek
What-If Analysis is the process of changing the values in cells to see how those changes will affect the outcome of formulas on the worksheet.
Four kinds of What-If Analysis tools come with Excel: Scenarios, Goal Seek, Solver, and Data Tables. Scenarios and Data Tables take sets of input values and determine possible results.
(https://support.office.com/en-us/article/introduction-to-what-if-analysis-22bffa5f-e891-4acc-bf7a-e4645c446fb4)
Scenarios: It is a collection of input values that are placed in formulas to get a result.
Goal Seek: It is used to find desired result by changing an input value.
Solver: It is used to find optimal solutions for all kind of decision issues.
Data Table: It is a range of cells where one column consists of a series of values, called input cells.
What if-analysis scenarios
By using What-If Analysis tools in Excel, you can use several different sets of values in one or more formulas to explore all the various results.
For example, you can do What-If Analysis to build two budgets that each assumes a certain level of revenue. Or, you can specify a result that you want a formula to produce, and then determine what sets of values will produce that result. Excel provides several different tools to help you perform the type of analysis that fits your needs.
A Scenario is a set of values that Excel saves and can substitute automatically in cells on a worksheet. You can create and save different groups of values on a worksheet and then switch to any of these new scenarios to view different results.
For example, suppose you have two budget scenarios: a worst case and a best case. You can use the Scenario Manager to create both scenarios on the same worksheet, and then switch between them. For each scenario, you specify the cells that change and the values to use for that scenario. When you switch between scenarios, the result cell changes to reflect the different changing cell values.
Recipe
Dear Excel Lovers!
Dear Fast Food Lovers!
And Dear Pizza, Kebab Lovers!
The Excel template file contains menus, including the foods and quantities used in the preparation of 27 (twenty seven) kinds of dishes.
The file consists of 6 sheets.
You can use "RecipeContent" sheet as a cover in the .
On the "ReadytouseProducts" sheet, served 27 kinds of meals are shown with pictures, prices, costs, and income rates.
In the "PurchasedIngredients" Sheet, the ingredients used in the preparation of 27 different dishes are shown together with their prices.
In the "RecipeCostCalculator" Sheet, the ingredients used in the preparation of each dish, are shown with their quantities and prices .
In the "RecipeAnalysisPivotTables" sheet, the detailed report of the dishes through slicers is presented by using the pivot table.
And in the last "Dish Cost Report" Sheet, user can get the necessary information including ingredients, total cost, prices, used weight, etc. in the form of report.
User may add some other expenses like gas, water, etc at the bottom of the report.
We can present this report to the management in the form of a summary and detailed report of the menus.
Excel features and functions such as Data Validation, Upper, Concatenate, Unique, Filter, Sumifs are used in this template.
Template can be downloaded from the following link:
https://www.eloquens.com/tool/pN1nsdNZ/finance/restaurant-financial-plans-templates/kebabs-sandwiches-and-pizzas-recipes-and-ideas
Bon Appetit
Dynamic Amortization Schedule
Financial Schedules- Amortization Schedule
An amortization schedule is a table detailing each periodic payment on an amortizing loan, as generated by an amortization calculator. Amortization refers to the process of paying off a debt over time through regular payments.
https://en.wikipedia.org/wiki/Amortization_schedule
Static Amortization Schedule
Financial Schedules- Amortization Schedule
An amortization schedule is a table detailing each periodic payment on an amortizing loan, as generated by an amortization calculator. Amortization refers to the process of paying off a debt over time through regular payments.
Casings Transactions Spreadsheet
This template will help you to follow your inventory
File can be loaded clicking the next link:
https://drive.google.com/file/d/1lXNY-BC1DBH9UChxjPGLv2FeM9WmHgnB/view?usp=sharing
Credit or investment calculation template
This template will help you to calculate Credit/Investment. Template has been designed dynamically. You may download this template from the next link:
https://drive.google.com/file/d/1WheE3gk5qXJU8g5QRZ42XMXA07OOrD9s/view?usp=sharing
Moving average and linear forecast 6
Moving Average and Forecast Charts made based upon Şişecam Group of Companies' Sales Numbers.
https://drive.google.com/file/d/1D-QaITnyW7gnksvW5YsJpx1eW2Gh_LYE/view?usp=sharing
Migration Tornado Chart
https://drive.google.com/file/d/18Bknjkf0IRibLe6u3sDtVYXHNCjKOrz1/view?usp=sharing
Sales dashboard
https://drive.google.com/file/d/1rZ52j44RM73tdMZkdg1JkjY0b6mHAlrh/view?usp=sharing
This file is about Sales Dashboard Preparation.
Learned from @Karen Abecia after attending webinar organized by @Celia Alves. Thanks them.
Excel shortcuts formula related
This document lists keyboard shortcuts for formula-related tasks in Excel, including inserting autosum formulas with Alt+=, toggling cell references between absolute and relative with F4, displaying the insert function dialog with Shift+F3, and evaluating parts of a formula with F9. It also includes shortcuts for selecting formula-referenced cells like Ctrl+[/] and toggling between value and formula display with Ctrl+`.
Data analysis scenarios
Data analysis is the process of organizing, examining, and summarizing data to extract useful information. It can be used by various roles like sales managers and scientists to gain insights from raw data through techniques like trend analysis and experimental findings. Microsoft Excel provides tools for data analysis including what-if analysis features like scenarios, goal seek, solver, and data tables that allow users to evaluate how changes to input values affect outcomes. For example, scenarios can model different percentages of items sold at various price points to compare total revenue under each scenario.
Cell references
Cell references come mainly in two styles. But, depending on the use of the dollar sign symbol, the number of styles can be increased to four.
Functions vs formulas
Excel provides a large number of built-in functions that can be used to perform specific calculations or to return information about your spreadsheet data.
Worksheet and workbooks linking
The core document of Excel is a Workbook. Everything that you do in Excel takes place in a Workbook...
Calculation options
Calculation - is the process of computing formulas and then displaying the results as values in the cells that contain the formulas.
10 ways to be a good store manager
A store manager is responsible for overseeing the general operations of a store, including planning schedules, hiring and training employees, ensuring inventory levels and cleanliness, creating and maintaining budgets, and resolving conflicts. Key skills for store managers include leadership, time management, analytical abilities, decision-making, communication, and customer service. Good store managers delegate responsibilities, empower employees to make decisions, provide feedback and coaching, recognize employees' efforts, and resolve issues promptly while treating employees with professionalism and respect.
Chapter wise All Notes of First year Basic Civil Engineering.pptx
Chapter wise All Notes of First year Basic Civil Engineering
Syllabus
Chapter-1
Introduction to objective, scope and outcome the subject
Chapter 2
Introduction: Scope and Specialization of Civil Engineering, Role of civil Engineer in Society, Impact of infrastructural development on economy of country.
Chapter 3
Surveying: Object Principles & Types of Surveying; Site Plans, Plans & Maps; Scales & Unit of different Measurements.
Linear Measurements: Instruments used. Linear Measurement by Tape, Ranging out Survey Lines and overcoming Obstructions; Measurements on sloping ground; Tape corrections, conventional symbols. Angular Measurements: Instruments used; Introduction to Compass Surveying, Bearings and Longitude & Latitude of a Line, Introduction to total station.
Levelling: Instrument used Object of levelling, Methods of levelling in brief, and Contour maps.
Chapter 4
Buildings: Selection of site for Buildings, Layout of Building Plan, Types of buildings, Plinth area, carpet area, floor space index, Introduction to building byelaws, concept of sun light & ventilation. Components of Buildings & their functions, Basic concept of R.C.C., Introduction to types of foundation
Chapter 5
Transportation: Introduction to Transportation Engineering; Traffic and Road Safety: Types and Characteristics of Various Modes of Transportation; Various Road Traffic Signs, Causes of Accidents and Road Safety Measures.
Chapter 6
Environmental Engineering: Environmental Pollution, Environmental Acts and Regulations, Functional Concepts of Ecology, Basics of Species, Biodiversity, Ecosystem, Hydrological Cycle; Chemical Cycles: Carbon, Nitrogen & Phosphorus; Energy Flow in Ecosystems.
Water Pollution: Water Quality standards, Introduction to Treatment & Disposal of Waste Water. Reuse and Saving of Water, Rain Water Harvesting. Solid Waste Management: Classification of Solid Waste, Collection, Transportation and Disposal of Solid. Recycling of Solid Waste: Energy Recovery, Sanitary Landfill, On-Site Sanitation. Air & Noise Pollution: Primary and Secondary air pollutants, Harmful effects of Air Pollution, Control of Air Pollution. . Noise Pollution Harmful Effects of noise pollution, control of noise pollution, Global warming & Climate Change, Ozone depletion, Greenhouse effect
Text Books:
1. Palancharmy, Basic Civil Engineering, McGraw Hill publishers.
2. Satheesh Gopi, Basic Civil Engineering, Pearson Publishers.
3. Ketki Rangwala Dalal, Essentials of Civil Engineering, Charotar Publishing House.
4. BCP, Surveying volume 1
More Related Content
More from Ilgar Zarbaliyev
Sales Analysis Power BI Dashboard
This document discusses a Power BI report on sales analysis created by the author after participating in Enterprise DNA programs. The report contains KPIs like total revenue, total sales, unique orders and average daily sales calculated through DAX measures. It includes pie charts showing information by region, product group and store performance, and allows filtering by sales channel and time. Total revenues are shown over running totals, quarters and in an area chart comparing the current and previous month. Seventeen measures were written in the report.
SUPPLIERS INSIGHTS
This four page report contains supplier quality metrics from seven measures. The first page includes a table of total defects by category and charts of total defects by month/year and type. The second page shows regional defect data by factory in bars and scatter charts. The third page contains bar charts of defects by material and type along with a table of totals by vendor. The fourth page displays downtime analysis with cards of totals, area charts of downtime by material for the current and previous year, and bar and map charts of downtime by category, vendor and plant location. The report applies learning from the Enterprise DNA portal.
What if analysis-goal_seek
What-If Analysis is the process of changing the values in cells to see how those changes will affect the outcome of formulas on the worksheet.
Four kinds of What-If Analysis tools come with Excel: Scenarios, Goal Seek, Solver, and Data Tables. Scenarios and Data Tables take sets of input values and determine possible results.
(https://support.office.com/en-us/article/introduction-to-what-if-analysis-22bffa5f-e891-4acc-bf7a-e4645c446fb4)
Scenarios: It is a collection of input values that are placed in formulas to get a result.
Goal Seek: It is used to find desired result by changing an input value.
Solver: It is used to find optimal solutions for all kind of decision issues.
Data Table: It is a range of cells where one column consists of a series of values, called input cells.
What if-analysis scenarios
By using What-If Analysis tools in Excel, you can use several different sets of values in one or more formulas to explore all the various results.
For example, you can do What-If Analysis to build two budgets that each assumes a certain level of revenue. Or, you can specify a result that you want a formula to produce, and then determine what sets of values will produce that result. Excel provides several different tools to help you perform the type of analysis that fits your needs.
A Scenario is a set of values that Excel saves and can substitute automatically in cells on a worksheet. You can create and save different groups of values on a worksheet and then switch to any of these new scenarios to view different results.
For example, suppose you have two budget scenarios: a worst case and a best case. You can use the Scenario Manager to create both scenarios on the same worksheet, and then switch between them. For each scenario, you specify the cells that change and the values to use for that scenario. When you switch between scenarios, the result cell changes to reflect the different changing cell values.
Recipe
Dear Excel Lovers!
Dear Fast Food Lovers!
And Dear Pizza, Kebab Lovers!
The Excel template file contains menus, including the foods and quantities used in the preparation of 27 (twenty seven) kinds of dishes.
The file consists of 6 sheets.
You can use "RecipeContent" sheet as a cover in the .
On the "ReadytouseProducts" sheet, served 27 kinds of meals are shown with pictures, prices, costs, and income rates.
In the "PurchasedIngredients" Sheet, the ingredients used in the preparation of 27 different dishes are shown together with their prices.
In the "RecipeCostCalculator" Sheet, the ingredients used in the preparation of each dish, are shown with their quantities and prices .
In the "RecipeAnalysisPivotTables" sheet, the detailed report of the dishes through slicers is presented by using the pivot table.
And in the last "Dish Cost Report" Sheet, user can get the necessary information including ingredients, total cost, prices, used weight, etc. in the form of report.
User may add some other expenses like gas, water, etc at the bottom of the report.
We can present this report to the management in the form of a summary and detailed report of the menus.
Excel features and functions such as Data Validation, Upper, Concatenate, Unique, Filter, Sumifs are used in this template.
Template can be downloaded from the following link:
https://www.eloquens.com/tool/pN1nsdNZ/finance/restaurant-financial-plans-templates/kebabs-sandwiches-and-pizzas-recipes-and-ideas
Bon Appetit
Dynamic Amortization Schedule
Financial Schedules- Amortization Schedule
An amortization schedule is a table detailing each periodic payment on an amortizing loan, as generated by an amortization calculator. Amortization refers to the process of paying off a debt over time through regular payments.
https://en.wikipedia.org/wiki/Amortization_schedule
Static Amortization Schedule
Financial Schedules- Amortization Schedule
An amortization schedule is a table detailing each periodic payment on an amortizing loan, as generated by an amortization calculator. Amortization refers to the process of paying off a debt over time through regular payments.
Casings Transactions Spreadsheet
This template will help you to follow your inventory
File can be loaded clicking the next link:
https://drive.google.com/file/d/1lXNY-BC1DBH9UChxjPGLv2FeM9WmHgnB/view?usp=sharing
Credit or investment calculation template
This template will help you to calculate Credit/Investment. Template has been designed dynamically. You may download this template from the next link:
https://drive.google.com/file/d/1WheE3gk5qXJU8g5QRZ42XMXA07OOrD9s/view?usp=sharing
Moving average and linear forecast 6
Moving Average and Forecast Charts made based upon Şişecam Group of Companies' Sales Numbers.
https://drive.google.com/file/d/1D-QaITnyW7gnksvW5YsJpx1eW2Gh_LYE/view?usp=sharing
Migration Tornado Chart
https://drive.google.com/file/d/18Bknjkf0IRibLe6u3sDtVYXHNCjKOrz1/view?usp=sharing
Sales dashboard
https://drive.google.com/file/d/1rZ52j44RM73tdMZkdg1JkjY0b6mHAlrh/view?usp=sharing
This file is about Sales Dashboard Preparation.
Learned from @Karen Abecia after attending webinar organized by @Celia Alves. Thanks them.
Excel shortcuts formula related
This document lists keyboard shortcuts for formula-related tasks in Excel, including inserting autosum formulas with Alt+=, toggling cell references between absolute and relative with F4, displaying the insert function dialog with Shift+F3, and evaluating parts of a formula with F9. It also includes shortcuts for selecting formula-referenced cells like Ctrl+[/] and toggling between value and formula display with Ctrl+`.
Data analysis scenarios
Data analysis is the process of organizing, examining, and summarizing data to extract useful information. It can be used by various roles like sales managers and scientists to gain insights from raw data through techniques like trend analysis and experimental findings. Microsoft Excel provides tools for data analysis including what-if analysis features like scenarios, goal seek, solver, and data tables that allow users to evaluate how changes to input values affect outcomes. For example, scenarios can model different percentages of items sold at various price points to compare total revenue under each scenario.
Cell references
Cell references come mainly in two styles. But, depending on the use of the dollar sign symbol, the number of styles can be increased to four.
Functions vs formulas
Excel provides a large number of built-in functions that can be used to perform specific calculations or to return information about your spreadsheet data.
Worksheet and workbooks linking
The core document of Excel is a Workbook. Everything that you do in Excel takes place in a Workbook...
Calculation options
Calculation - is the process of computing formulas and then displaying the results as values in the cells that contain the formulas.
10 ways to be a good store manager
A store manager is responsible for overseeing the general operations of a store, including planning schedules, hiring and training employees, ensuring inventory levels and cleanliness, creating and maintaining budgets, and resolving conflicts. Key skills for store managers include leadership, time management, analytical abilities, decision-making, communication, and customer service. Good store managers delegate responsibilities, empower employees to make decisions, provide feedback and coaching, recognize employees' efforts, and resolve issues promptly while treating employees with professionalism and respect.
More from Ilgar Zarbaliyev (20)
Recently uploaded
Chapter wise All Notes of First year Basic Civil Engineering.pptx
Chapter wise All Notes of First year Basic Civil Engineering
Syllabus
Chapter-1
Introduction to objective, scope and outcome the subject
Chapter 2
Introduction: Scope and Specialization of Civil Engineering, Role of civil Engineer in Society, Impact of infrastructural development on economy of country.
Chapter 3
Surveying: Object Principles & Types of Surveying; Site Plans, Plans & Maps; Scales & Unit of different Measurements.
Linear Measurements: Instruments used. Linear Measurement by Tape, Ranging out Survey Lines and overcoming Obstructions; Measurements on sloping ground; Tape corrections, conventional symbols. Angular Measurements: Instruments used; Introduction to Compass Surveying, Bearings and Longitude & Latitude of a Line, Introduction to total station.
Levelling: Instrument used Object of levelling, Methods of levelling in brief, and Contour maps.
Chapter 4
Buildings: Selection of site for Buildings, Layout of Building Plan, Types of buildings, Plinth area, carpet area, floor space index, Introduction to building byelaws, concept of sun light & ventilation. Components of Buildings & their functions, Basic concept of R.C.C., Introduction to types of foundation
Chapter 5
Transportation: Introduction to Transportation Engineering; Traffic and Road Safety: Types and Characteristics of Various Modes of Transportation; Various Road Traffic Signs, Causes of Accidents and Road Safety Measures.
Chapter 6
Environmental Engineering: Environmental Pollution, Environmental Acts and Regulations, Functional Concepts of Ecology, Basics of Species, Biodiversity, Ecosystem, Hydrological Cycle; Chemical Cycles: Carbon, Nitrogen & Phosphorus; Energy Flow in Ecosystems.
Water Pollution: Water Quality standards, Introduction to Treatment & Disposal of Waste Water. Reuse and Saving of Water, Rain Water Harvesting. Solid Waste Management: Classification of Solid Waste, Collection, Transportation and Disposal of Solid. Recycling of Solid Waste: Energy Recovery, Sanitary Landfill, On-Site Sanitation. Air & Noise Pollution: Primary and Secondary air pollutants, Harmful effects of Air Pollution, Control of Air Pollution. . Noise Pollution Harmful Effects of noise pollution, control of noise pollution, Global warming & Climate Change, Ozone depletion, Greenhouse effect
Text Books:
1. Palancharmy, Basic Civil Engineering, McGraw Hill publishers.
2. Satheesh Gopi, Basic Civil Engineering, Pearson Publishers.
3. Ketki Rangwala Dalal, Essentials of Civil Engineering, Charotar Publishing House.
4. BCP, Surveying volume 1
Hindi varnamala | hindi alphabet PPT.pdf
हिंदी वर्णमाला पीपीटी, hindi alphabet PPT presentation, hindi varnamala PPT, Hindi Varnamala pdf, हिंदी स्वर, हिंदी व्यंजन, sikhiye hindi varnmala, dr. mulla adam ali, hindi language and literature, hindi alphabet with drawing, hindi alphabet pdf, hindi varnamala for childrens, hindi language, hindi varnamala practice for kids, https://www.drmullaadamali.com
South African Journal of Science: Writing with integrity workshop (2024)
South African Journal of Science: Writing with integrity workshop (2024)Academy of Science of South Africa
A workshop hosted by the South African Journal of Science aimed at postgraduate students and early career researchers with little or no experience in writing and publishing journal articles.Pollock and Snow "DEIA in the Scholarly Landscape, Session One: Setting Expec...
Pollock and Snow "DEIA in the Scholarly Landscape, Session One: Setting Expec...National Information Standards Organization (NISO)
This presentation was provided by Steph Pollock of The American Psychological Association’s Journals Program, and Damita Snow, of The American Society of Civil Engineers (ASCE), for the initial session of NISO's 2024 Training Series "DEIA in the Scholarly Landscape." Session One: 'Setting Expectations: a DEIA Primer,' was held June 6, 2024.Main Java[All of the Base Concepts}.docx
This is part 1 of my Java Learning Journey. This Contains Custom methods, classes, constructors, packages, multithreading , try- catch block, finally block and more.
How to Make a Field Mandatory in Odoo 17
In Odoo, making a field required can be done through both Python code and XML views. When you set the required attribute to True in Python code, it makes the field required across all views where it's used. Conversely, when you set the required attribute in XML views, it makes the field required only in the context of that particular view.
How to Add Chatter in the odoo 17 ERP Module
In Odoo, the chatter is like a chat tool that helps you work together on records. You can leave notes and track things, making it easier to talk with your team and partners. Inside chatter, all communication history, activity, and changes will be displayed.
What is Digital Literacy? A guest blog from Andy McLaughlin, University of Ab...
What is Digital Literacy? A guest blog from Andy McLaughlin, University of Aberdeen
Leveraging Generative AI to Drive Nonprofit Innovation
In this webinar, participants learned how to utilize Generative AI to streamline operations and elevate member engagement. Amazon Web Service experts provided a customer specific use cases and dived into low/no-code tools that are quick and easy to deploy through Amazon Web Service (AWS.)
LAND USE LAND COVER AND NDVI OF MIRZAPUR DISTRICT, UP
This Dissertation explores the particular circumstances of Mirzapur, a region located in the
core of India. Mirzapur, with its varied terrains and abundant biodiversity, offers an optimal
environment for investigating the changes in vegetation cover dynamics. Our study utilizes
advanced technologies such as GIS (Geographic Information Systems) and Remote sensing to
analyze the transformations that have taken place over the course of a decade.
The complex relationship between human activities and the environment has been the focus
of extensive research and worry. As the global community grapples with swift urbanization,
population expansion, and economic progress, the effects on natural ecosystems are becoming
more evident. A crucial element of this impact is the alteration of vegetation cover, which plays a
significant role in maintaining the ecological equilibrium of our planet.Land serves as the foundation for all human activities and provides the necessary materials for
these activities. As the most crucial natural resource, its utilization by humans results in different
'Land uses,' which are determined by both human activities and the physical characteristics of the
land.
The utilization of land is impacted by human needs and environmental factors. In countries
like India, rapid population growth and the emphasis on extensive resource exploitation can lead
to significant land degradation, adversely affecting the region's land cover.
Therefore, human intervention has significantly influenced land use patterns over many
centuries, evolving its structure over time and space. In the present era, these changes have
accelerated due to factors such as agriculture and urbanization. Information regarding land use and
cover is essential for various planning and management tasks related to the Earth's surface,
providing crucial environmental data for scientific, resource management, policy purposes, and
diverse human activities.
Accurate understanding of land use and cover is imperative for the development planning
of any area. Consequently, a wide range of professionals, including earth system scientists, land
and water managers, and urban planners, are interested in obtaining data on land use and cover
changes, conversion trends, and other related patterns. The spatial dimensions of land use and
cover support policymakers and scientists in making well-informed decisions, as alterations in
these patterns indicate shifts in economic and social conditions. Monitoring such changes with the
help of Advanced technologies like Remote Sensing and Geographic Information Systems is
crucial for coordinated efforts across different administrative levels. Advanced technologies like
Remote Sensing and Geographic Information Systems
9
Changes in vegetation cover refer to variations in the distribution, composition, and overall
structure of plant communities across different temporal and spatial scales. These changes can
occur natural.
The History of Stoke Newington Street Names
Presented at the Stoke Newington Literary Festival on 9th June 2024
www.StokeNewingtonHistory.com
BÀI TẬP BỔ TRỢ TIẾNG ANH 8 CẢ NĂM - GLOBAL SUCCESS - NĂM HỌC 2023-2024 (CÓ FI...
BÀI TẬP BỔ TRỢ TIẾNG ANH 8 CẢ NĂM - GLOBAL SUCCESS - NĂM HỌC 2023-2024 (CÓ FI...Nguyen Thanh Tu Collection
https://app.box.com/s/y977uz6bpd3af4qsebv7r9b7s21935vdBÀI TẬP BỔ TRỢ TIẾNG ANH LỚP 9 CẢ NĂM - GLOBAL SUCCESS - NĂM HỌC 2024-2025 - ...
BÀI TẬP BỔ TRỢ TIẾNG ANH LỚP 9 CẢ NĂM - GLOBAL SUCCESS - NĂM HỌC 2024-2025 - ...Nguyen Thanh Tu Collection
https://app.box.com/s/tacvl9ekroe9hqupdnjruiypvm9rdaneChapter 4 - Islamic Financial Institutions in Malaysia.pptx
Chapter 4 - Islamic Financial Institutions in Malaysia.pptxMohd Adib Abd Muin, Senior Lecturer at Universiti Utara Malaysia
This slide is special for master students (MIBS & MIFB) in UUM. Also useful for readers who are interested in the topic of contemporary Islamic banking.
BBR 2024 Summer Sessions Interview Training
Qualitative research interview training by Professor Katrina Pritchard and Dr Helen Williams
Recently uploaded (20)
Chapter wise All Notes of First year Basic Civil Engineering.pptx
Chapter wise All Notes of First year Basic Civil Engineering.pptx
NEWSPAPERS - QUESTION 1 - REVISION POWERPOINT.pptx
NEWSPAPERS - QUESTION 1 - REVISION POWERPOINT.pptx
South African Journal of Science: Writing with integrity workshop (2024)
South African Journal of Science: Writing with integrity workshop (2024)
Pollock and Snow "DEIA in the Scholarly Landscape, Session One: Setting Expec...
Pollock and Snow "DEIA in the Scholarly Landscape, Session One: Setting Expec...
What is Digital Literacy? A guest blog from Andy McLaughlin, University of Ab...
What is Digital Literacy? A guest blog from Andy McLaughlin, University of Ab...
Leveraging Generative AI to Drive Nonprofit Innovation
Leveraging Generative AI to Drive Nonprofit Innovation
LAND USE LAND COVER AND NDVI OF MIRZAPUR DISTRICT, UP
LAND USE LAND COVER AND NDVI OF MIRZAPUR DISTRICT, UP
BÀI TẬP BỔ TRỢ TIẾNG ANH 8 CẢ NĂM - GLOBAL SUCCESS - NĂM HỌC 2023-2024 (CÓ FI...
BÀI TẬP BỔ TRỢ TIẾNG ANH 8 CẢ NĂM - GLOBAL SUCCESS - NĂM HỌC 2023-2024 (CÓ FI...
BÀI TẬP BỔ TRỢ TIẾNG ANH LỚP 9 CẢ NĂM - GLOBAL SUCCESS - NĂM HỌC 2024-2025 - ...
BÀI TẬP BỔ TRỢ TIẾNG ANH LỚP 9 CẢ NĂM - GLOBAL SUCCESS - NĂM HỌC 2024-2025 - ...
Digital Artefact 1 - Tiny Home Environmental Design
Digital Artefact 1 - Tiny Home Environmental Design
Chapter 4 - Islamic Financial Institutions in Malaysia.pptx
Chapter 4 - Islamic Financial Institutions in Malaysia.pptx
Dynamic diagram
- 1. Europe Asia Americas Africa Oceania 0.00 $ 20,000.00 $ 40,000.00 $ 60,000.00 $ 80,000.00 $ 100,000.00 $ 120,000.00 $ 140,000.00 $ 160,000.00 $ 180,000.00 $ 200,000.00 $ 0.00 $ 1,000,000.00 $ 2,000,000.00 $ 3,000,000.00 $ 4,000,000.00 $ 5,000,000.00 $ 6,000,000.00 $ 7,000,000.00 $ 1992 1993 1994 1995 1996 1997 1998 1999 2000 2001 2002 2003 2004 2005 2006 2007 2008 2009 2010 2011 2012 2013 2014 2015 2016 2017 2018 Import to Azerbaijan from Regions