Download as PDF, PPTX
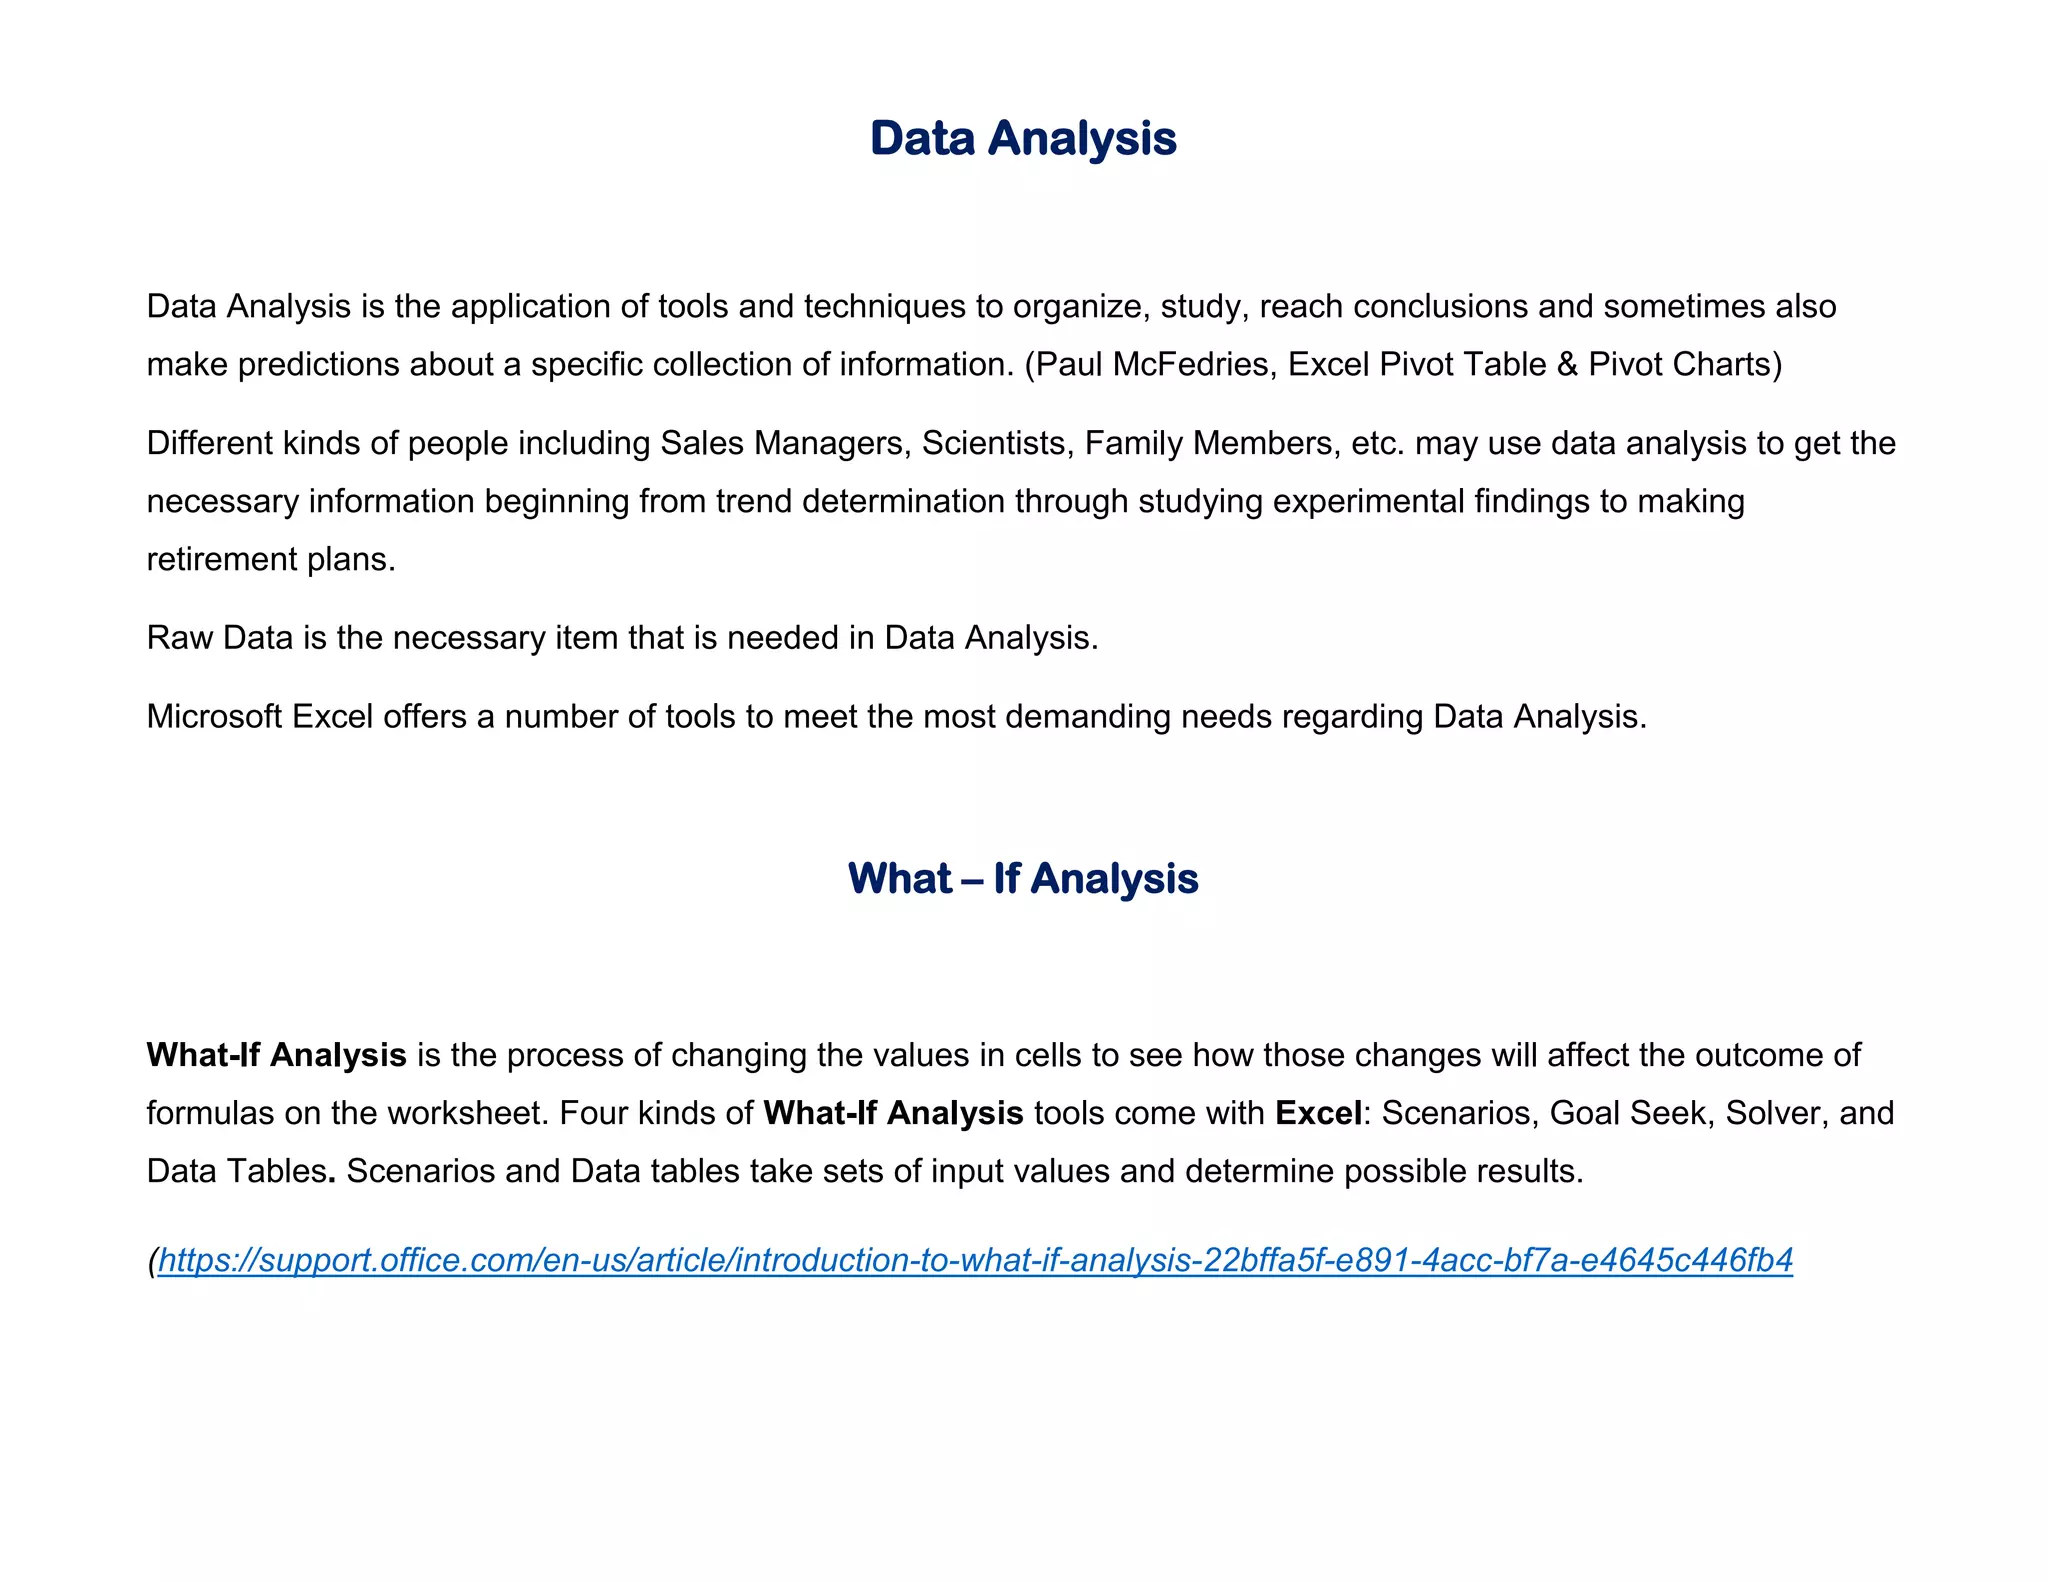
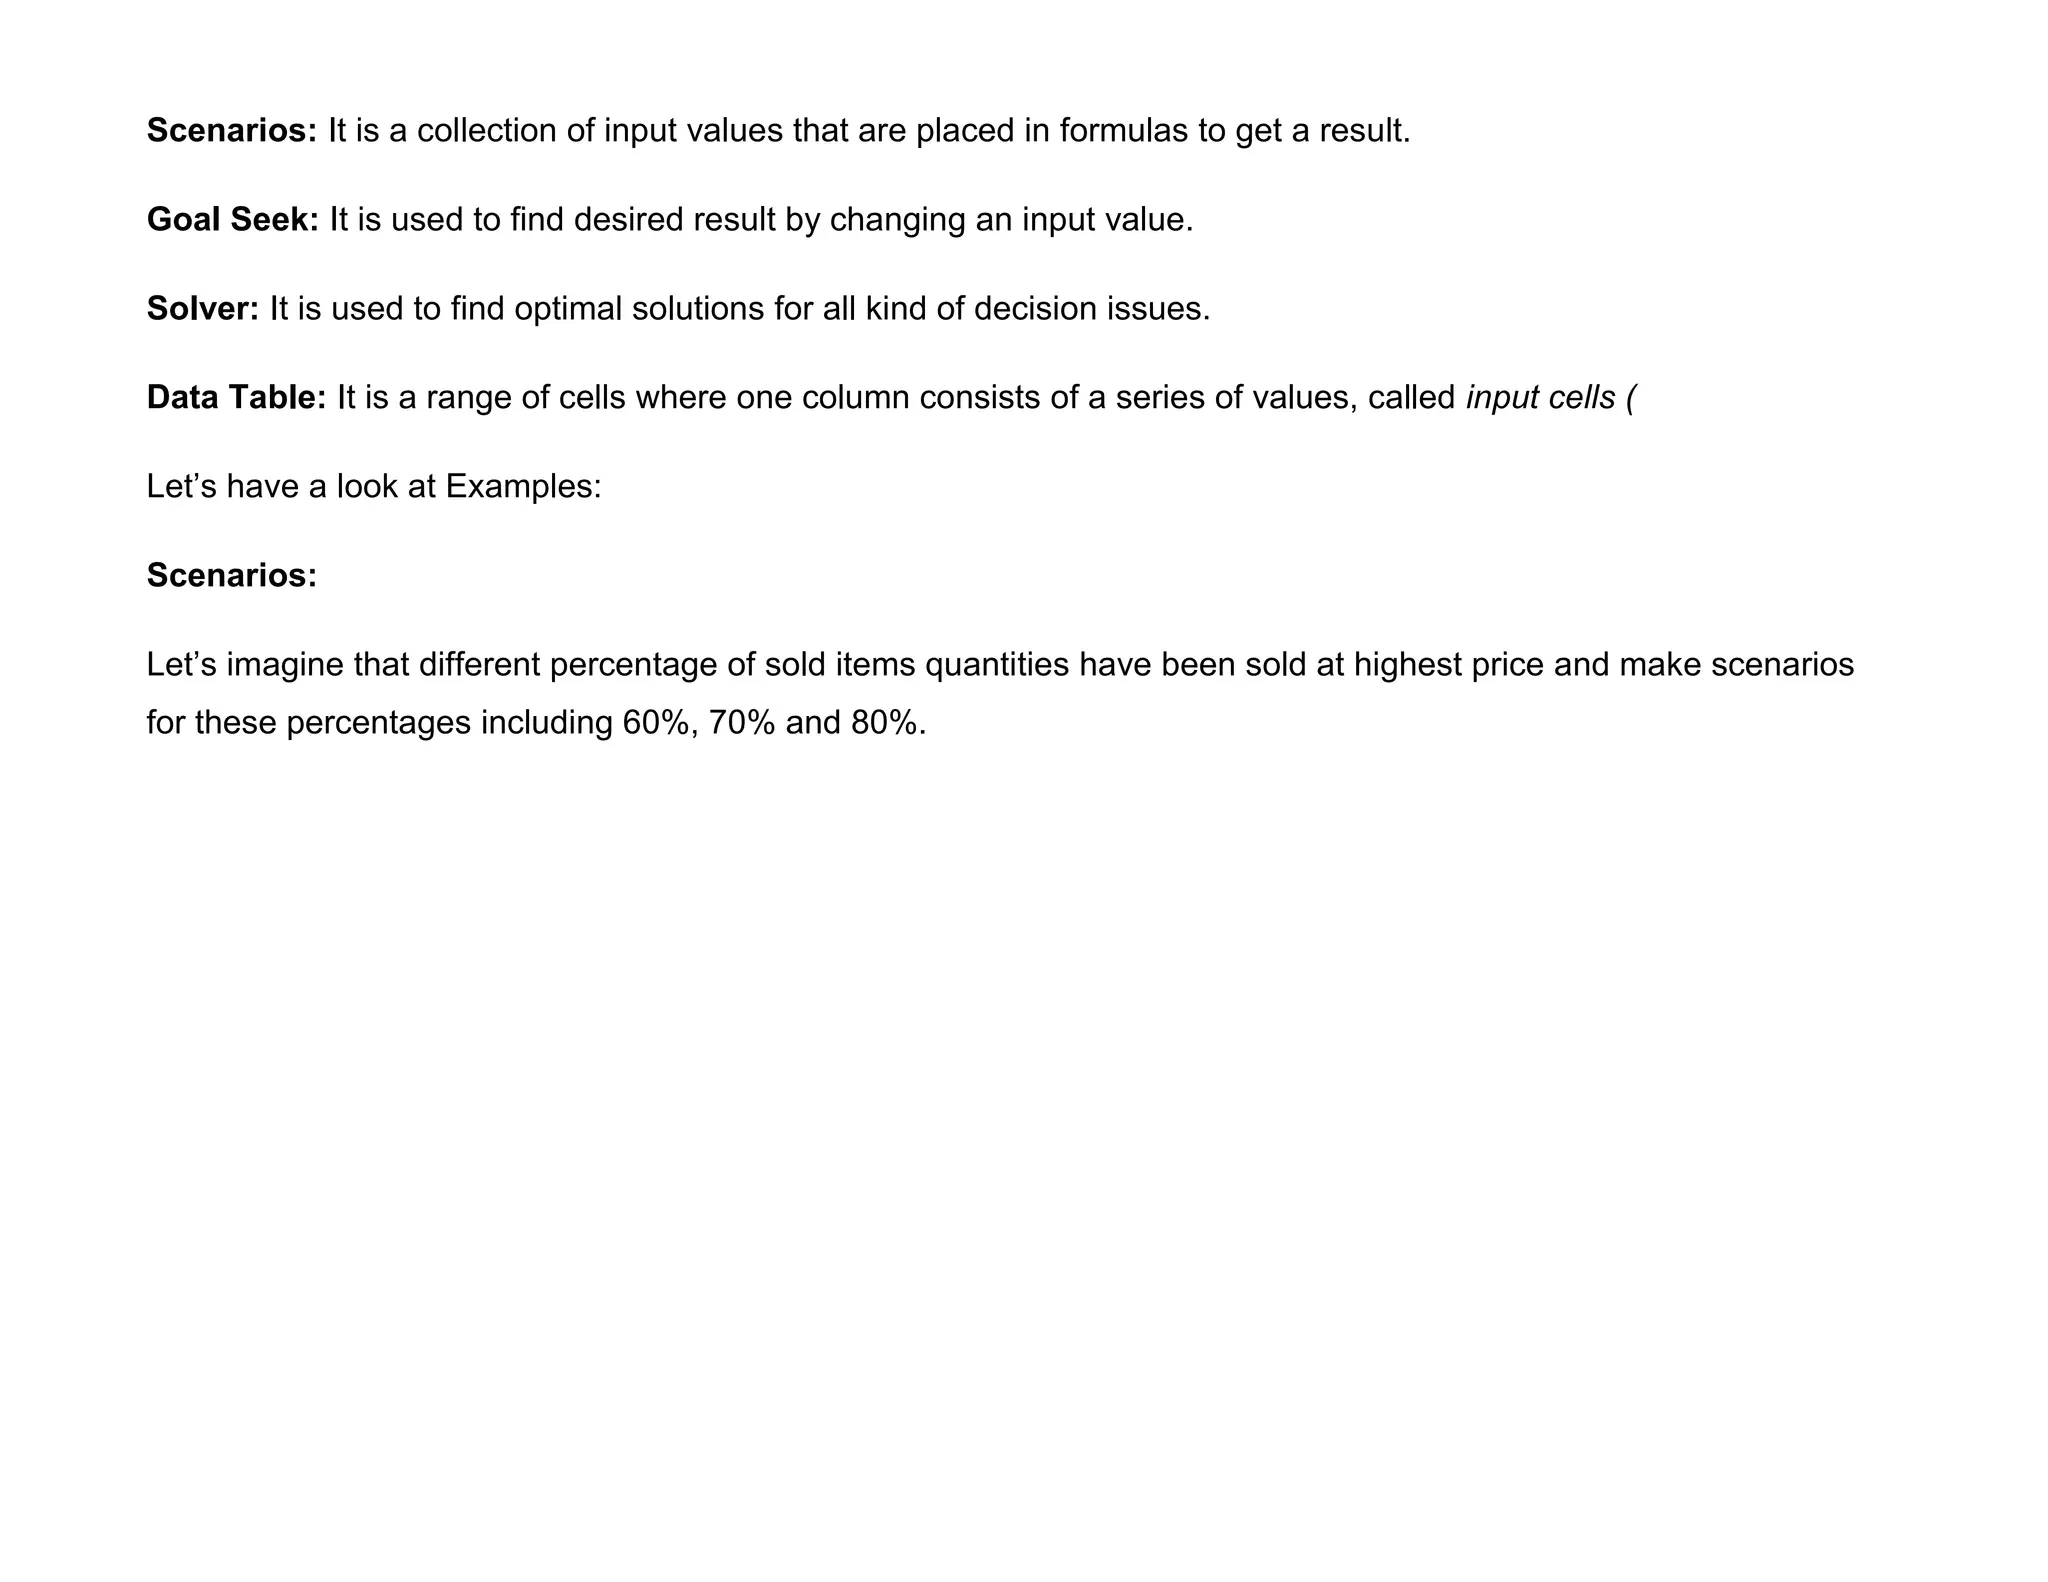
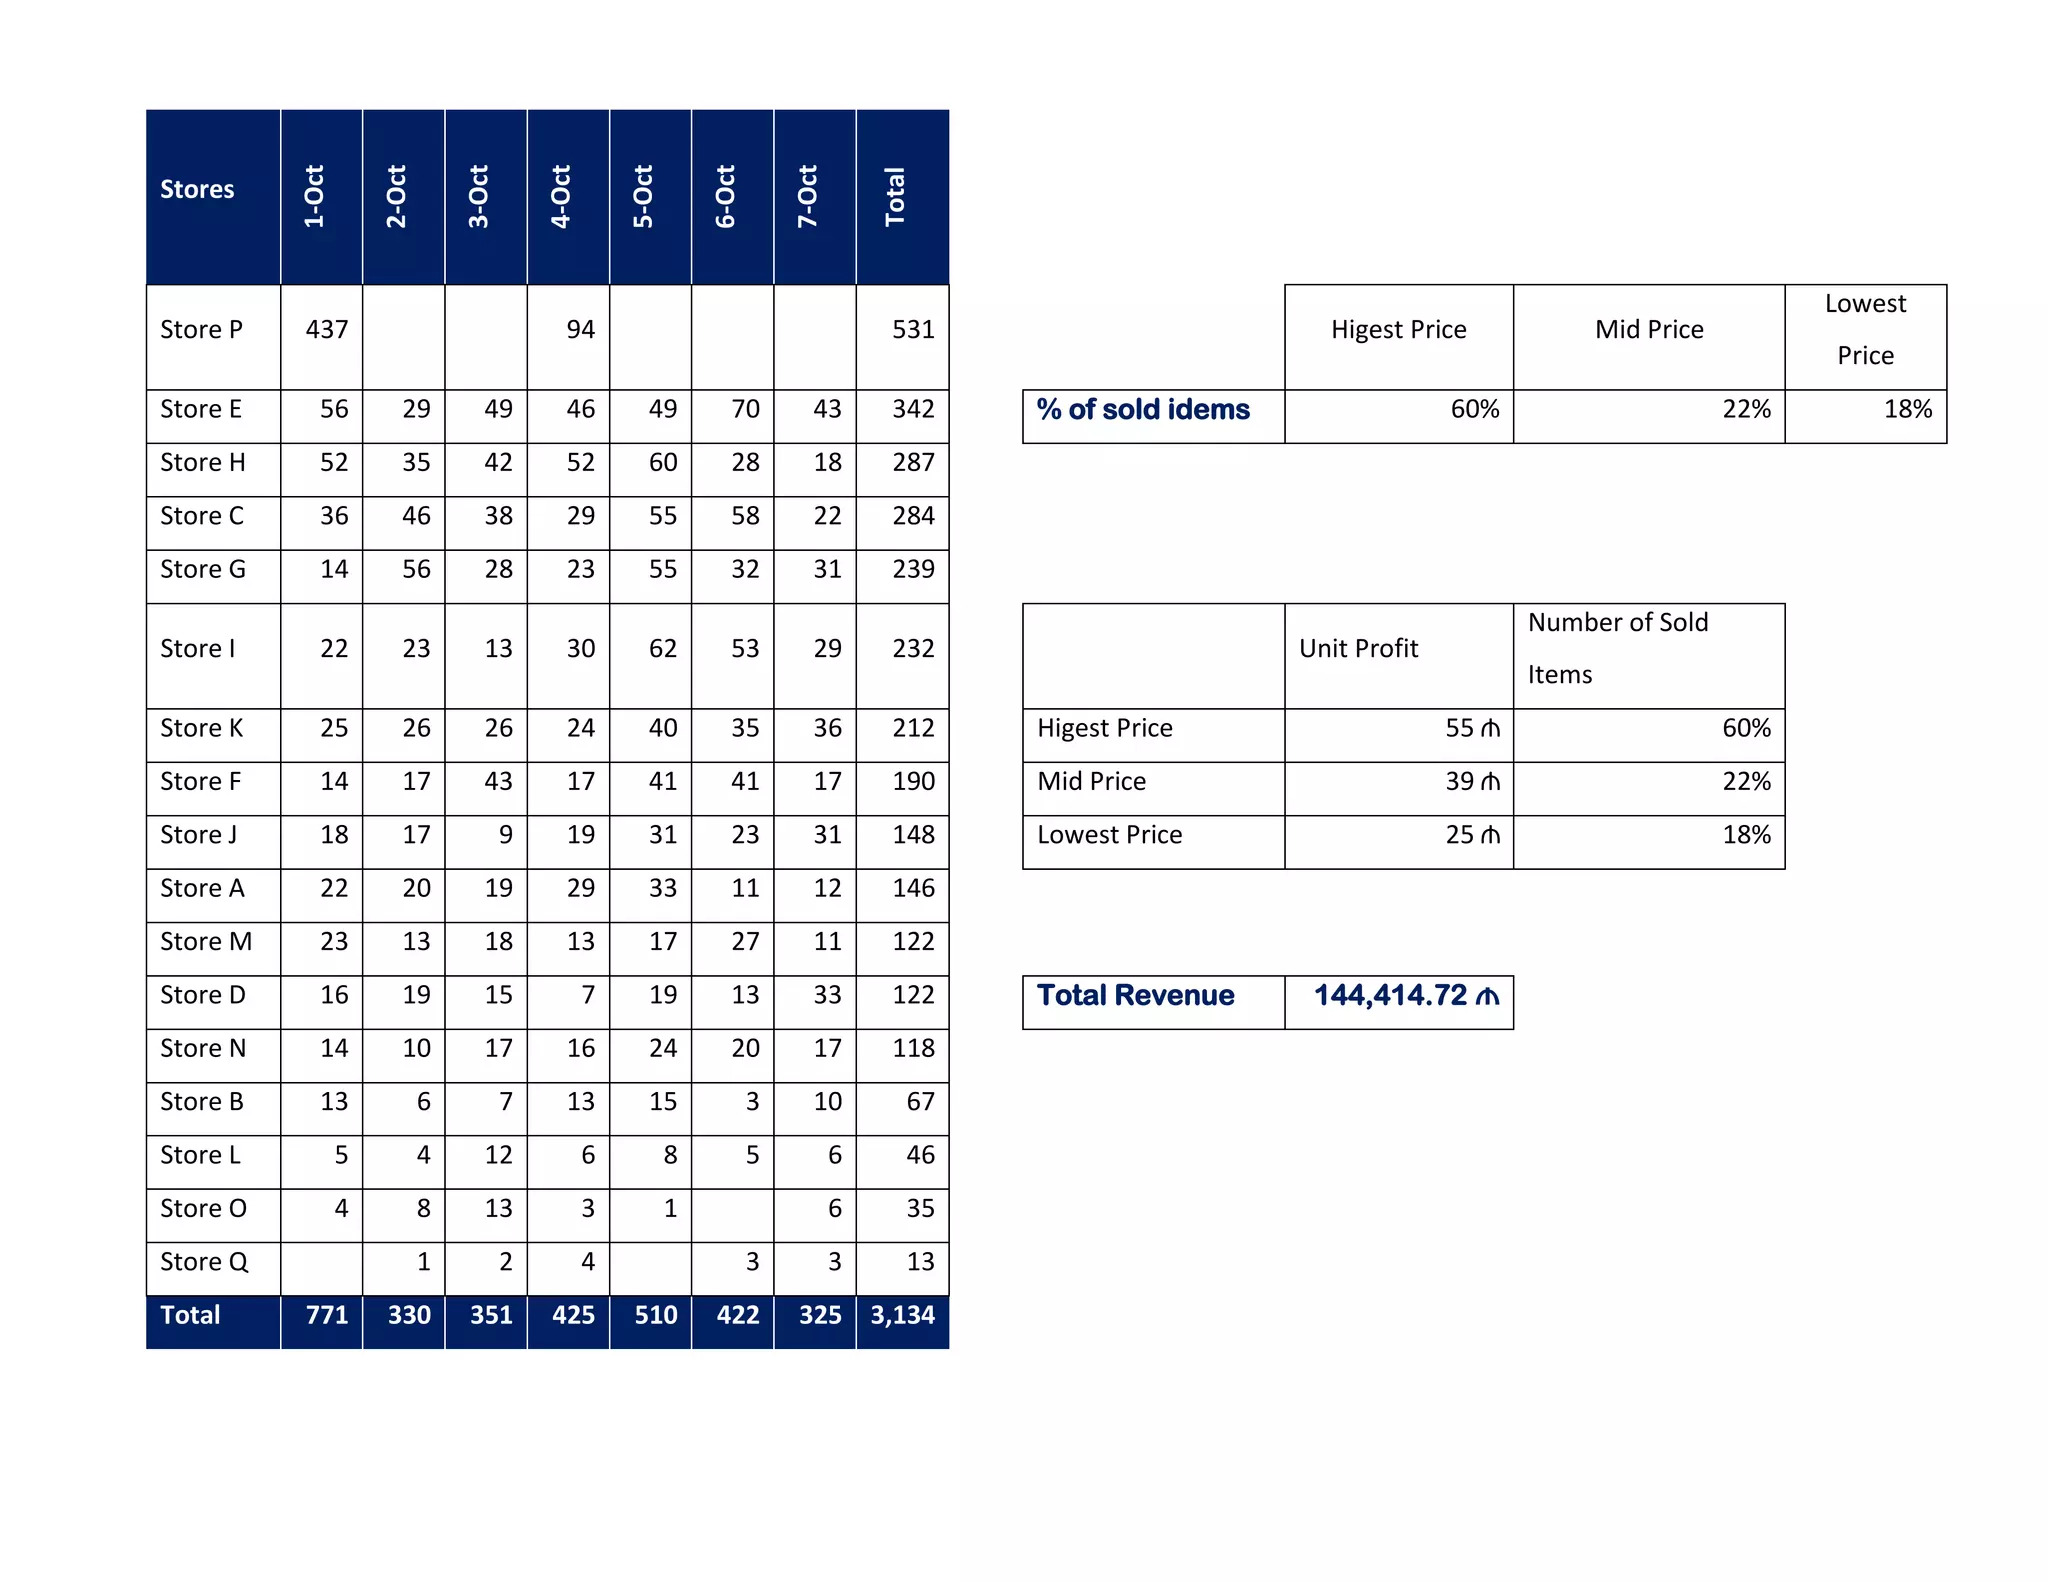
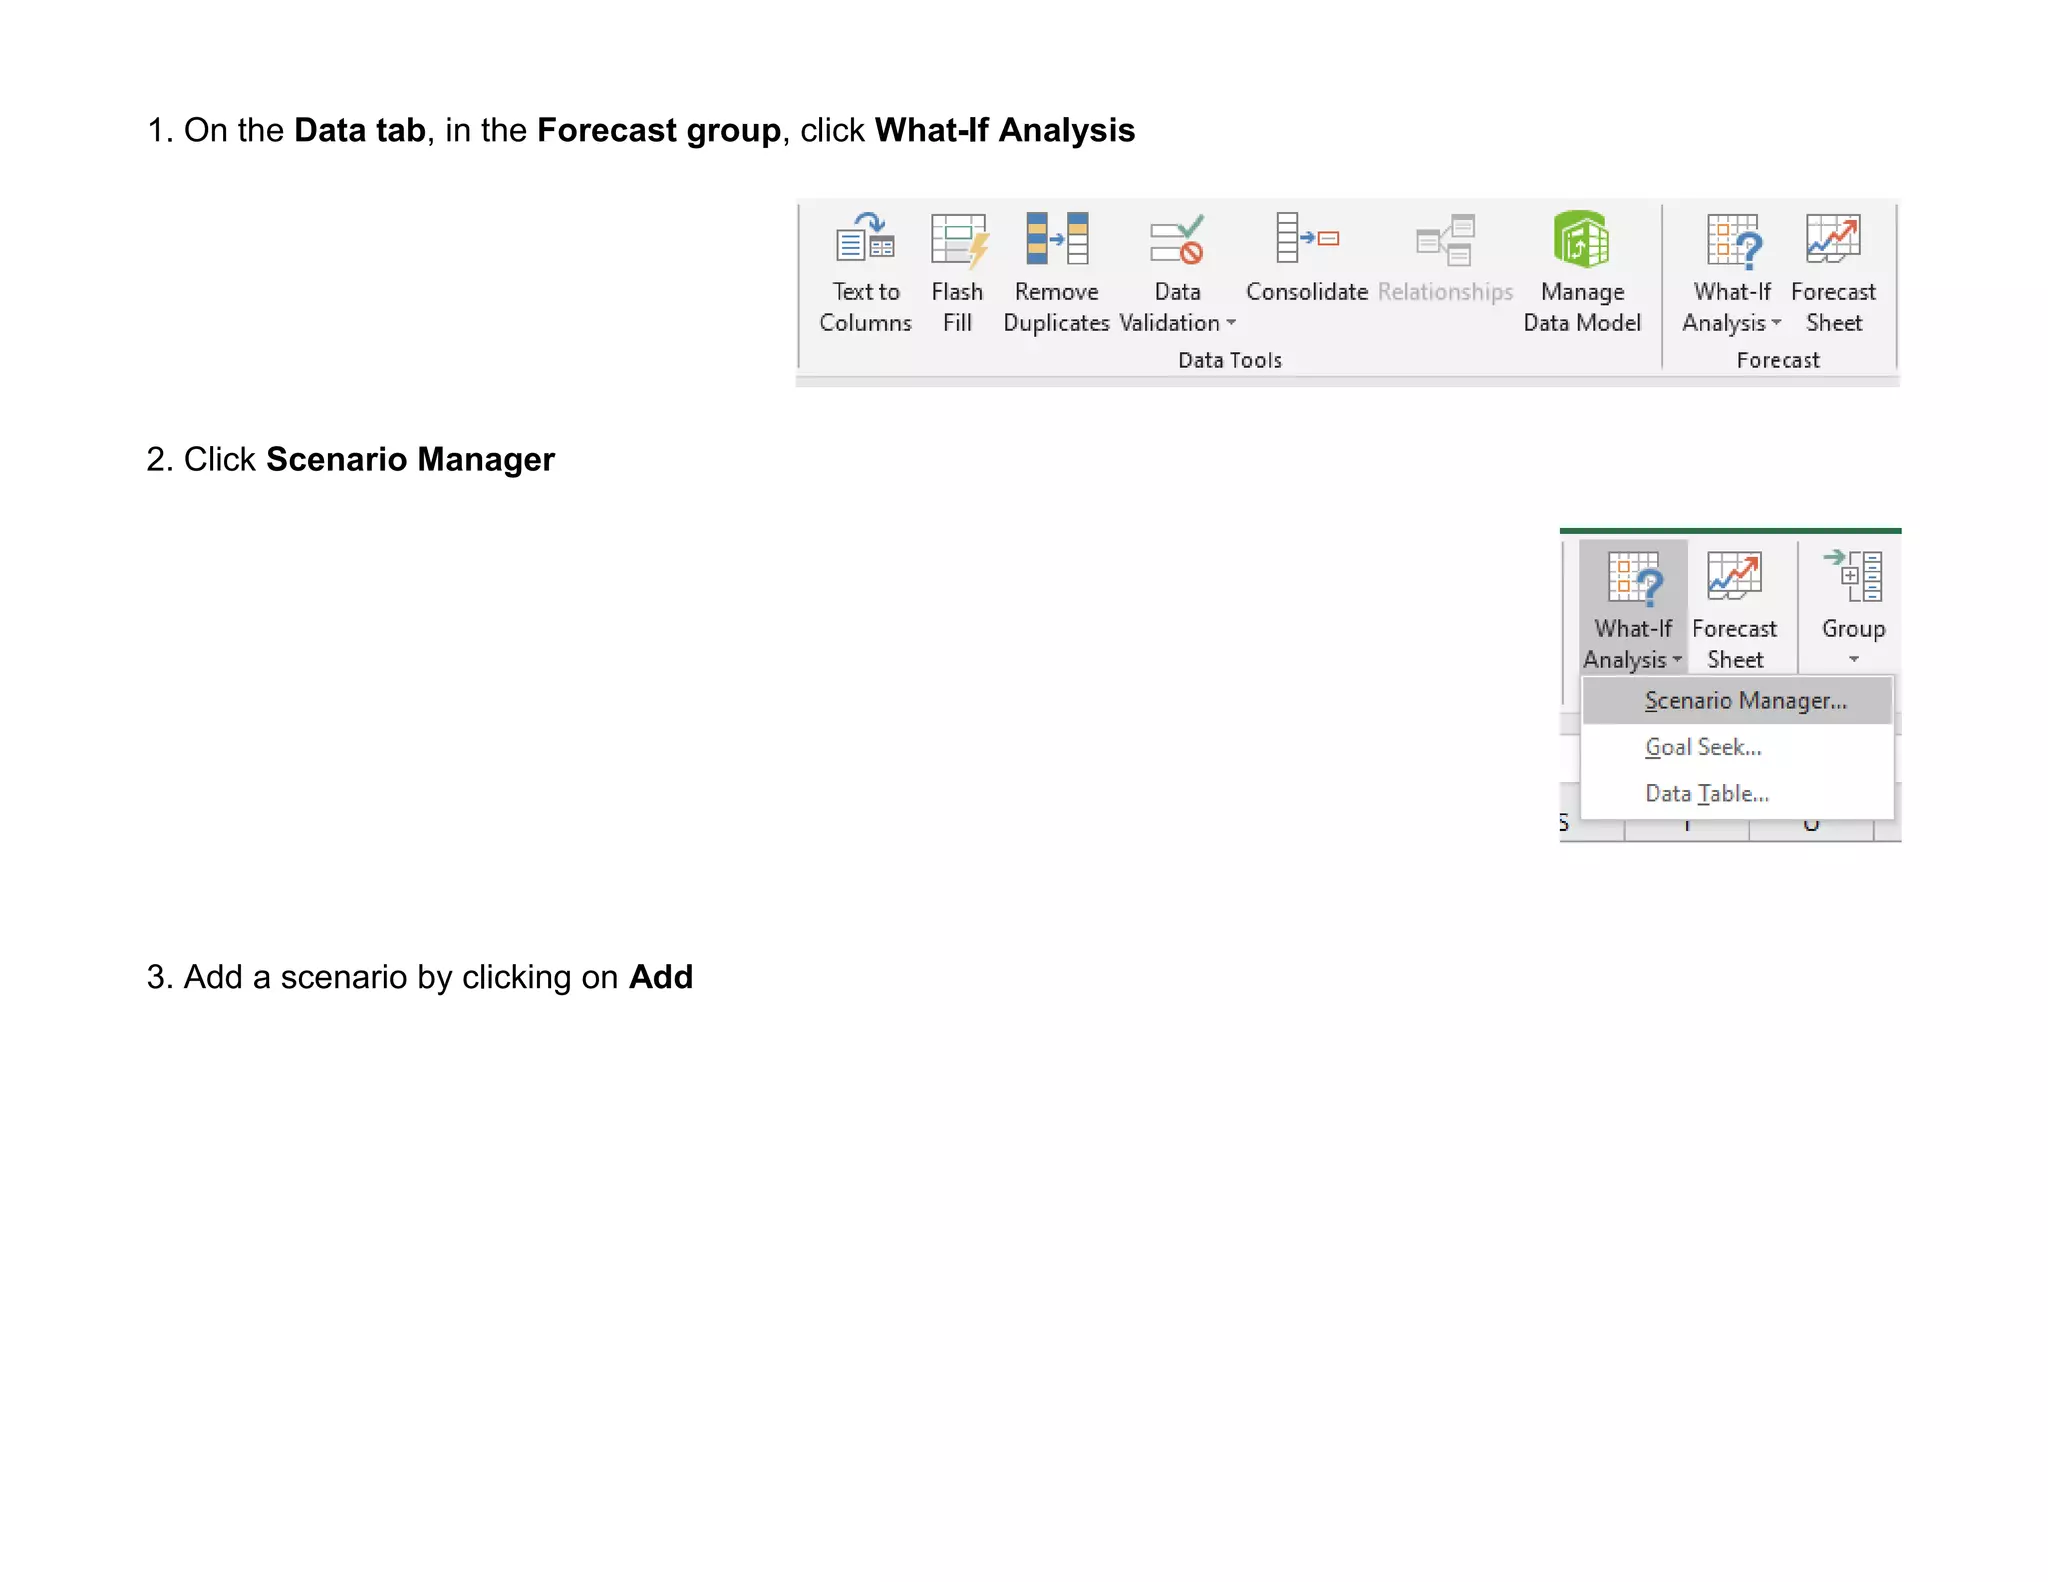
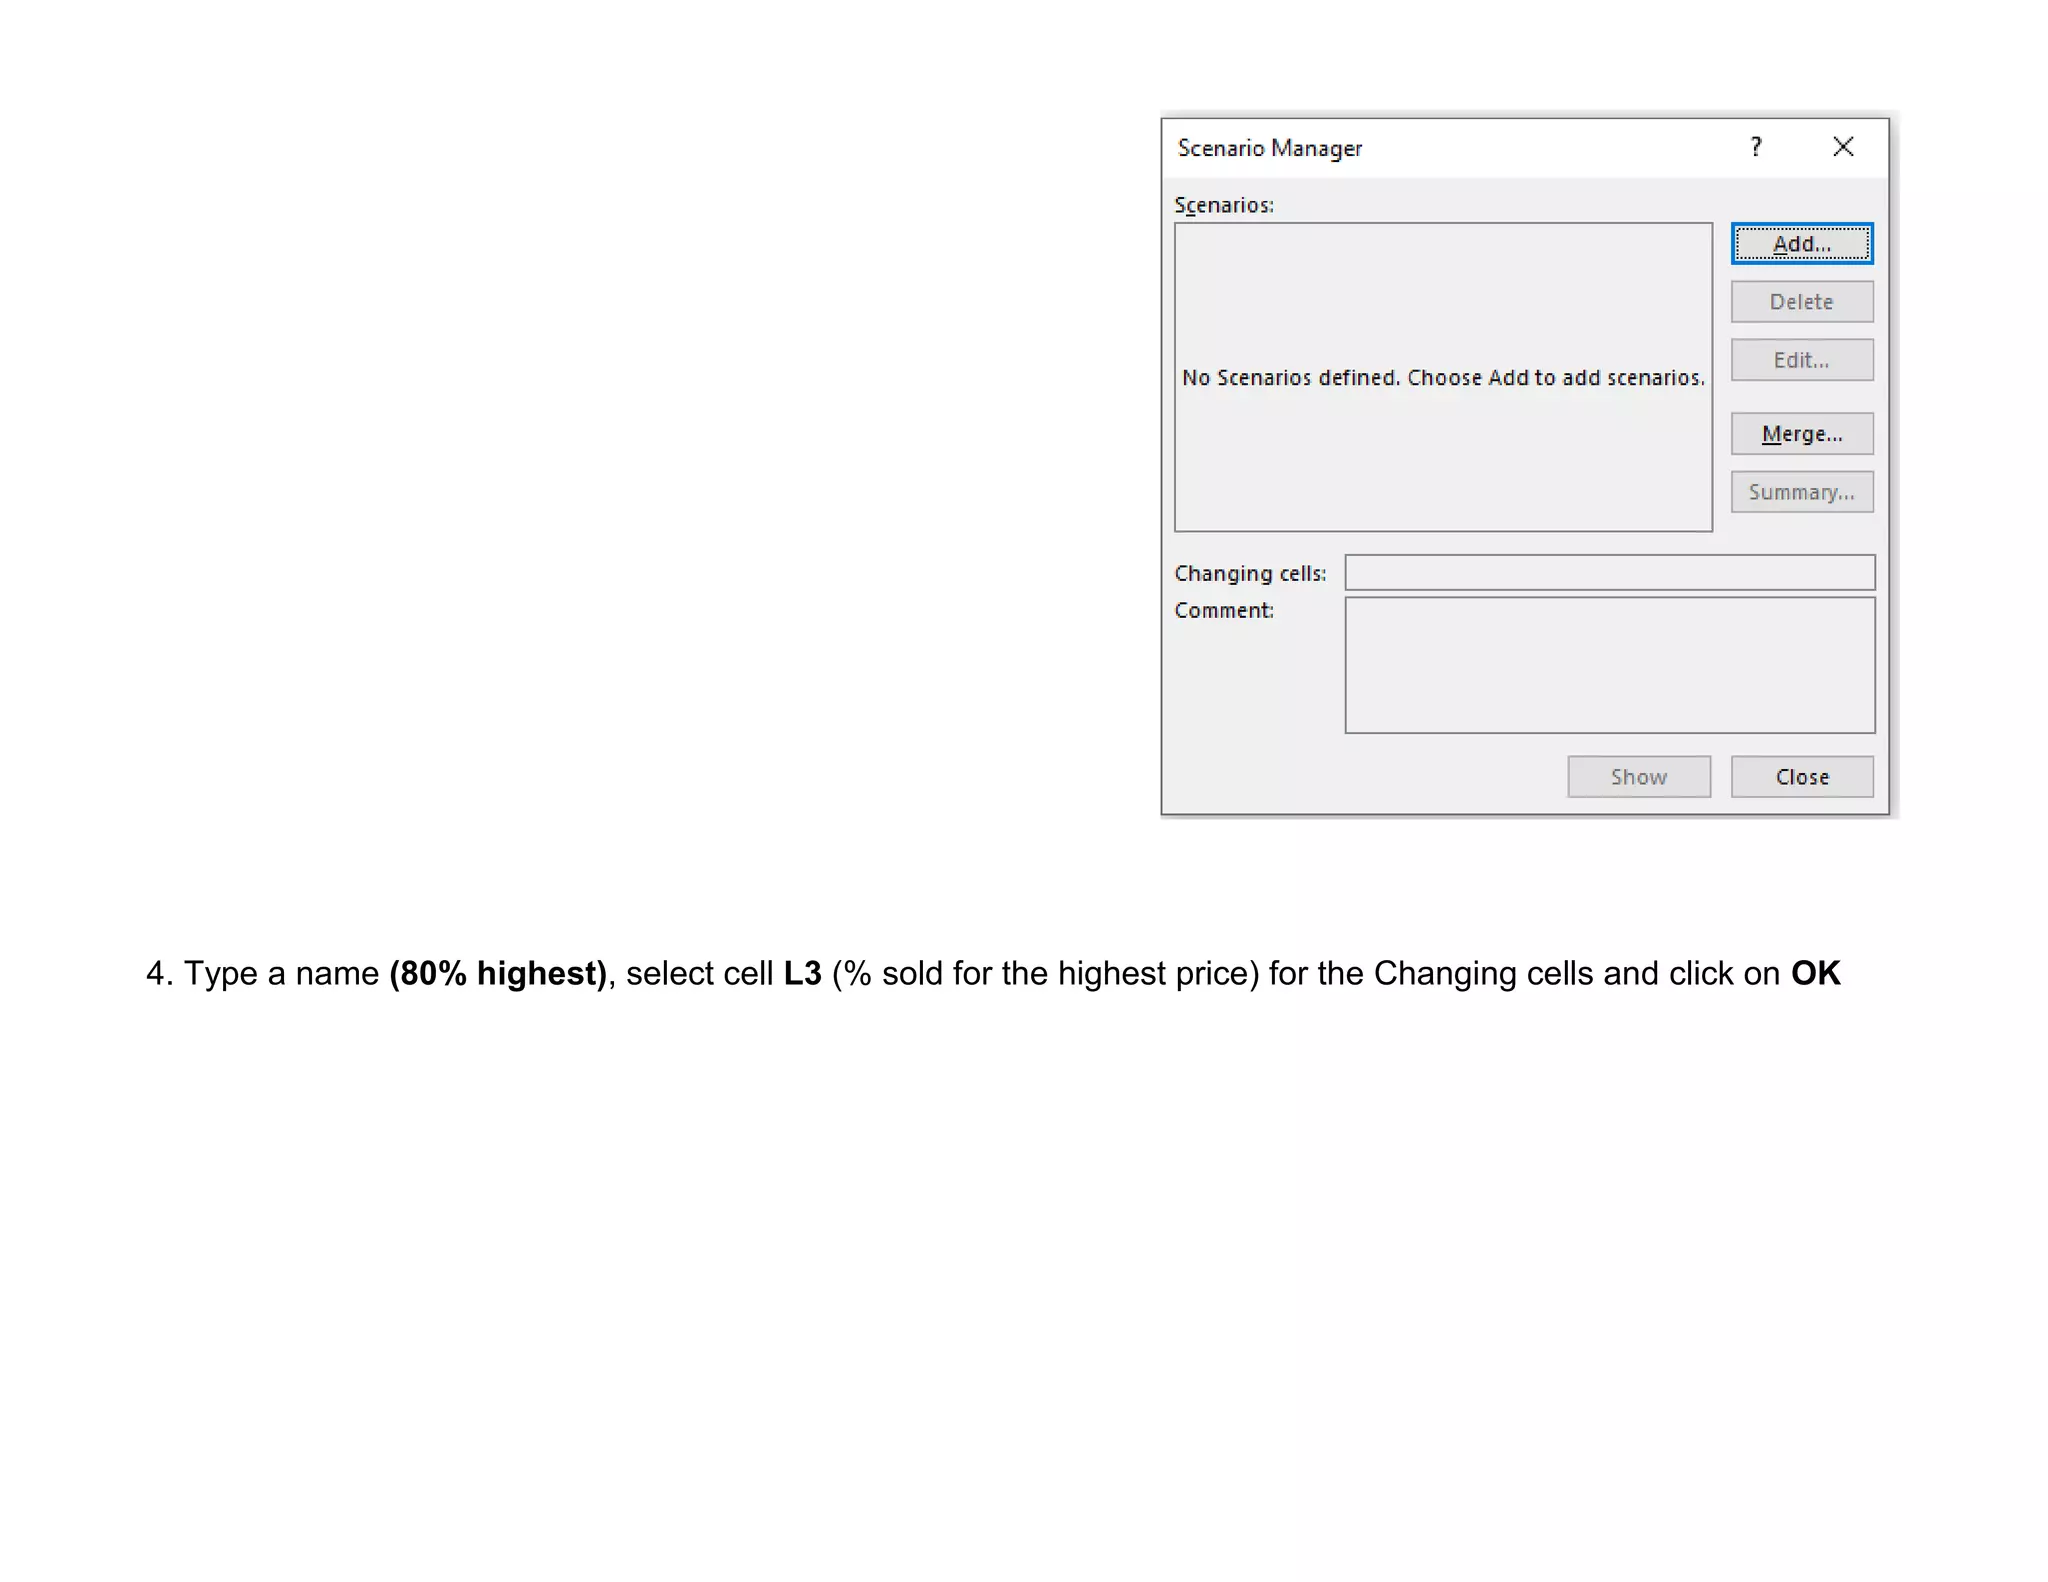
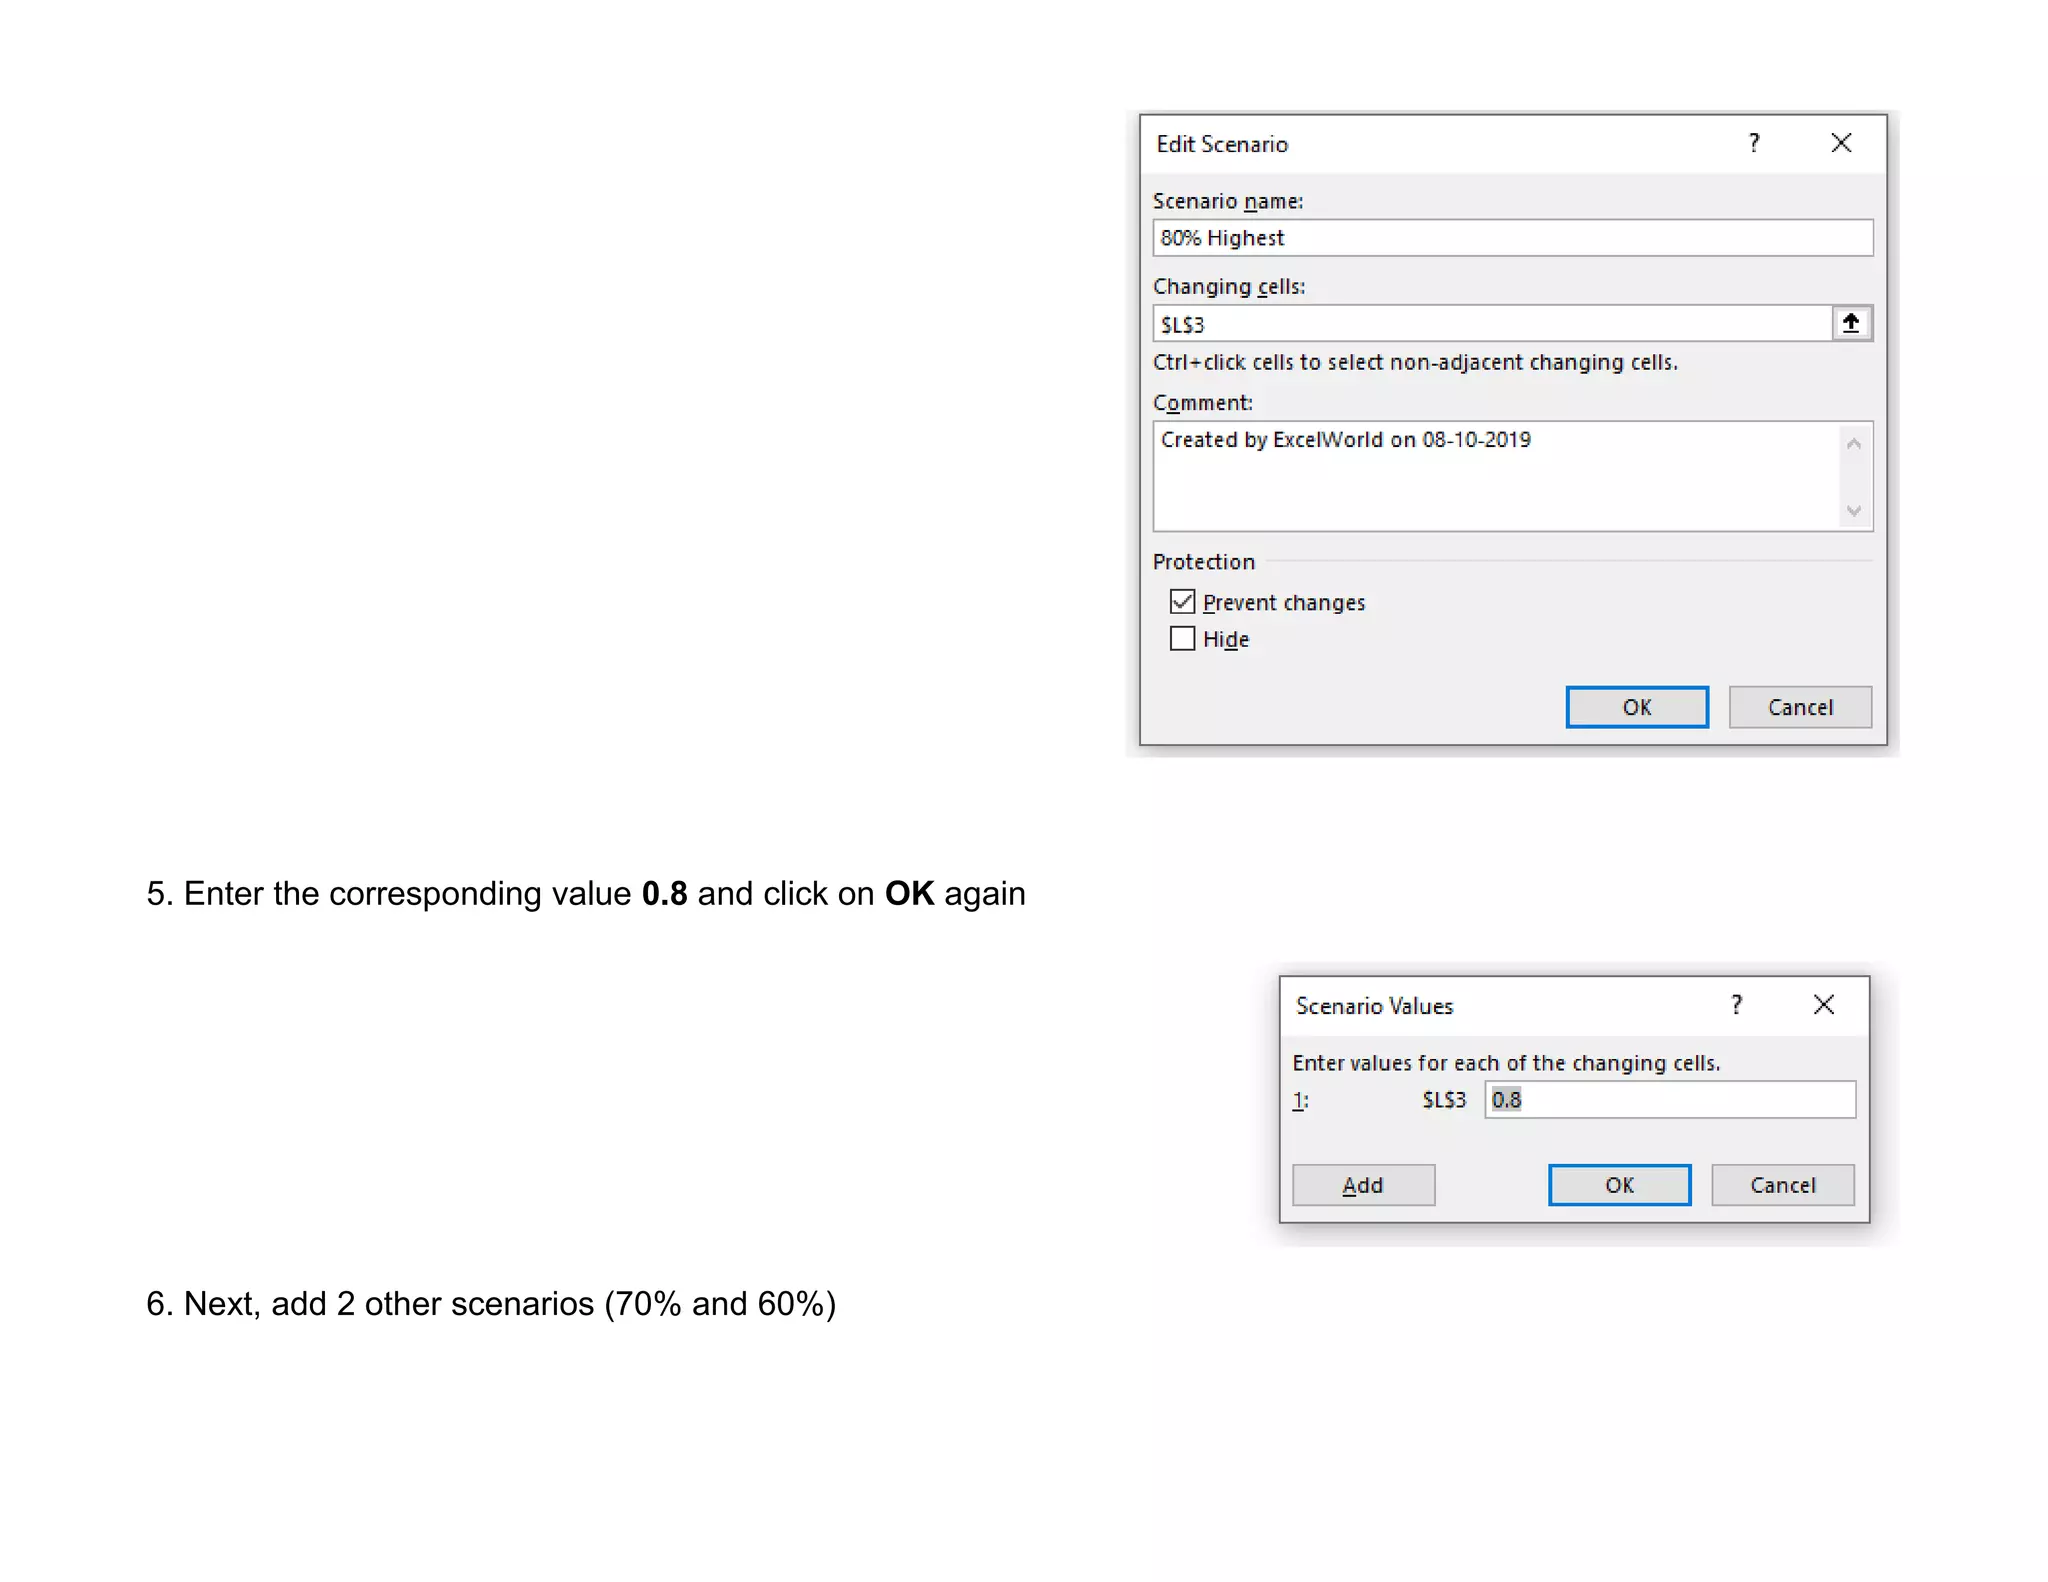

Data analysis involves using tools and techniques to organize and interpret information for various purposes, including making predictions. Microsoft Excel offers several what-if analysis tools like scenarios, goal seek, solver, and data tables, allowing users to evaluate how changes in data affect outcomes. The document provides an example of using scenarios in Excel to predict potential total revenues based on different sales percentages at various price points.