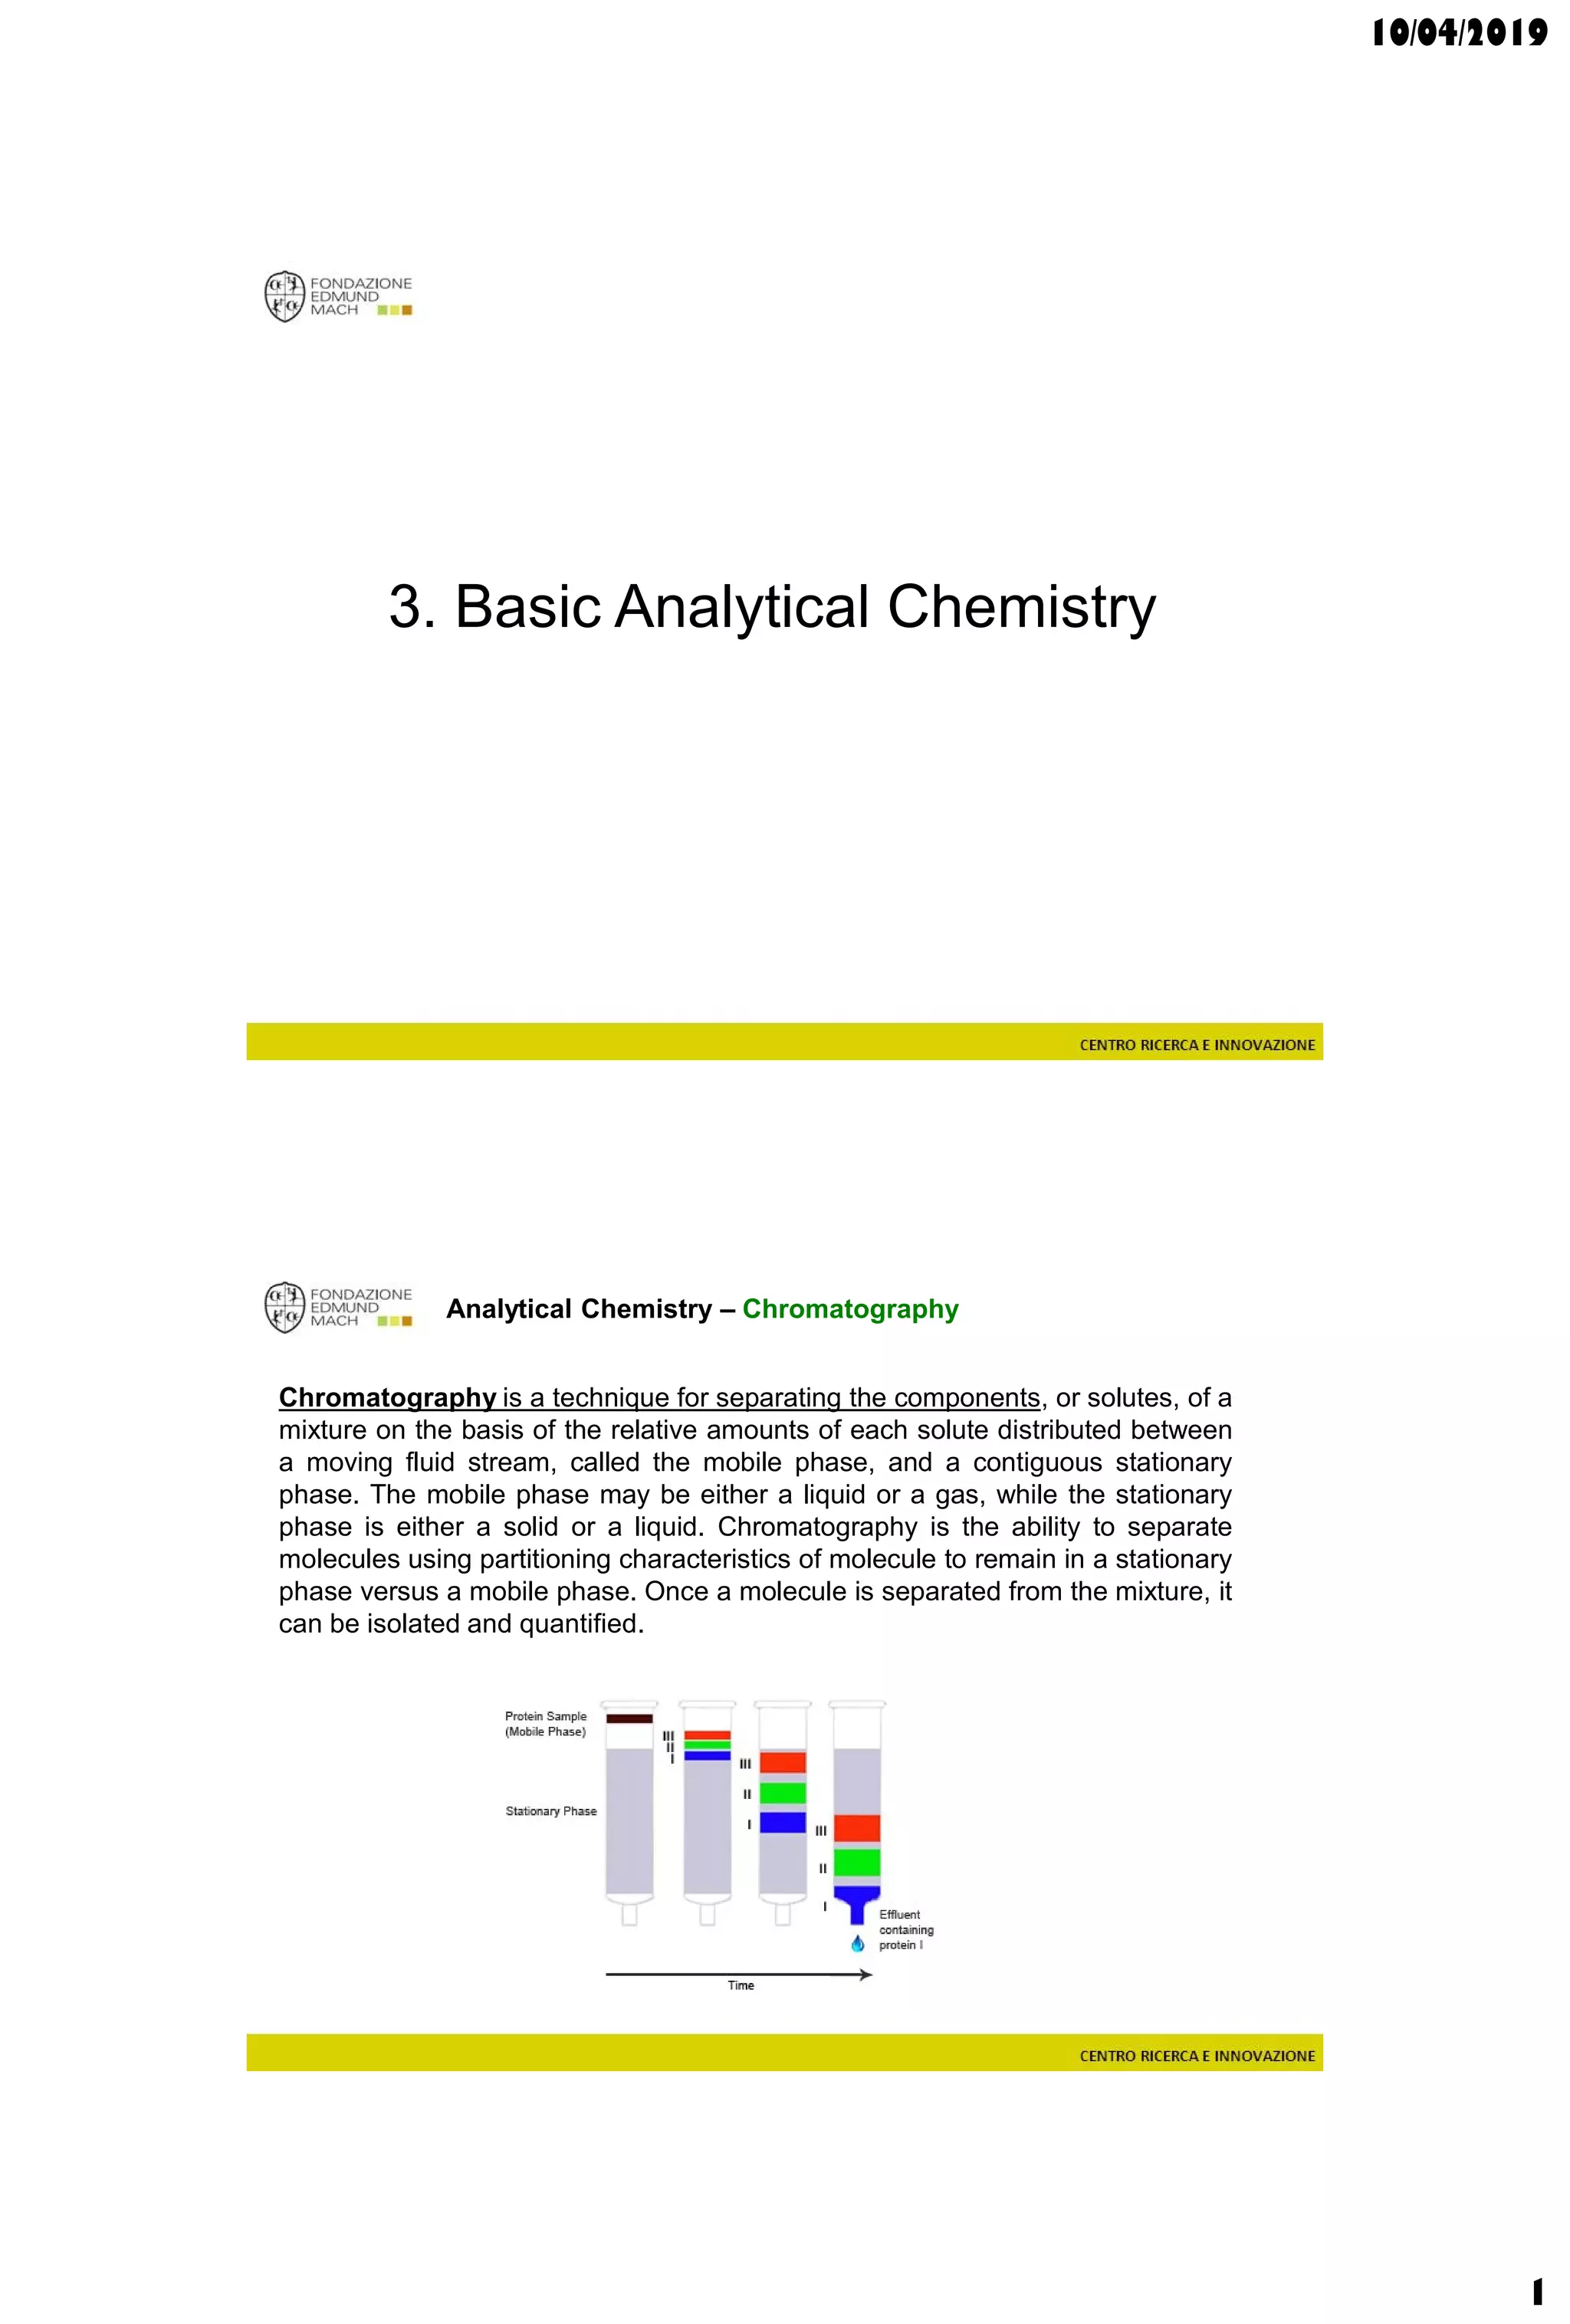
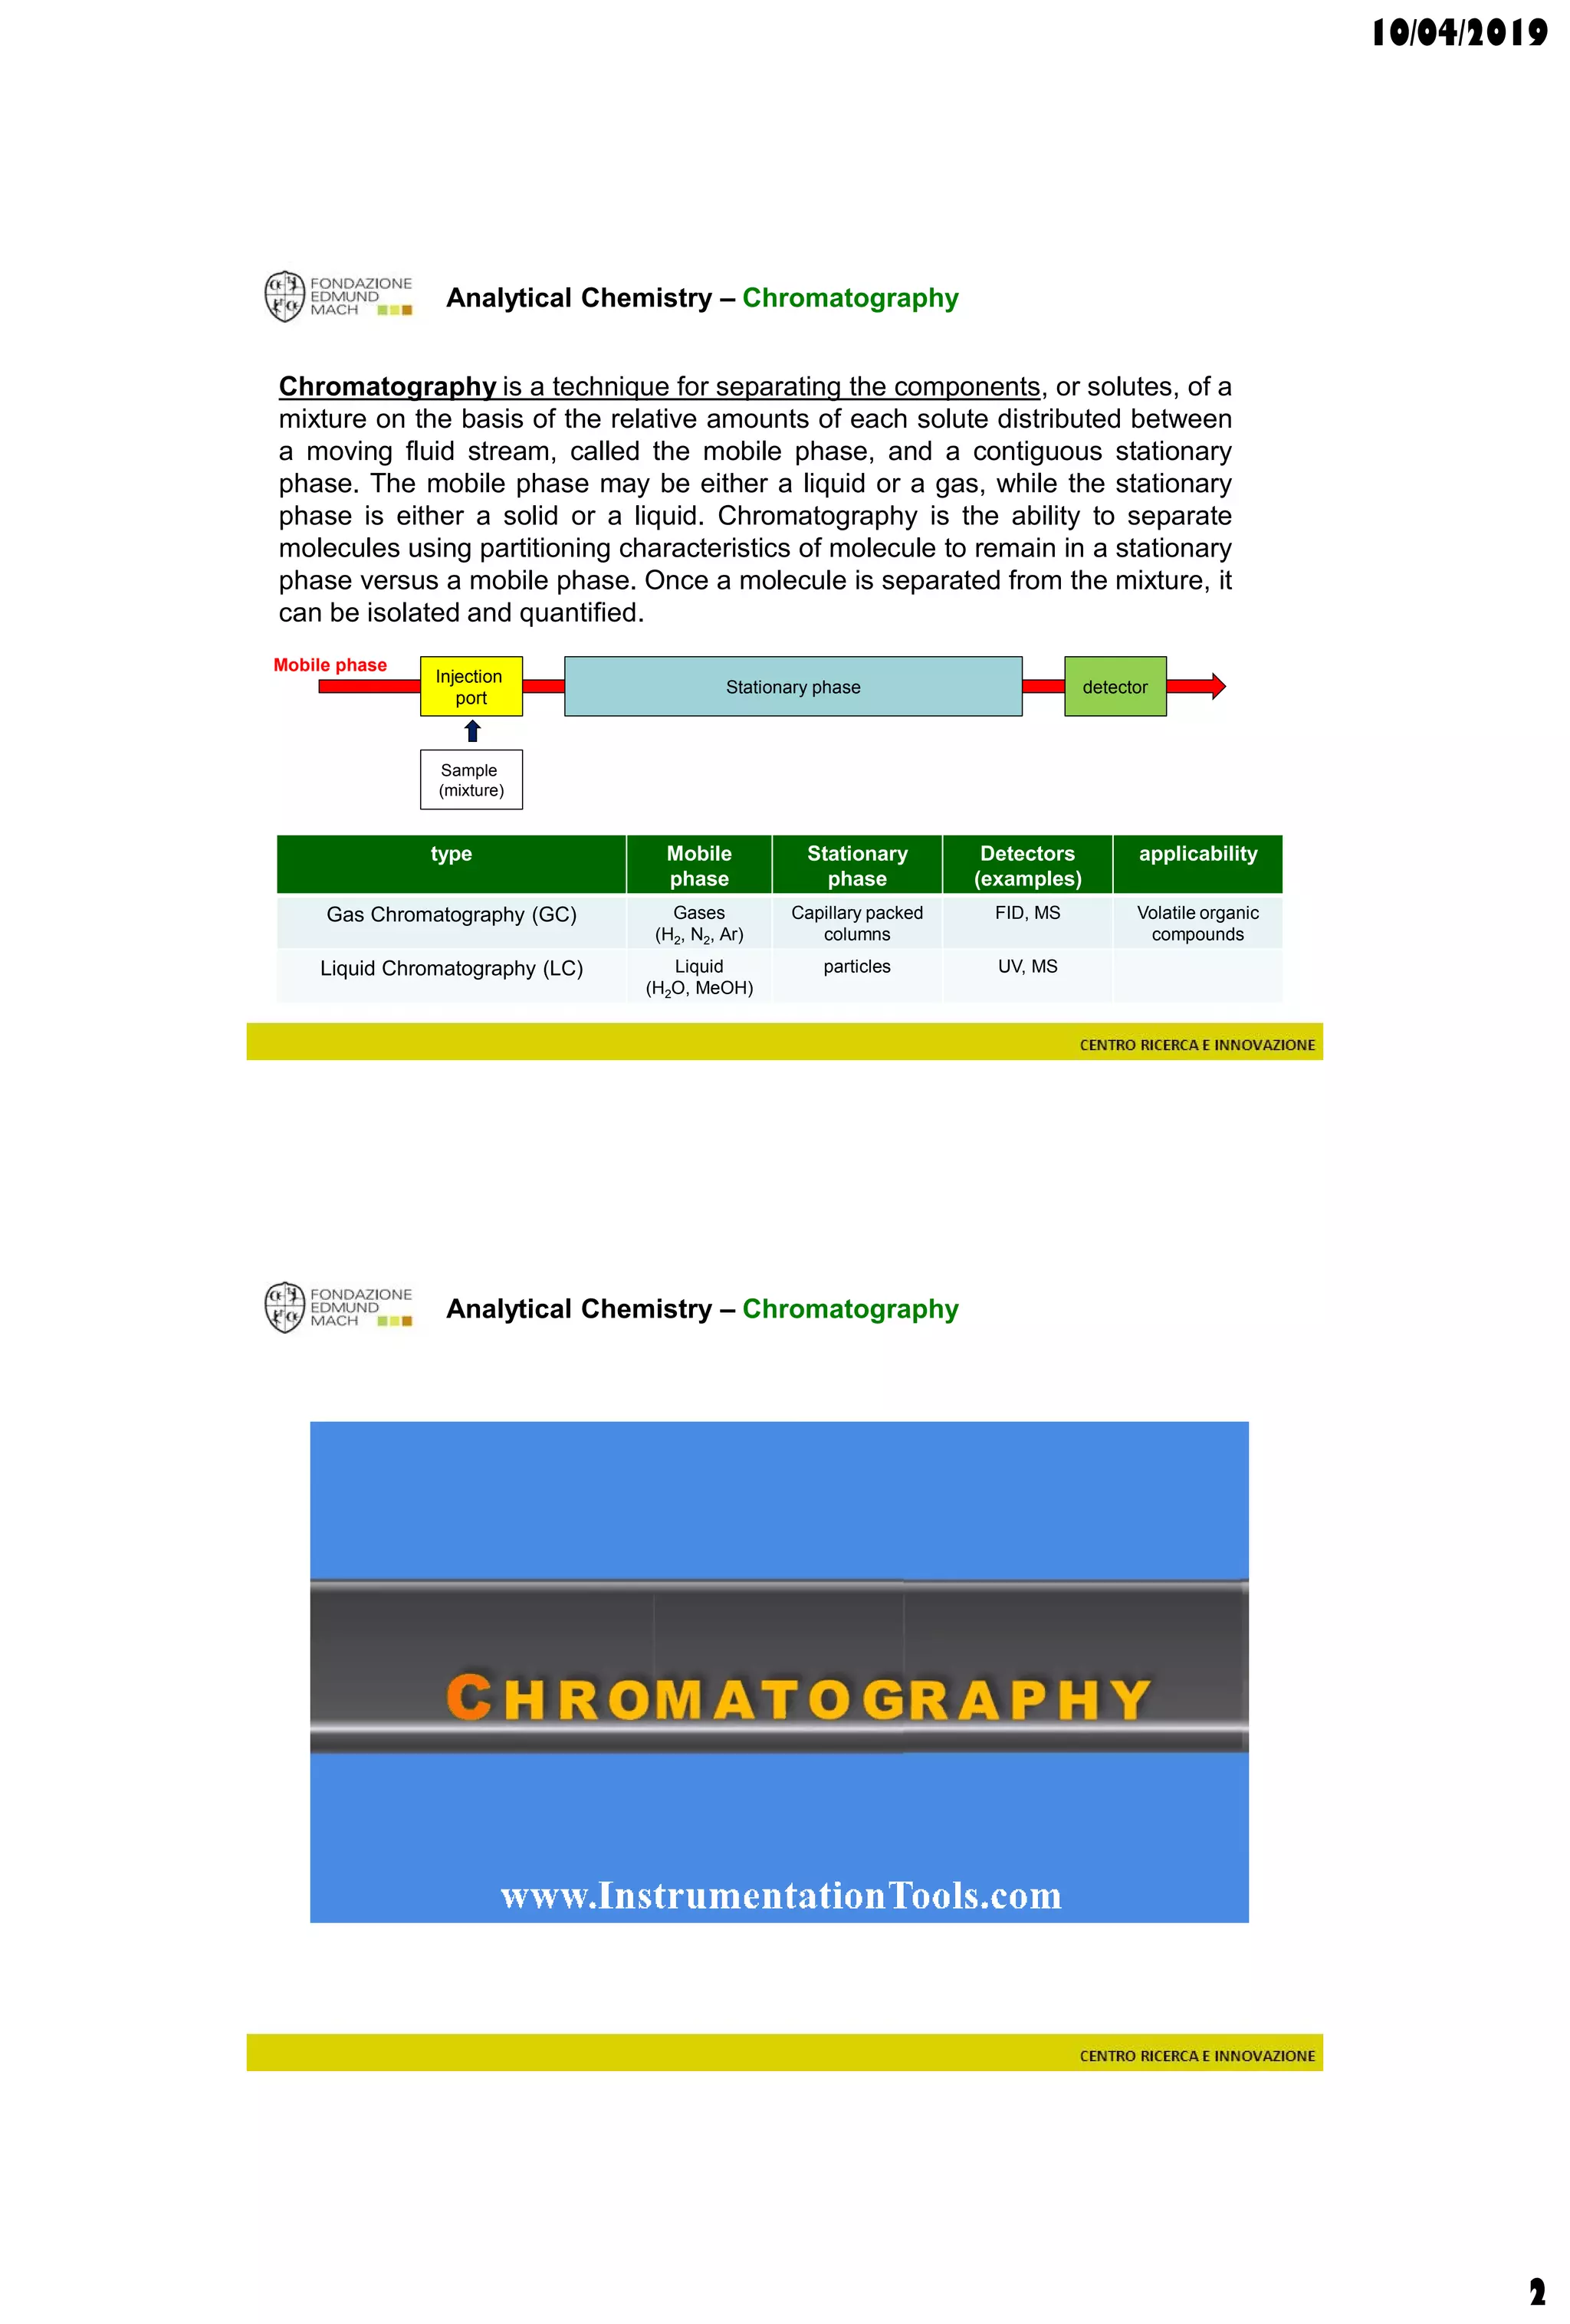
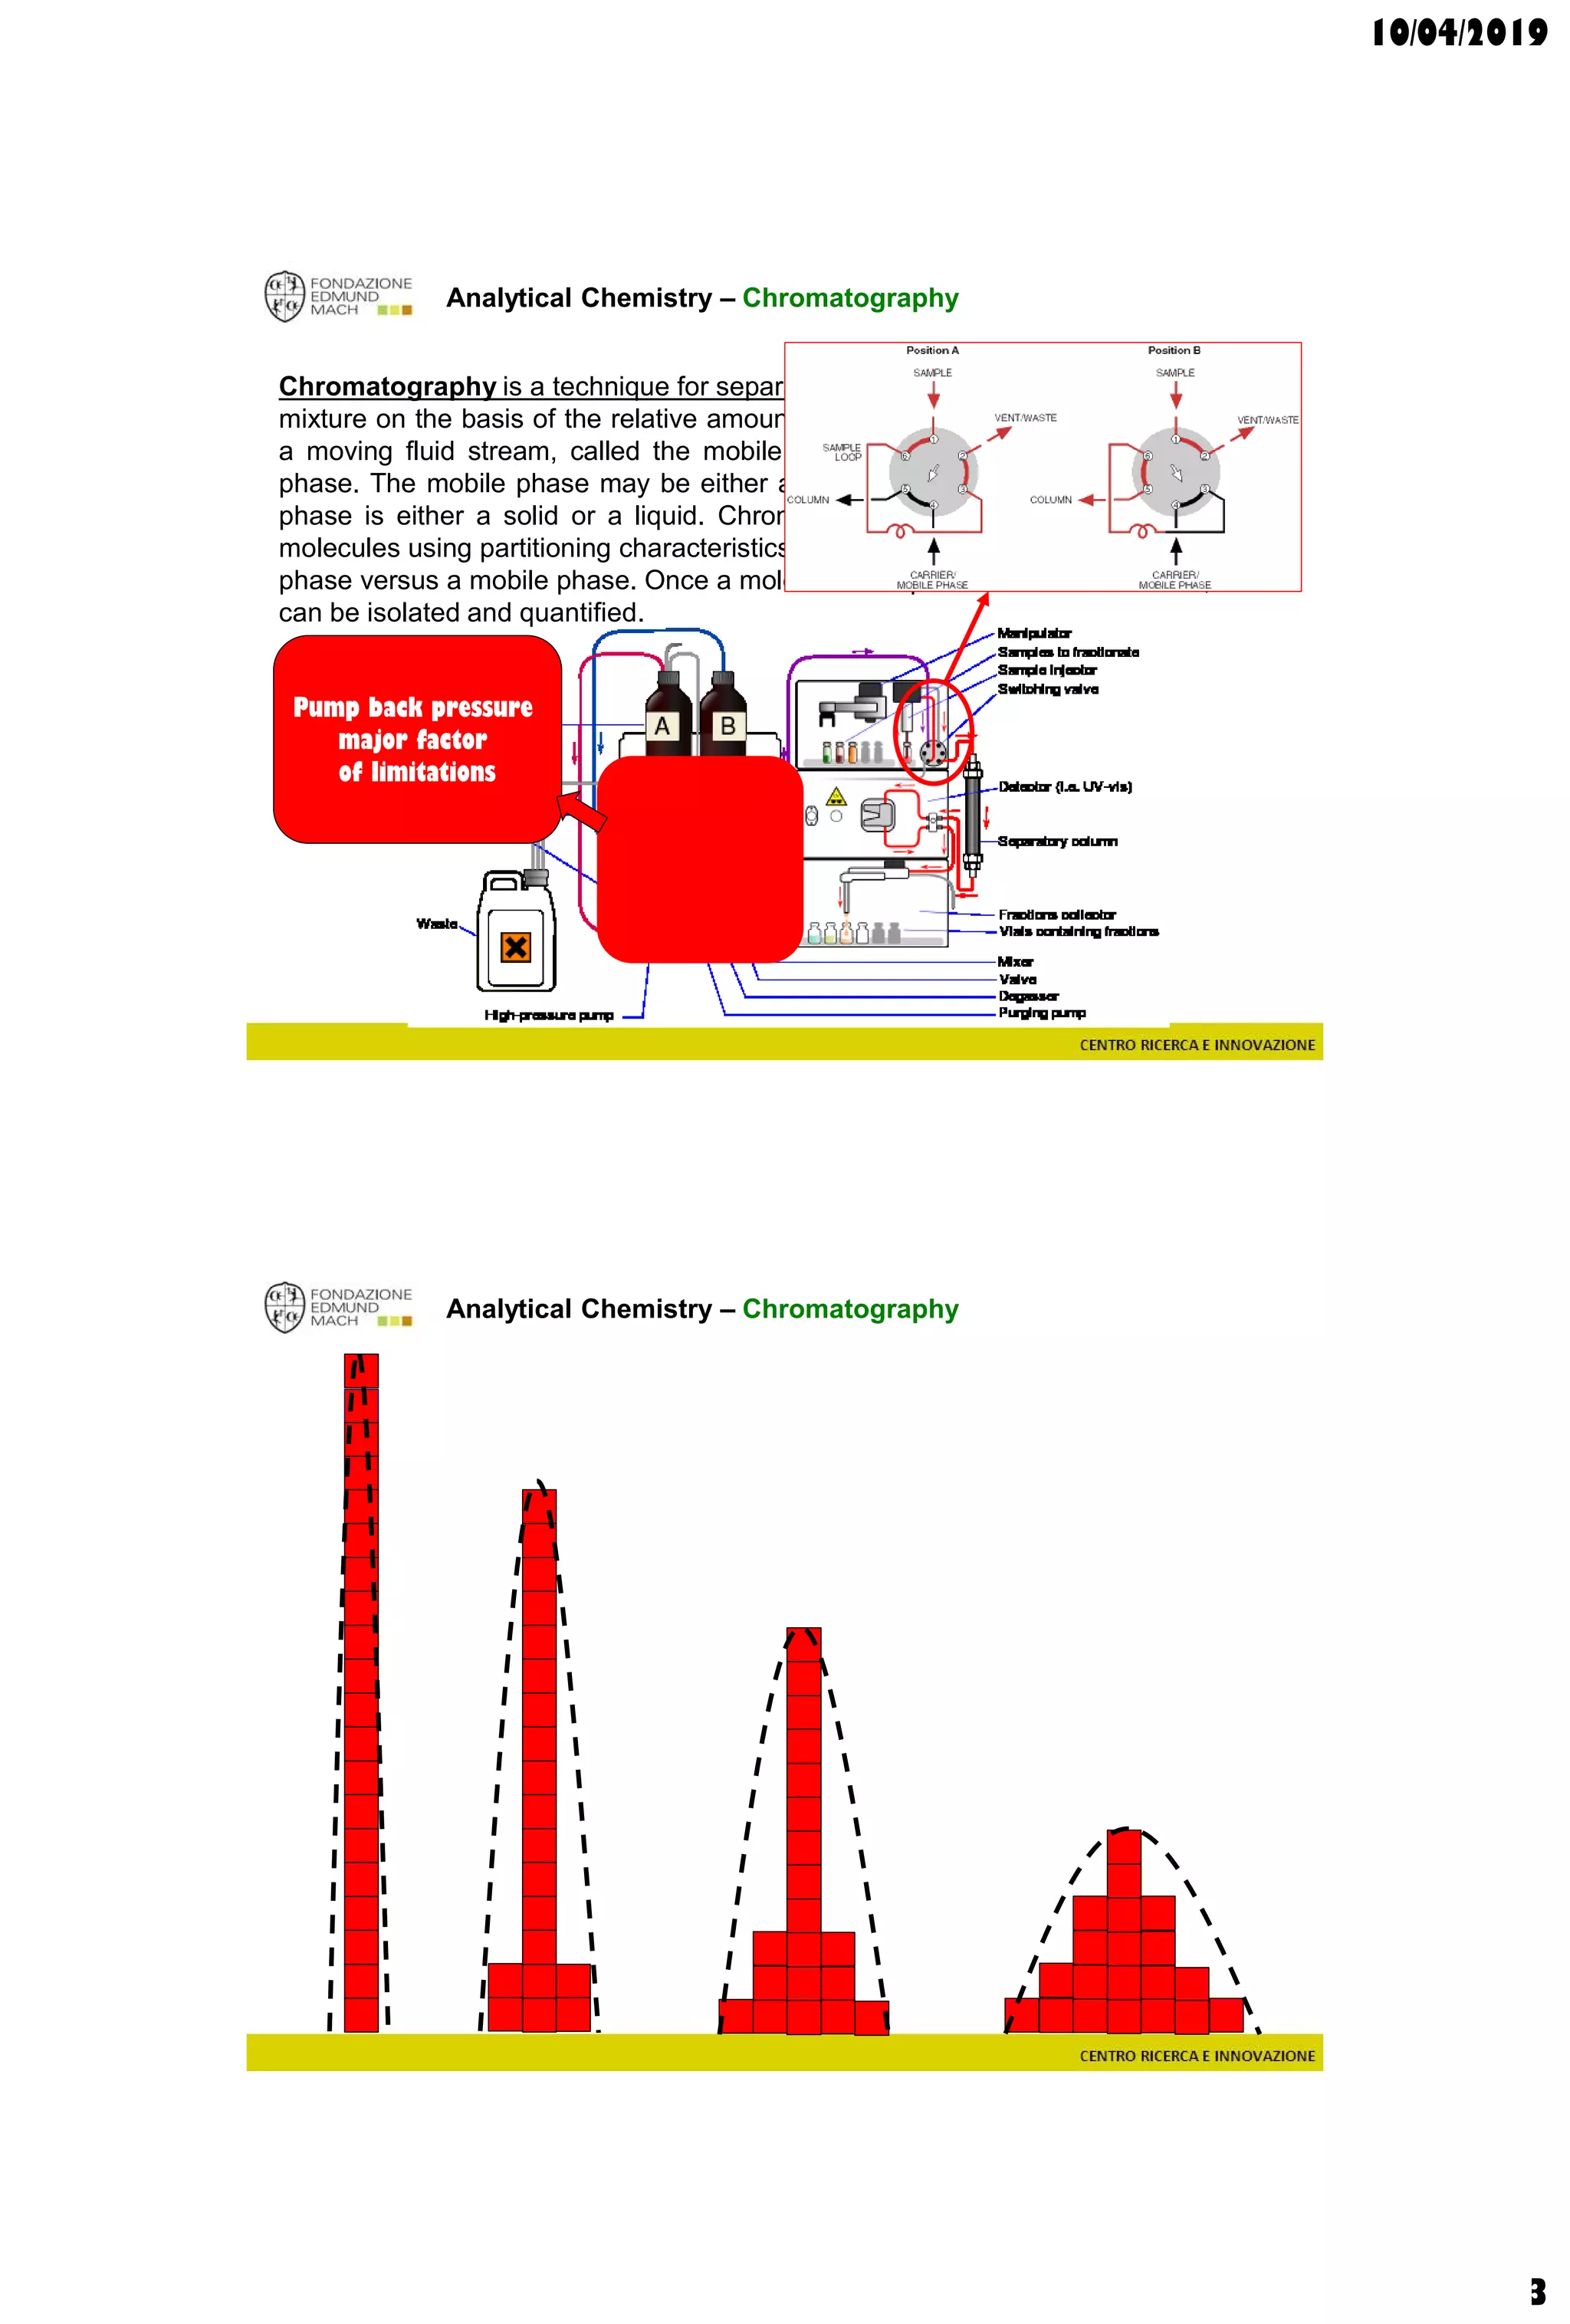
The document discusses analytical chemistry, focusing on chromatography as a technique for separating mixture components based on their distribution between a mobile phase and a stationary phase. It outlines various chromatography methods, such as gas and liquid chromatography, alongside factors affecting column efficiency and resolution. Additionally, the document briefly covers mass spectrometry and its applications in analytical chemistry.

![10/04/2019
28
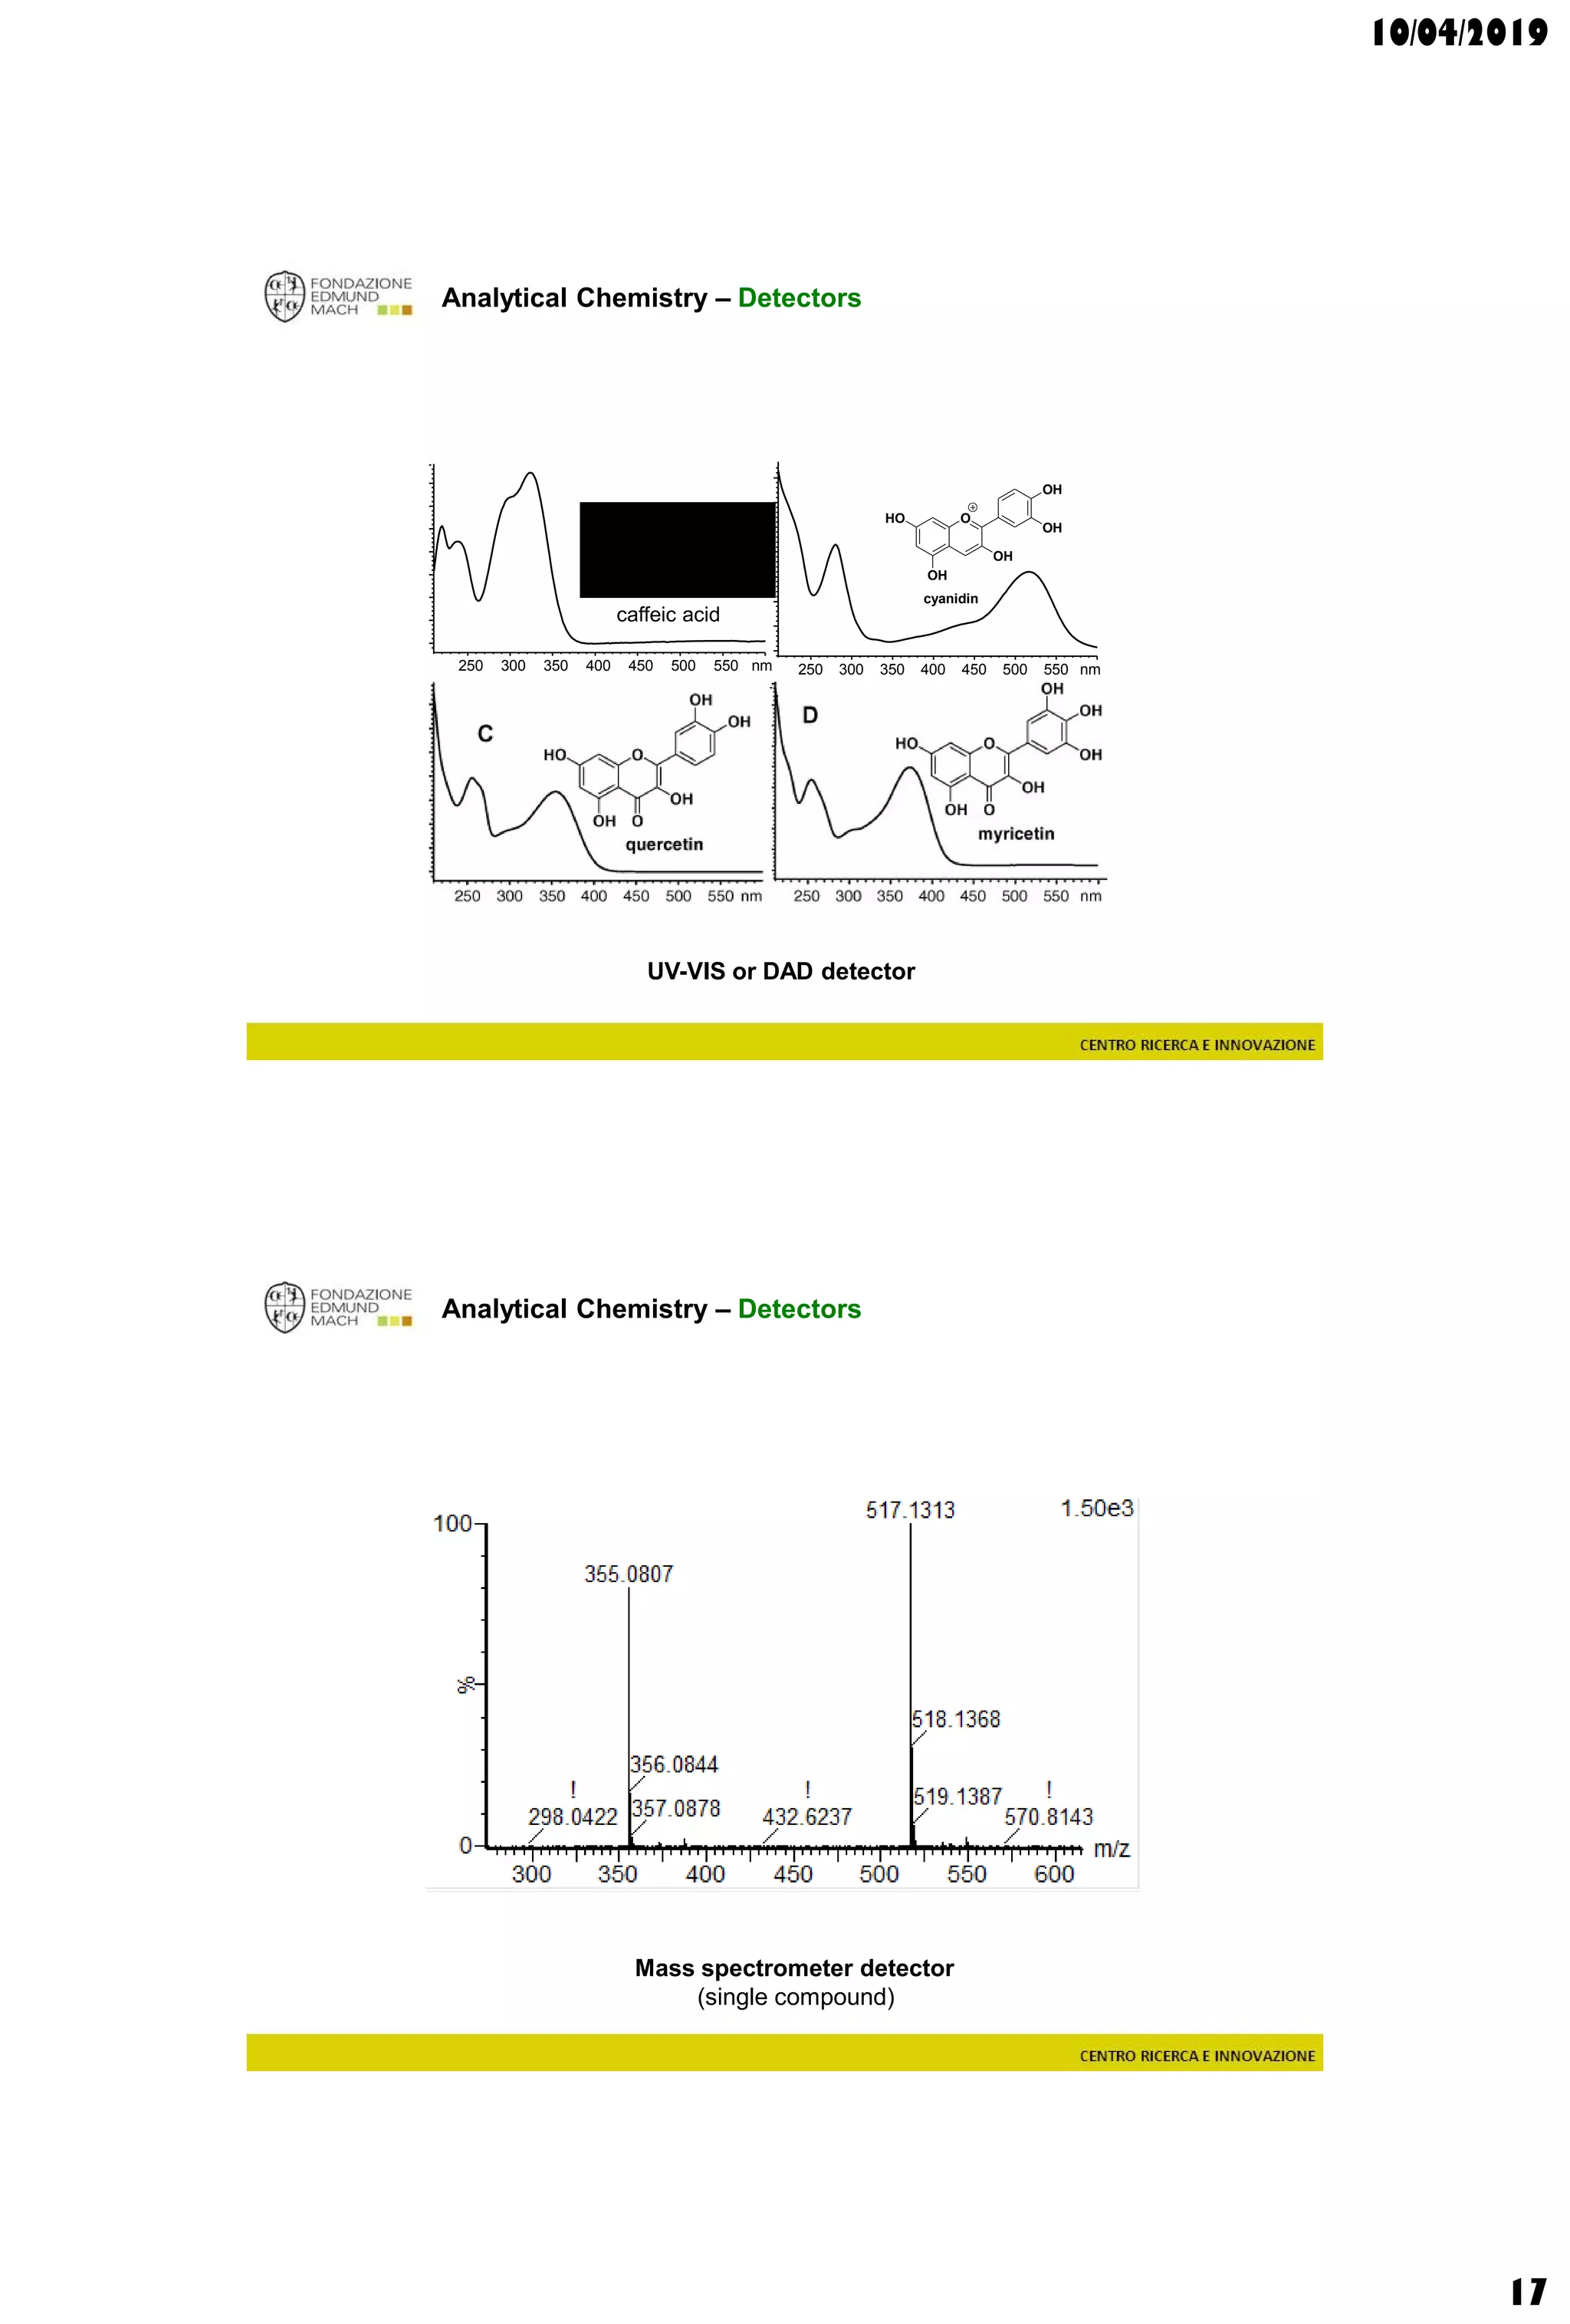
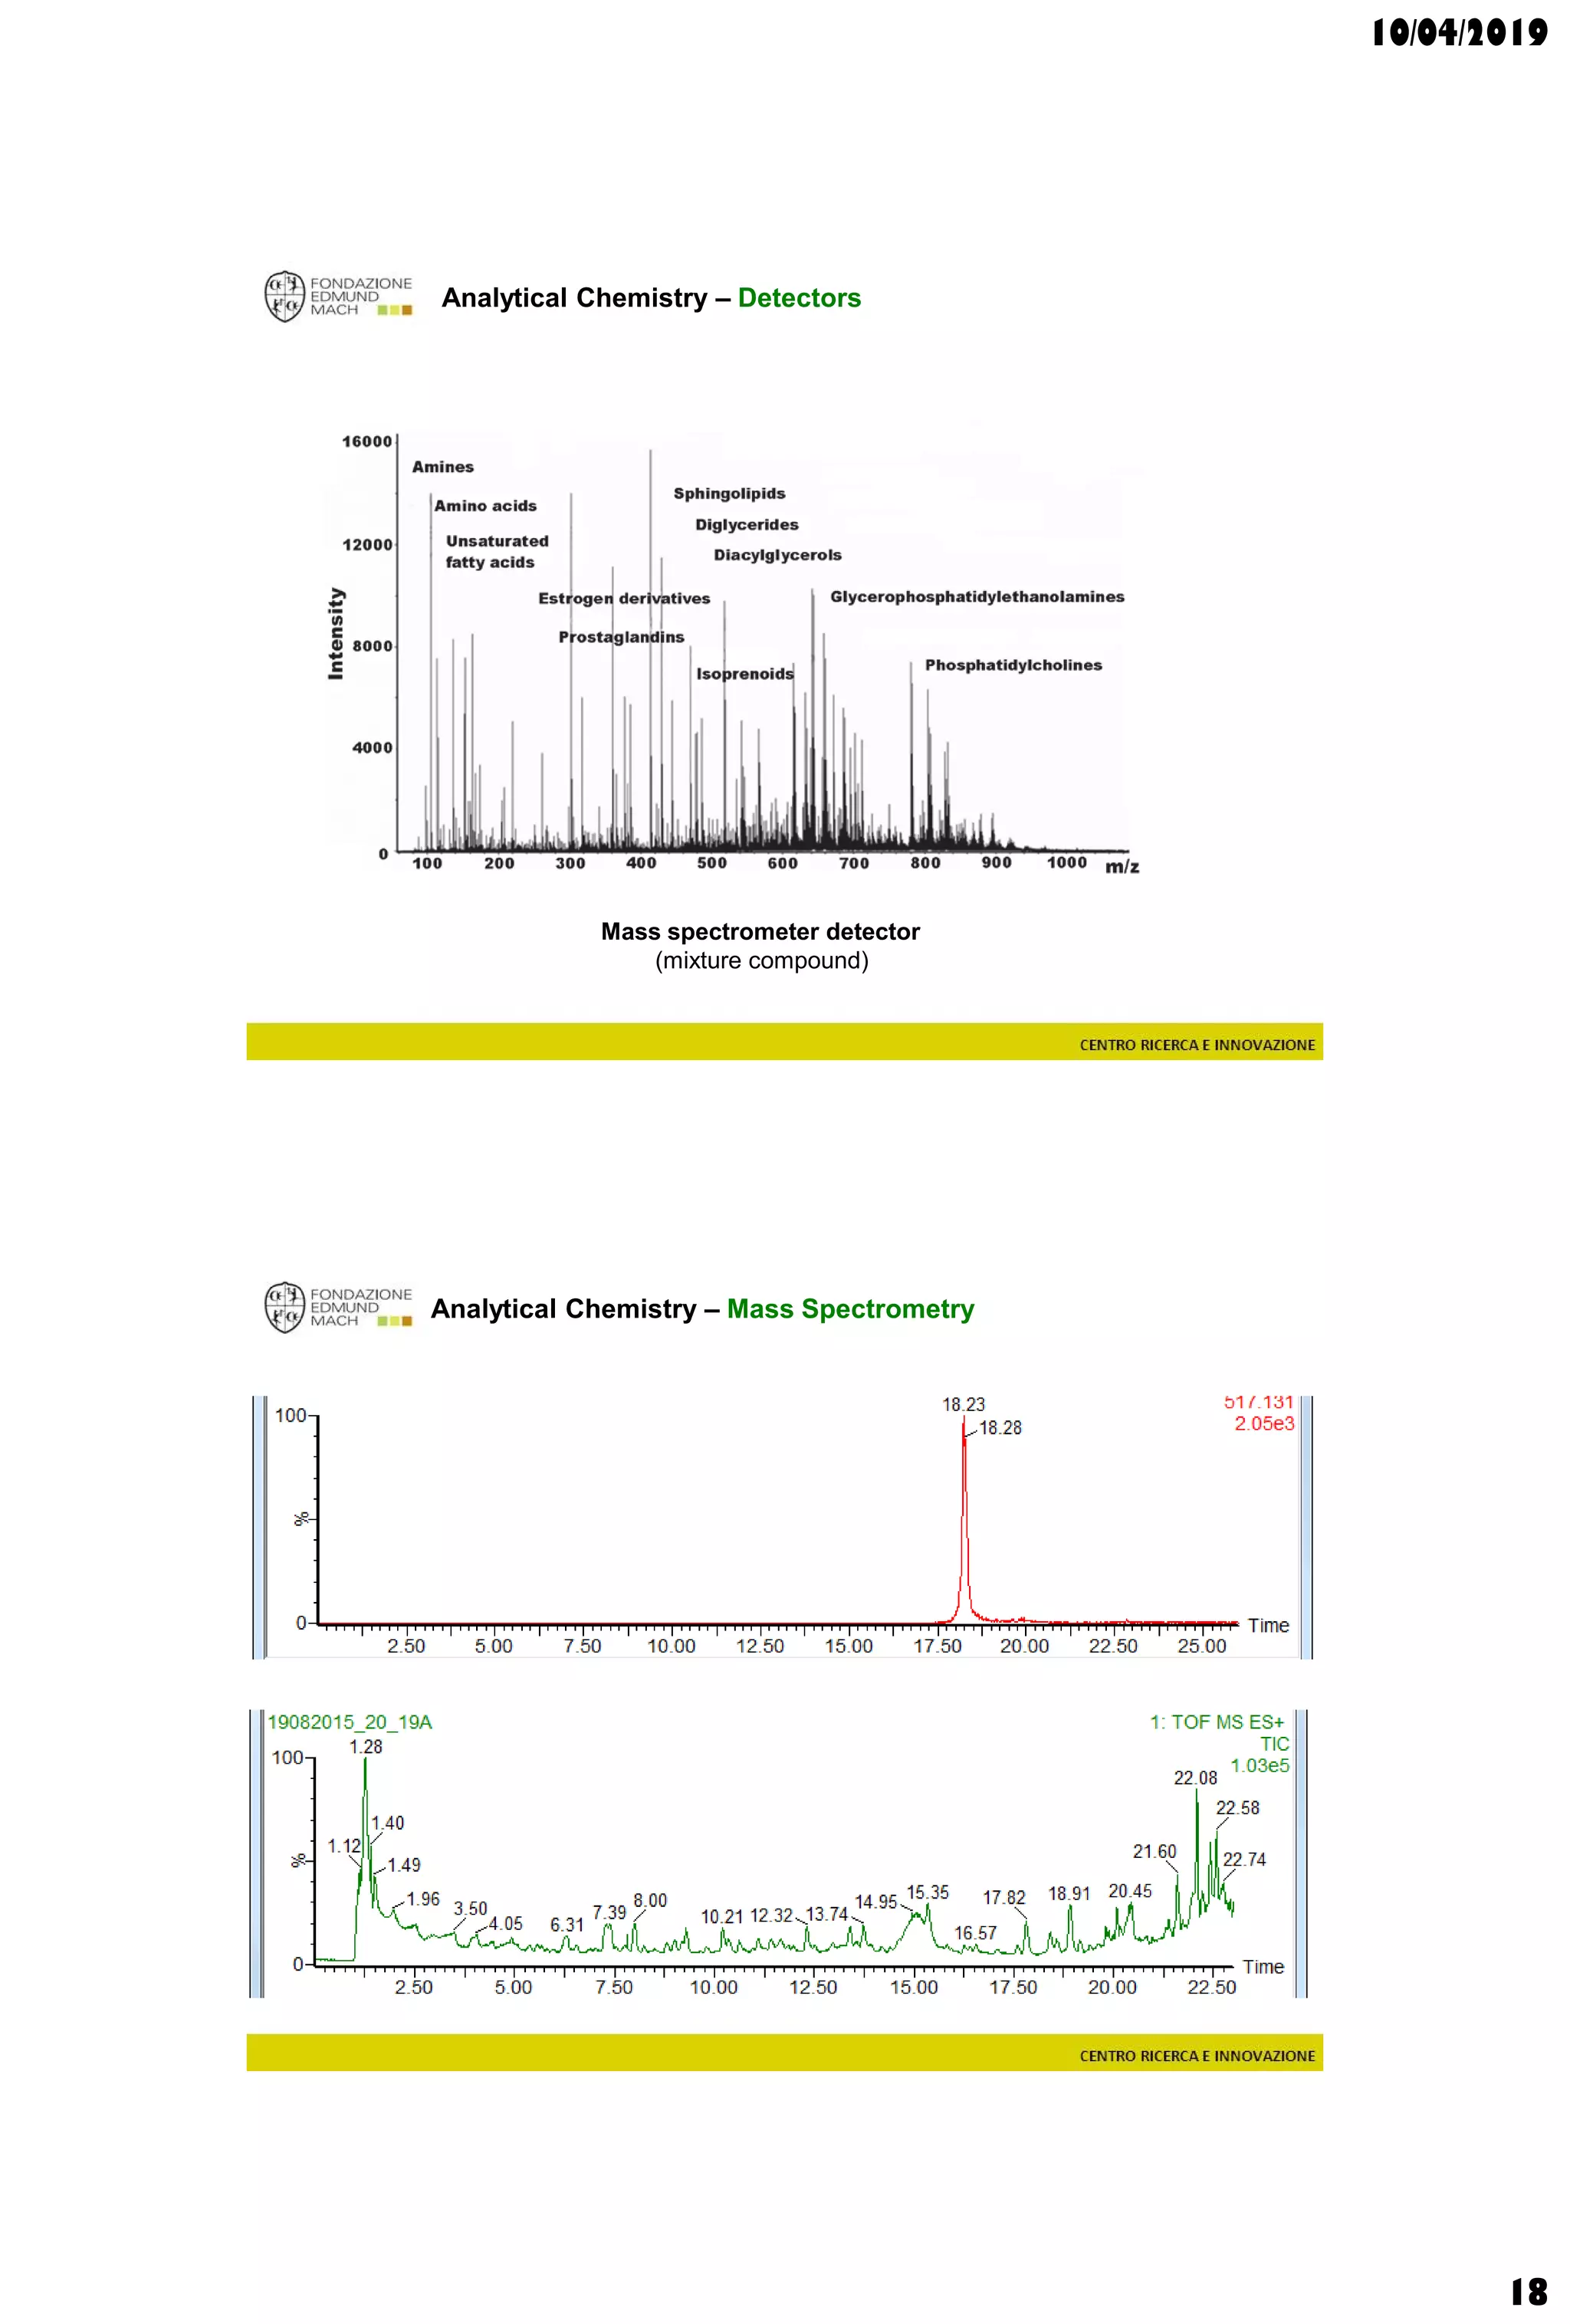
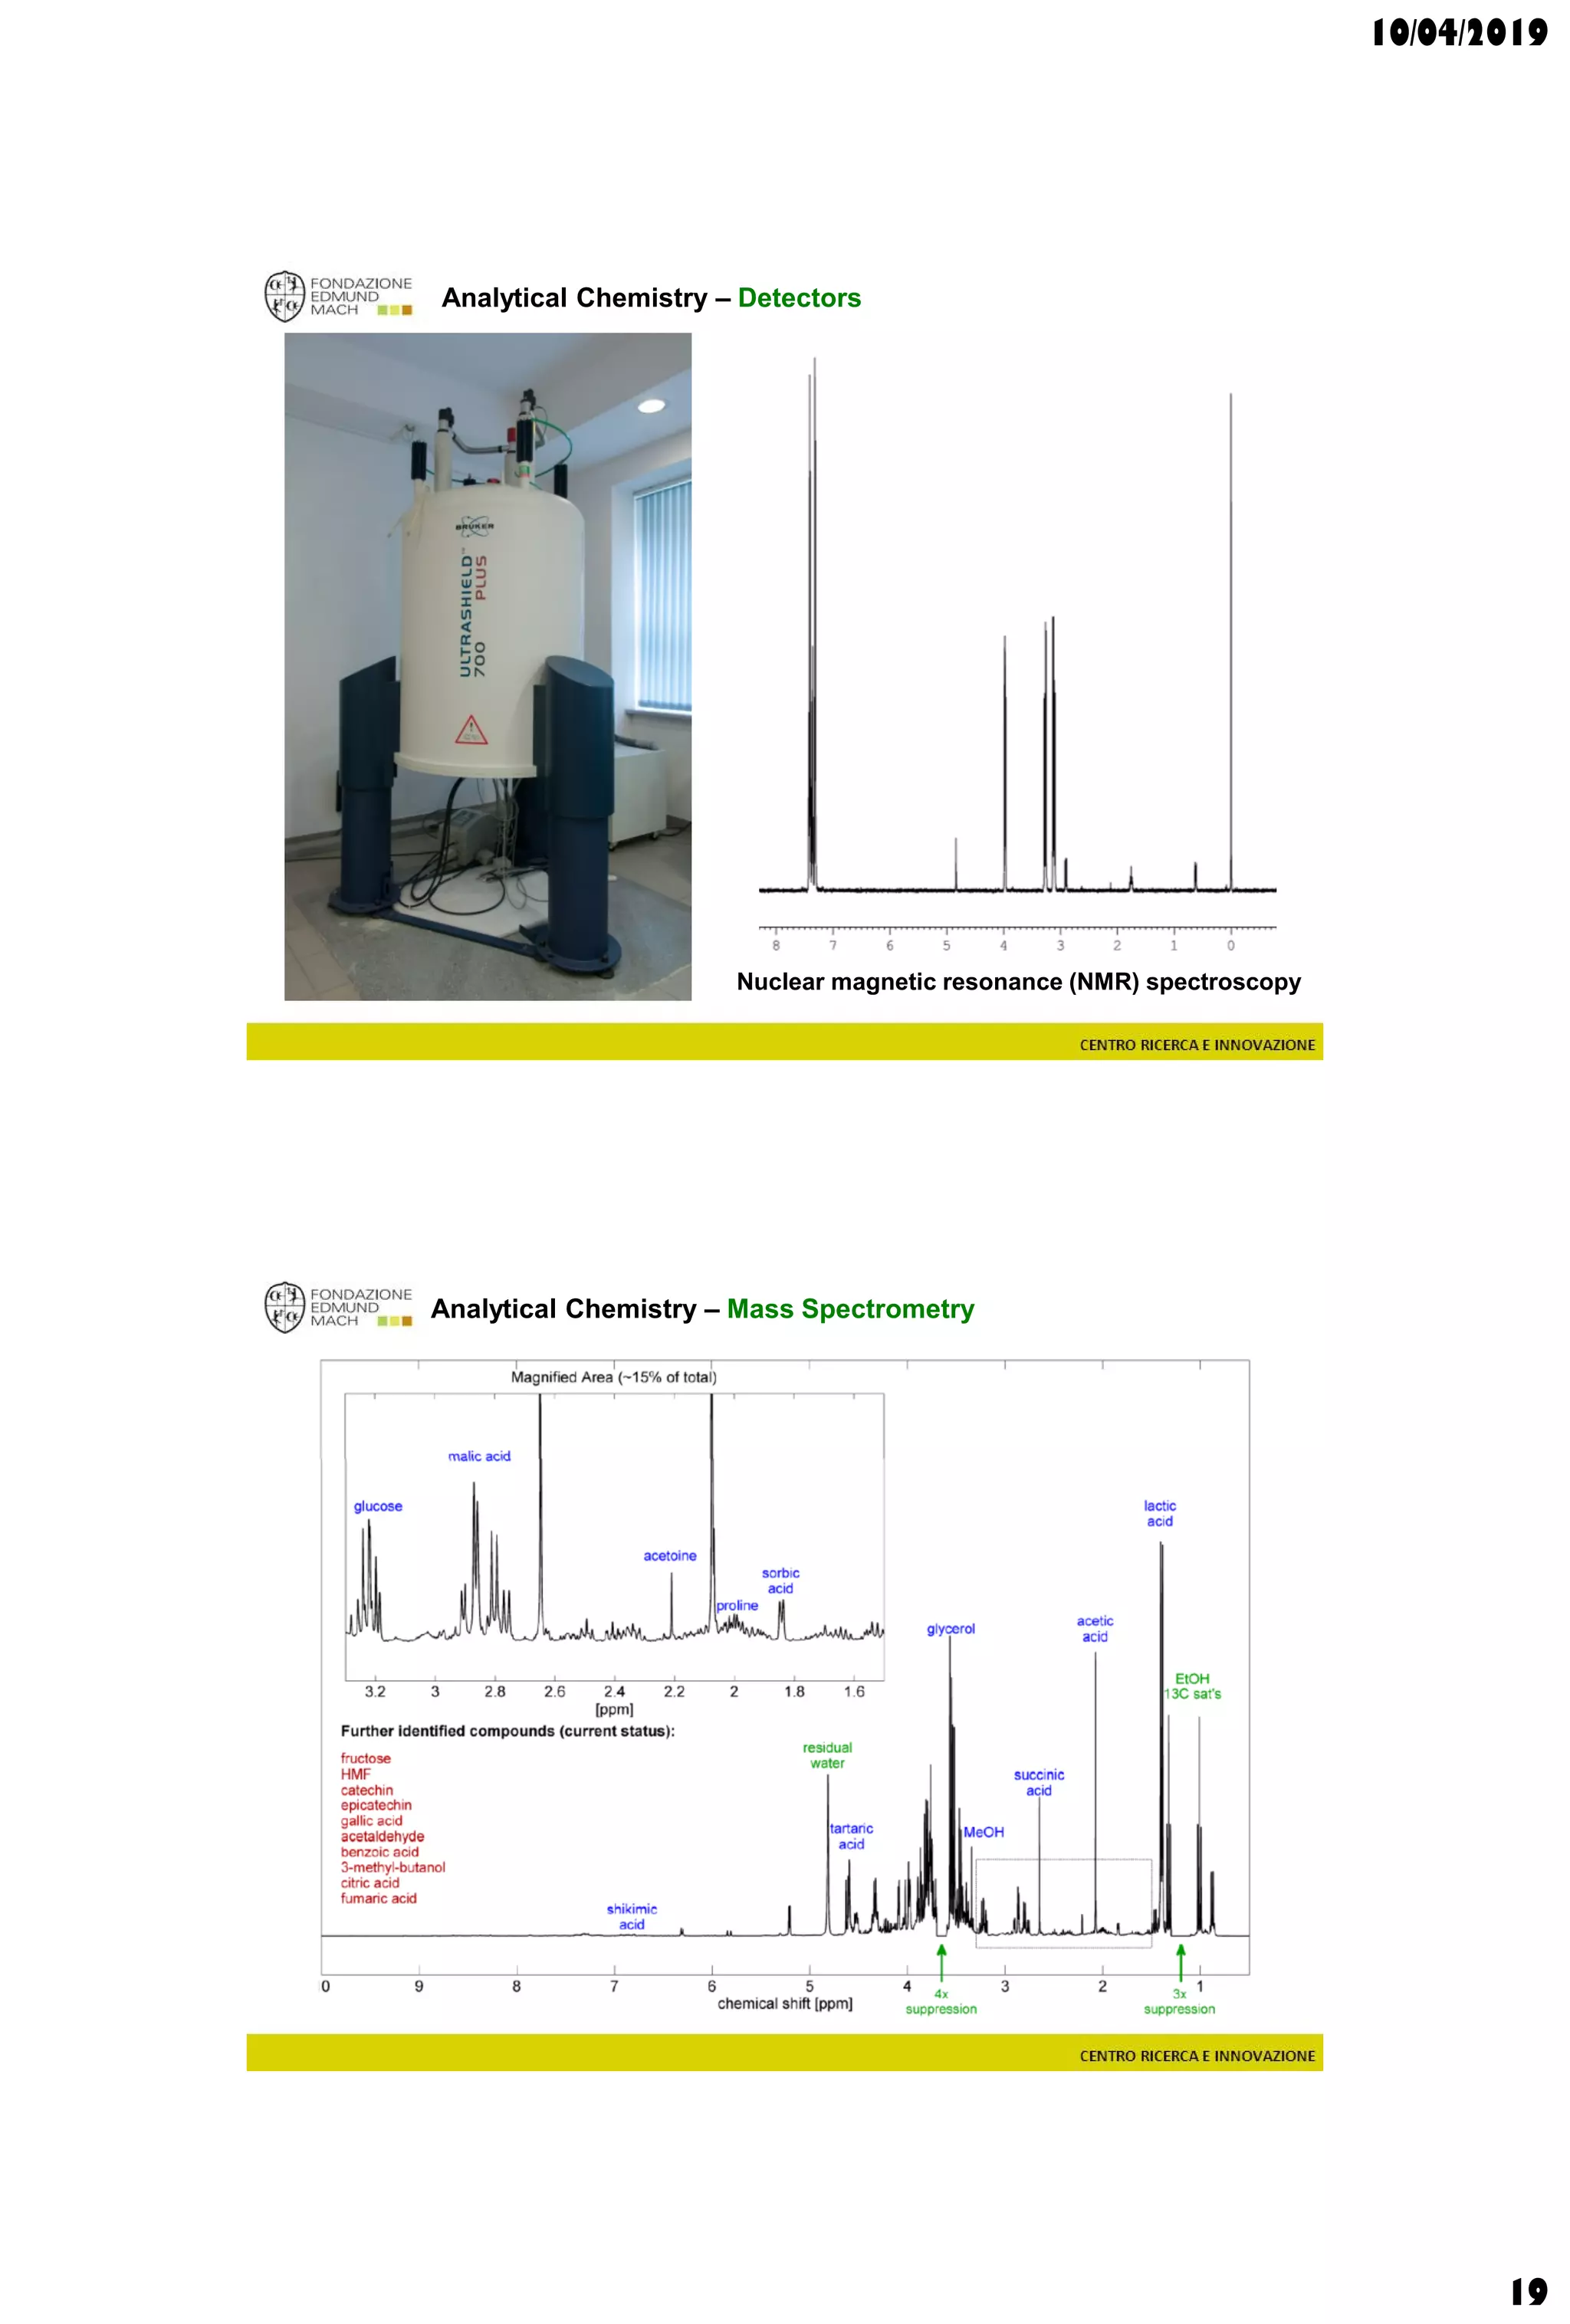
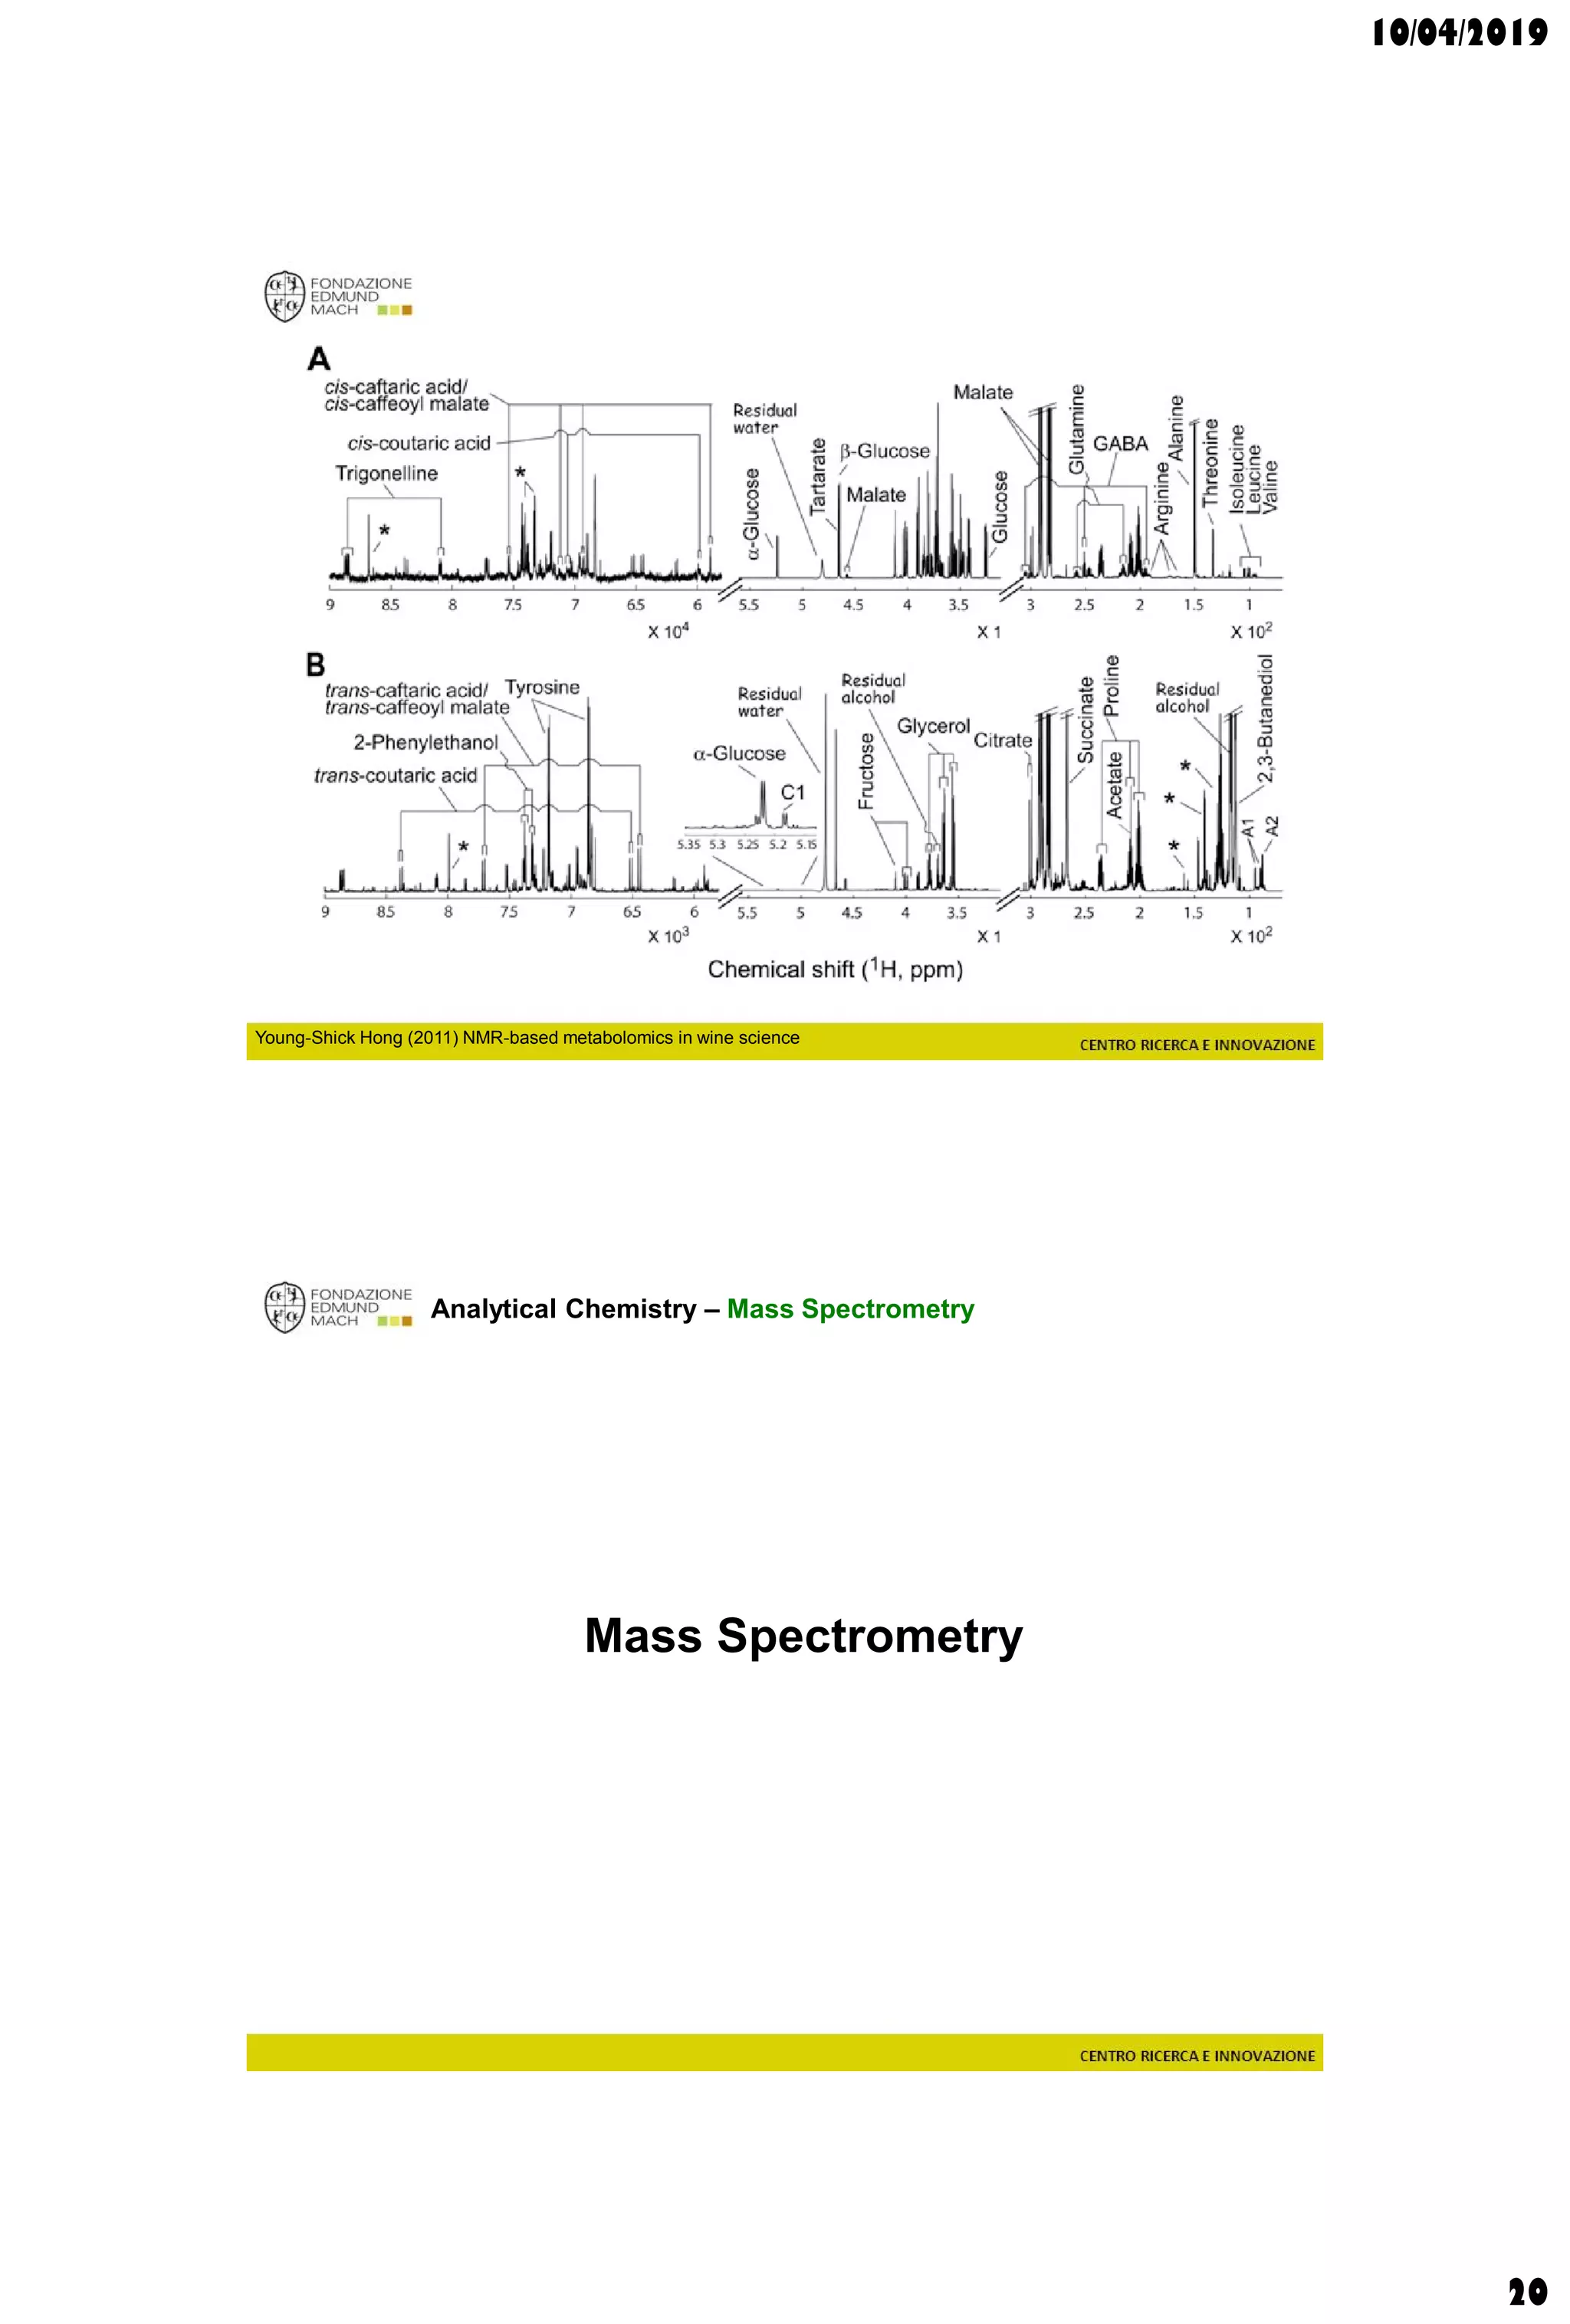
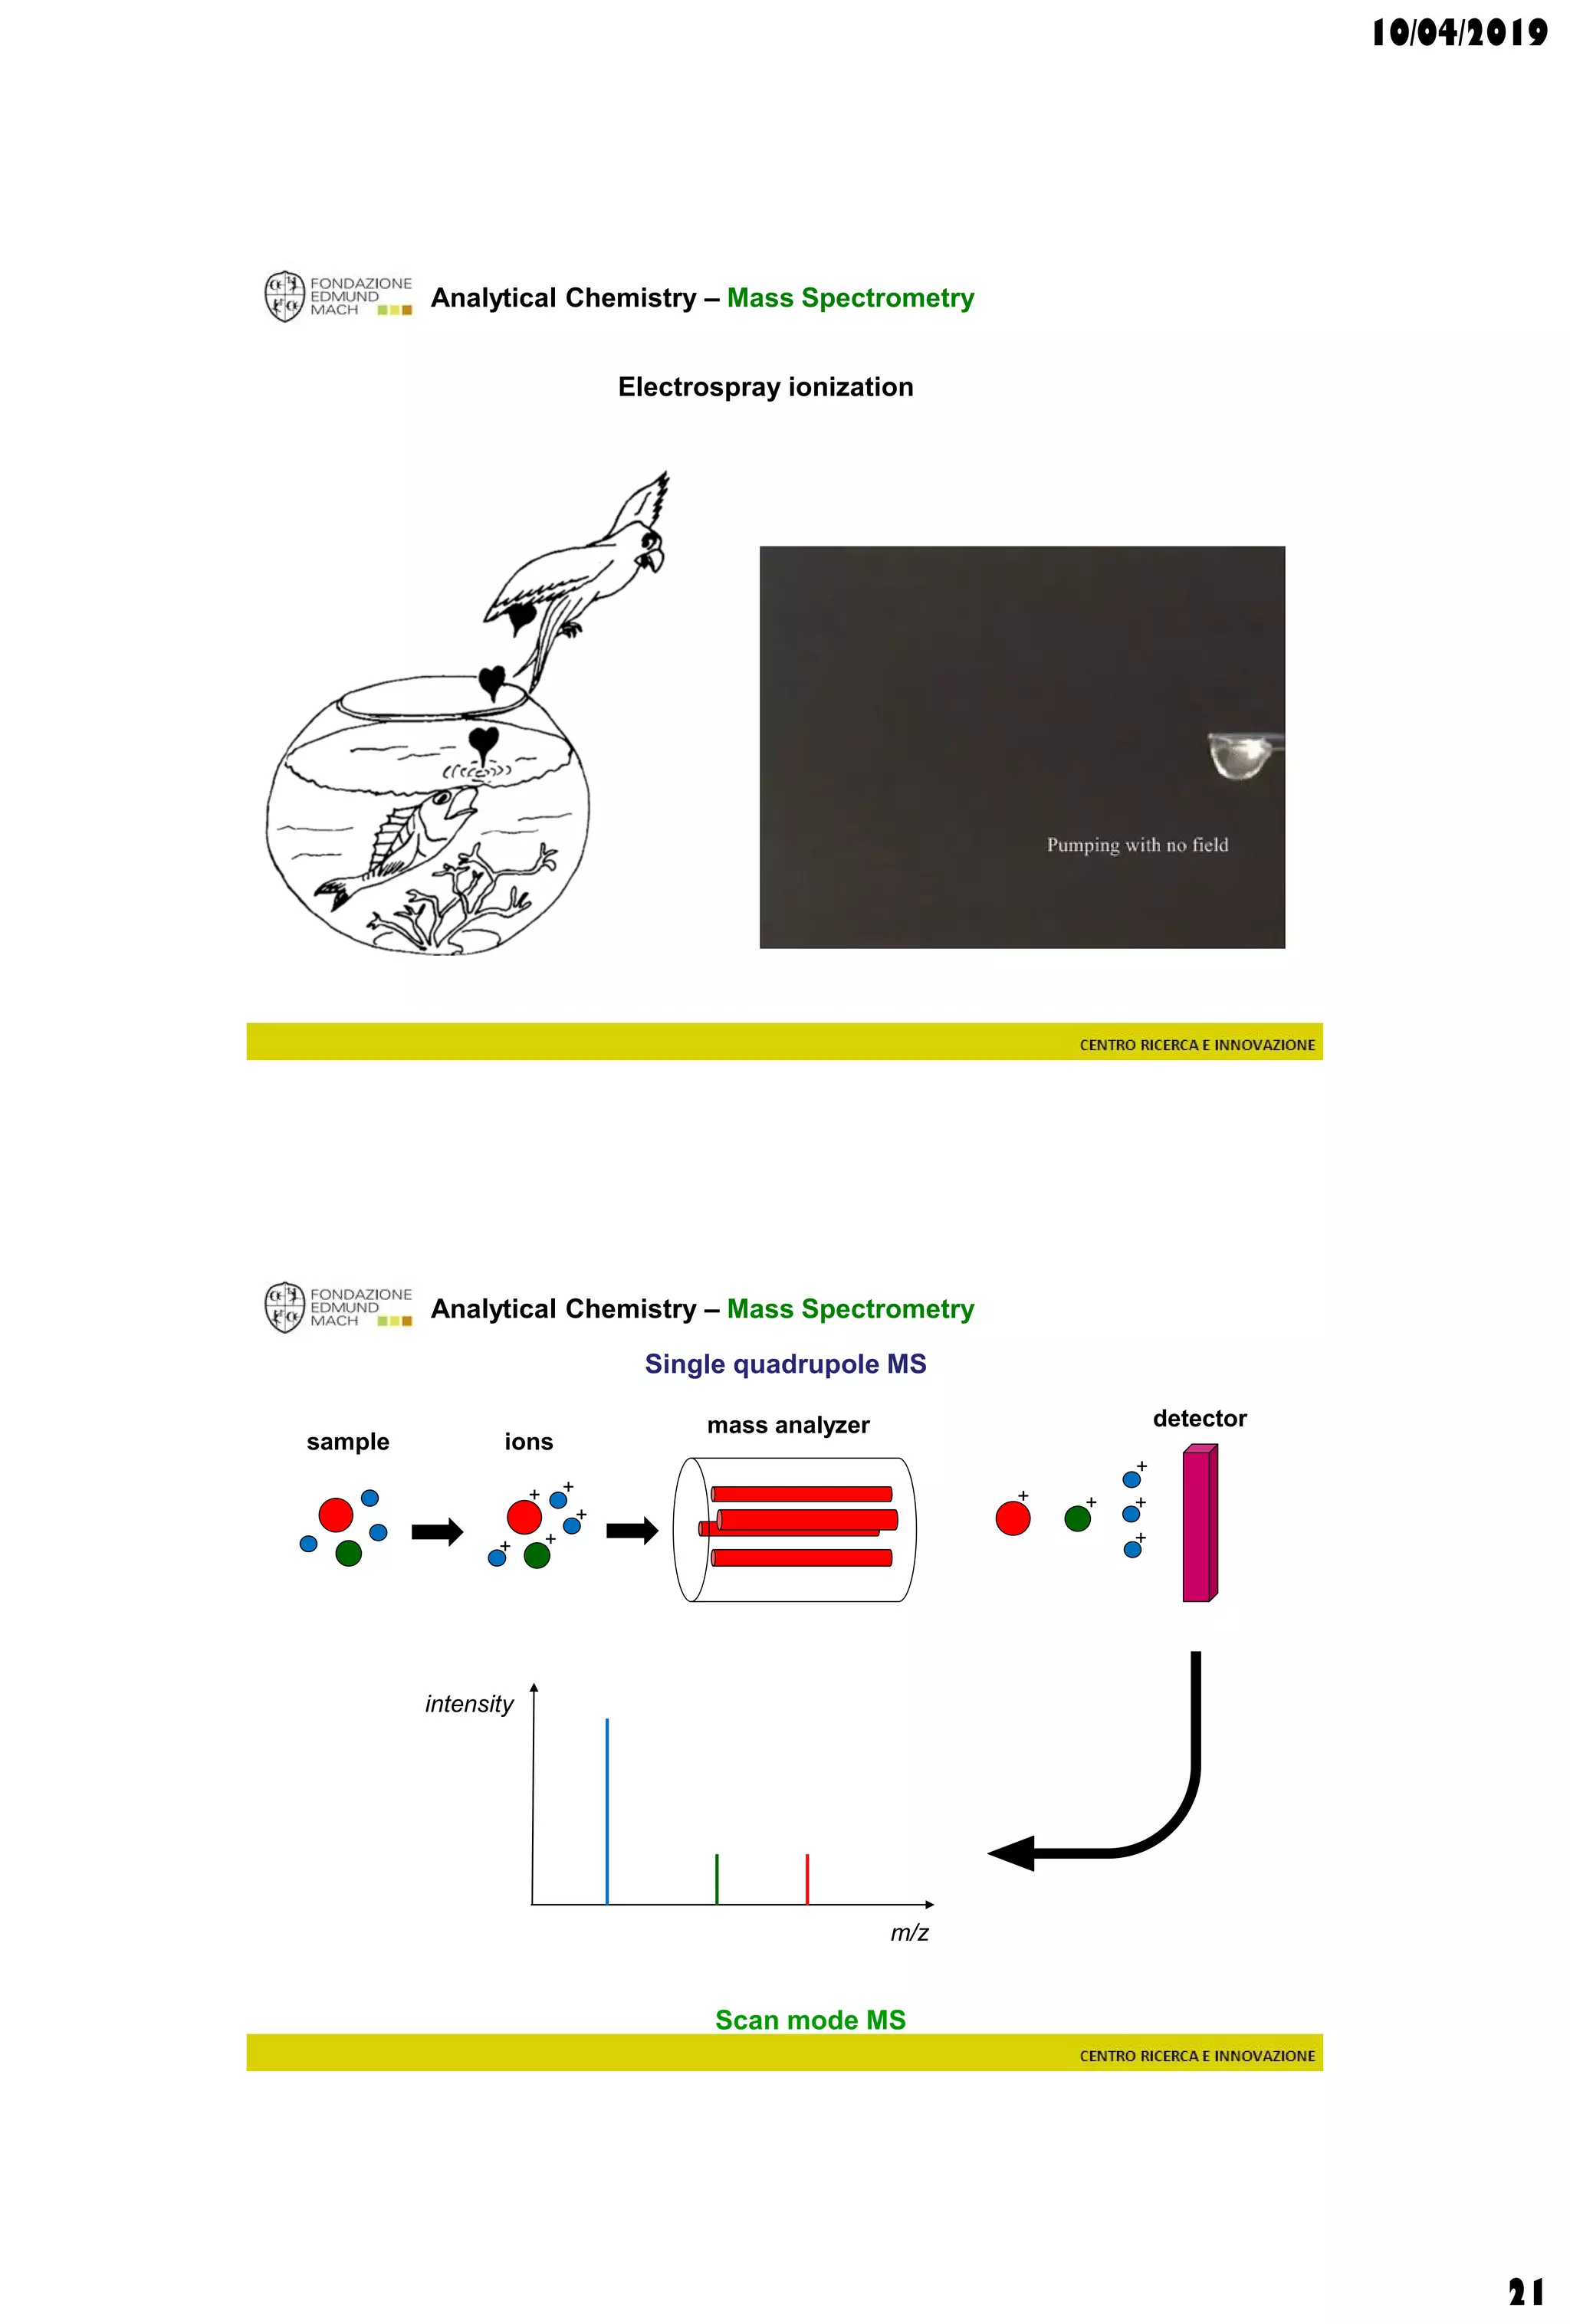
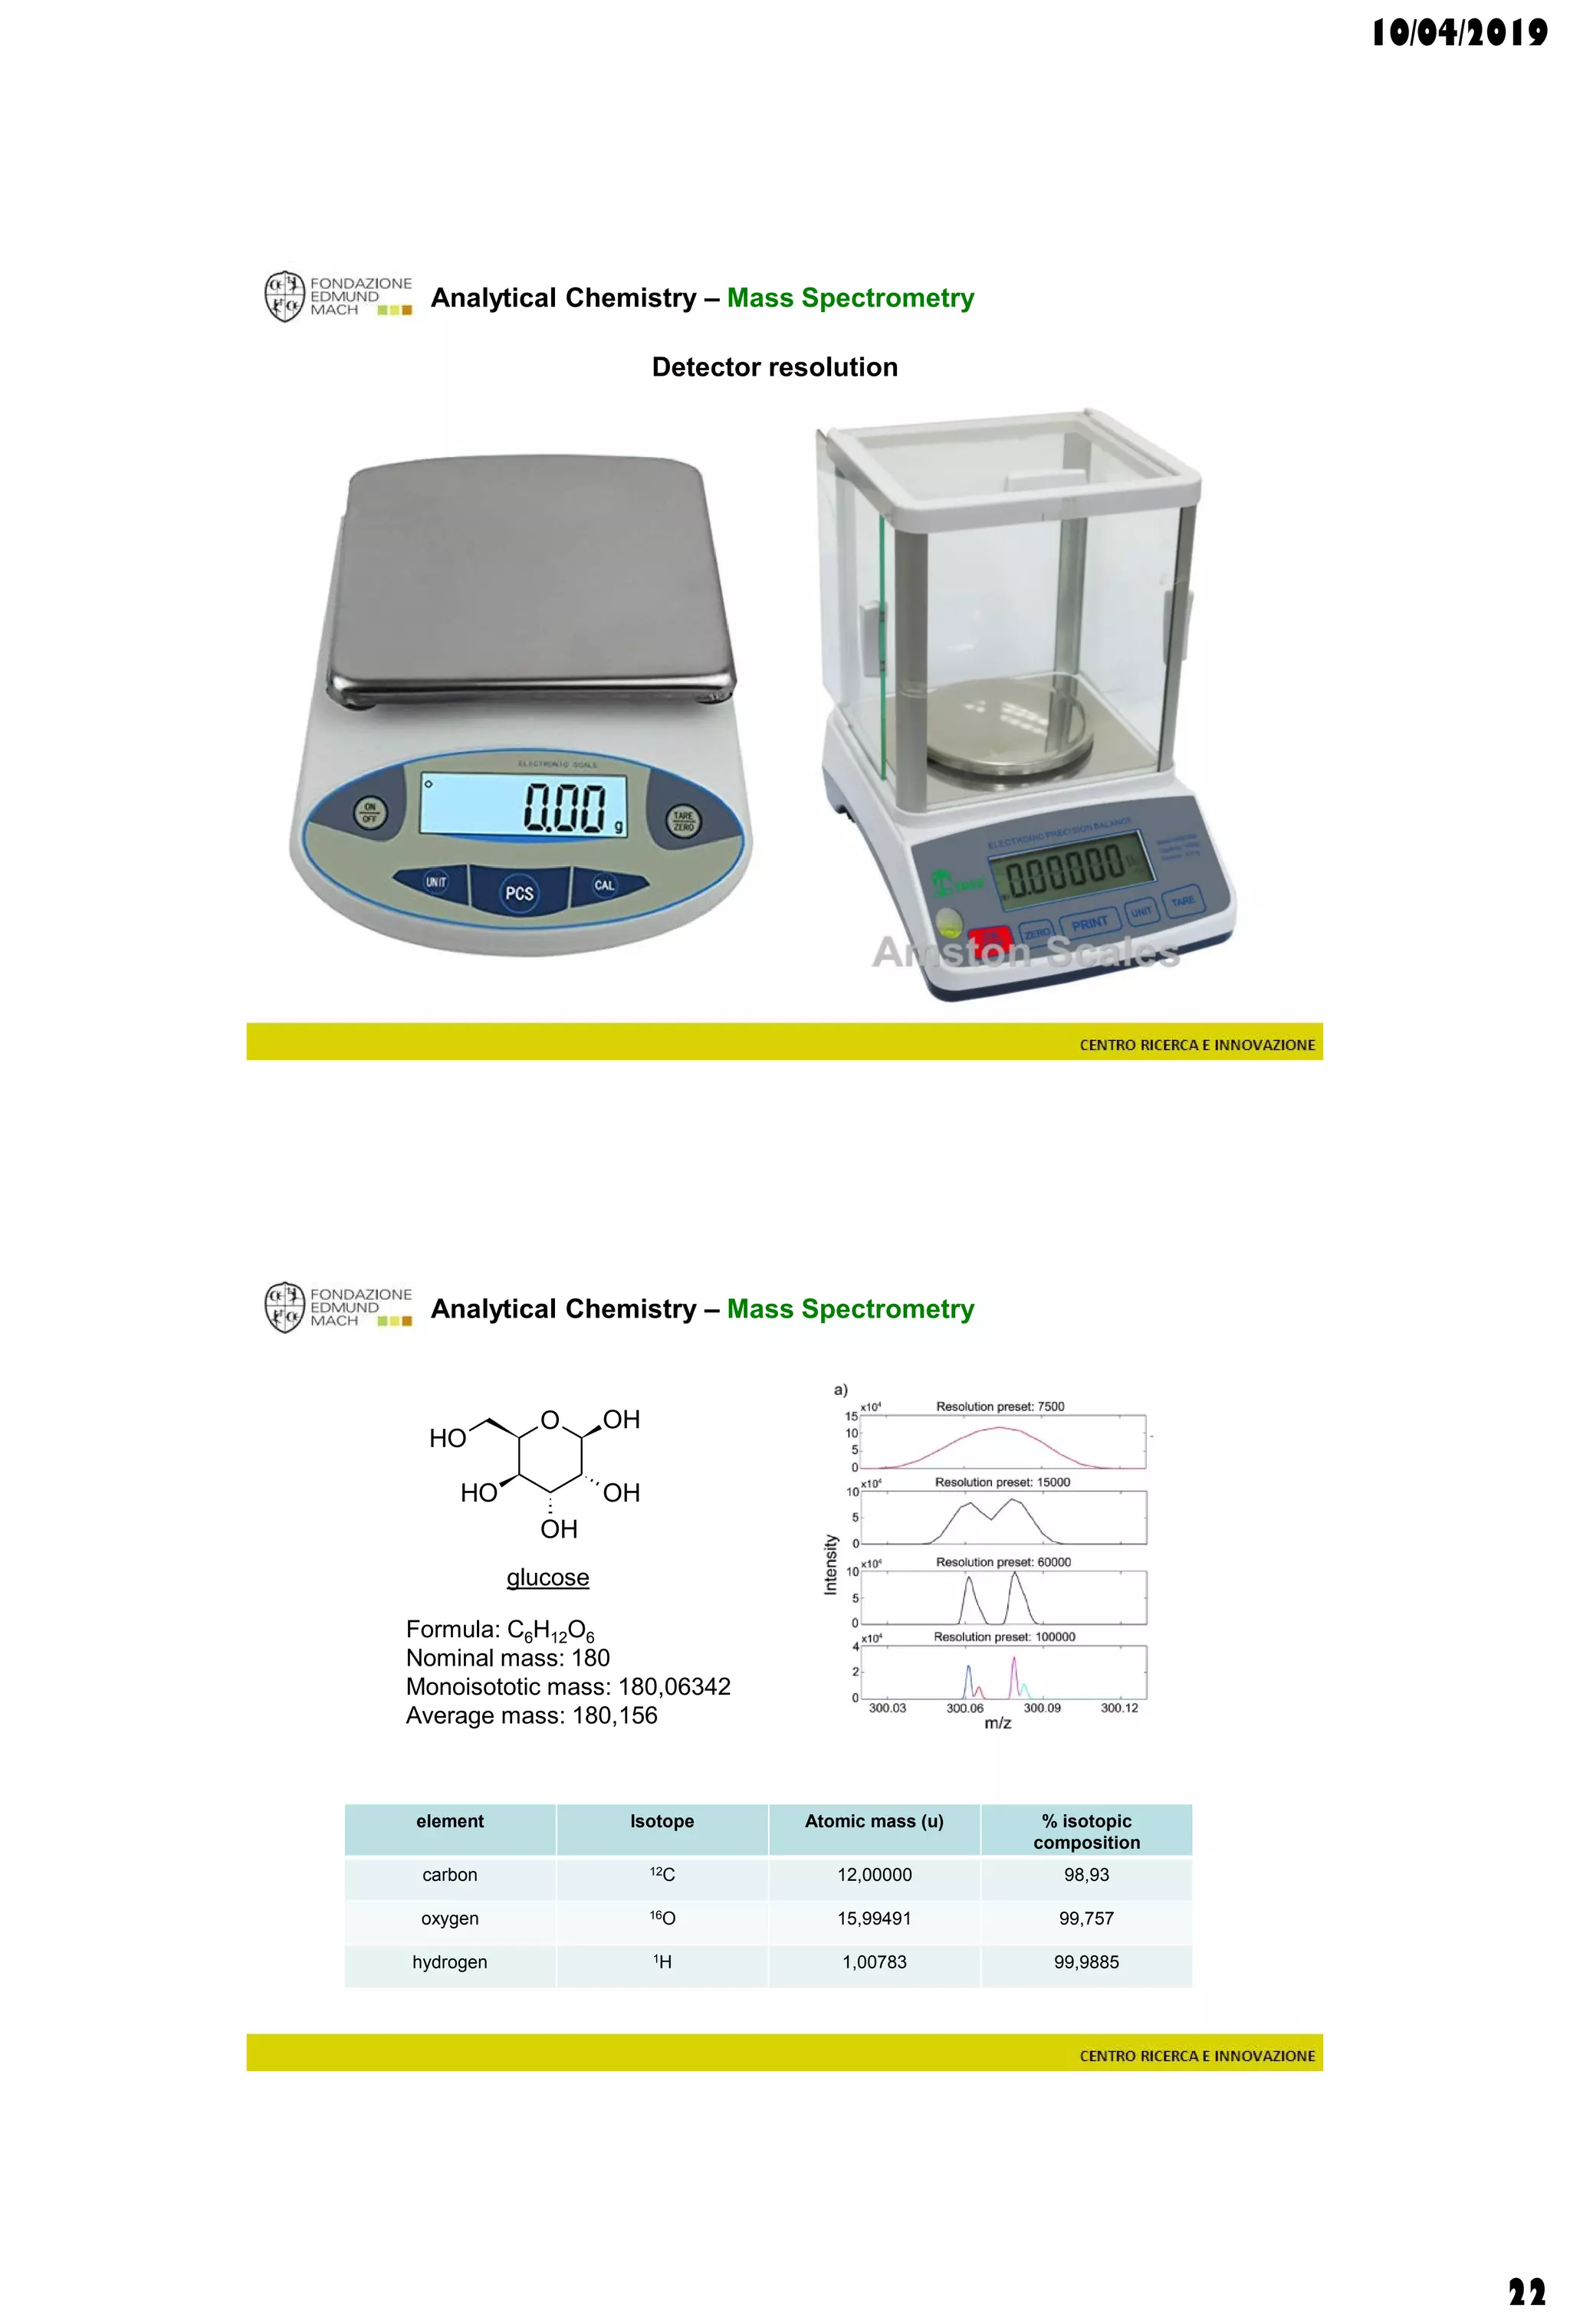
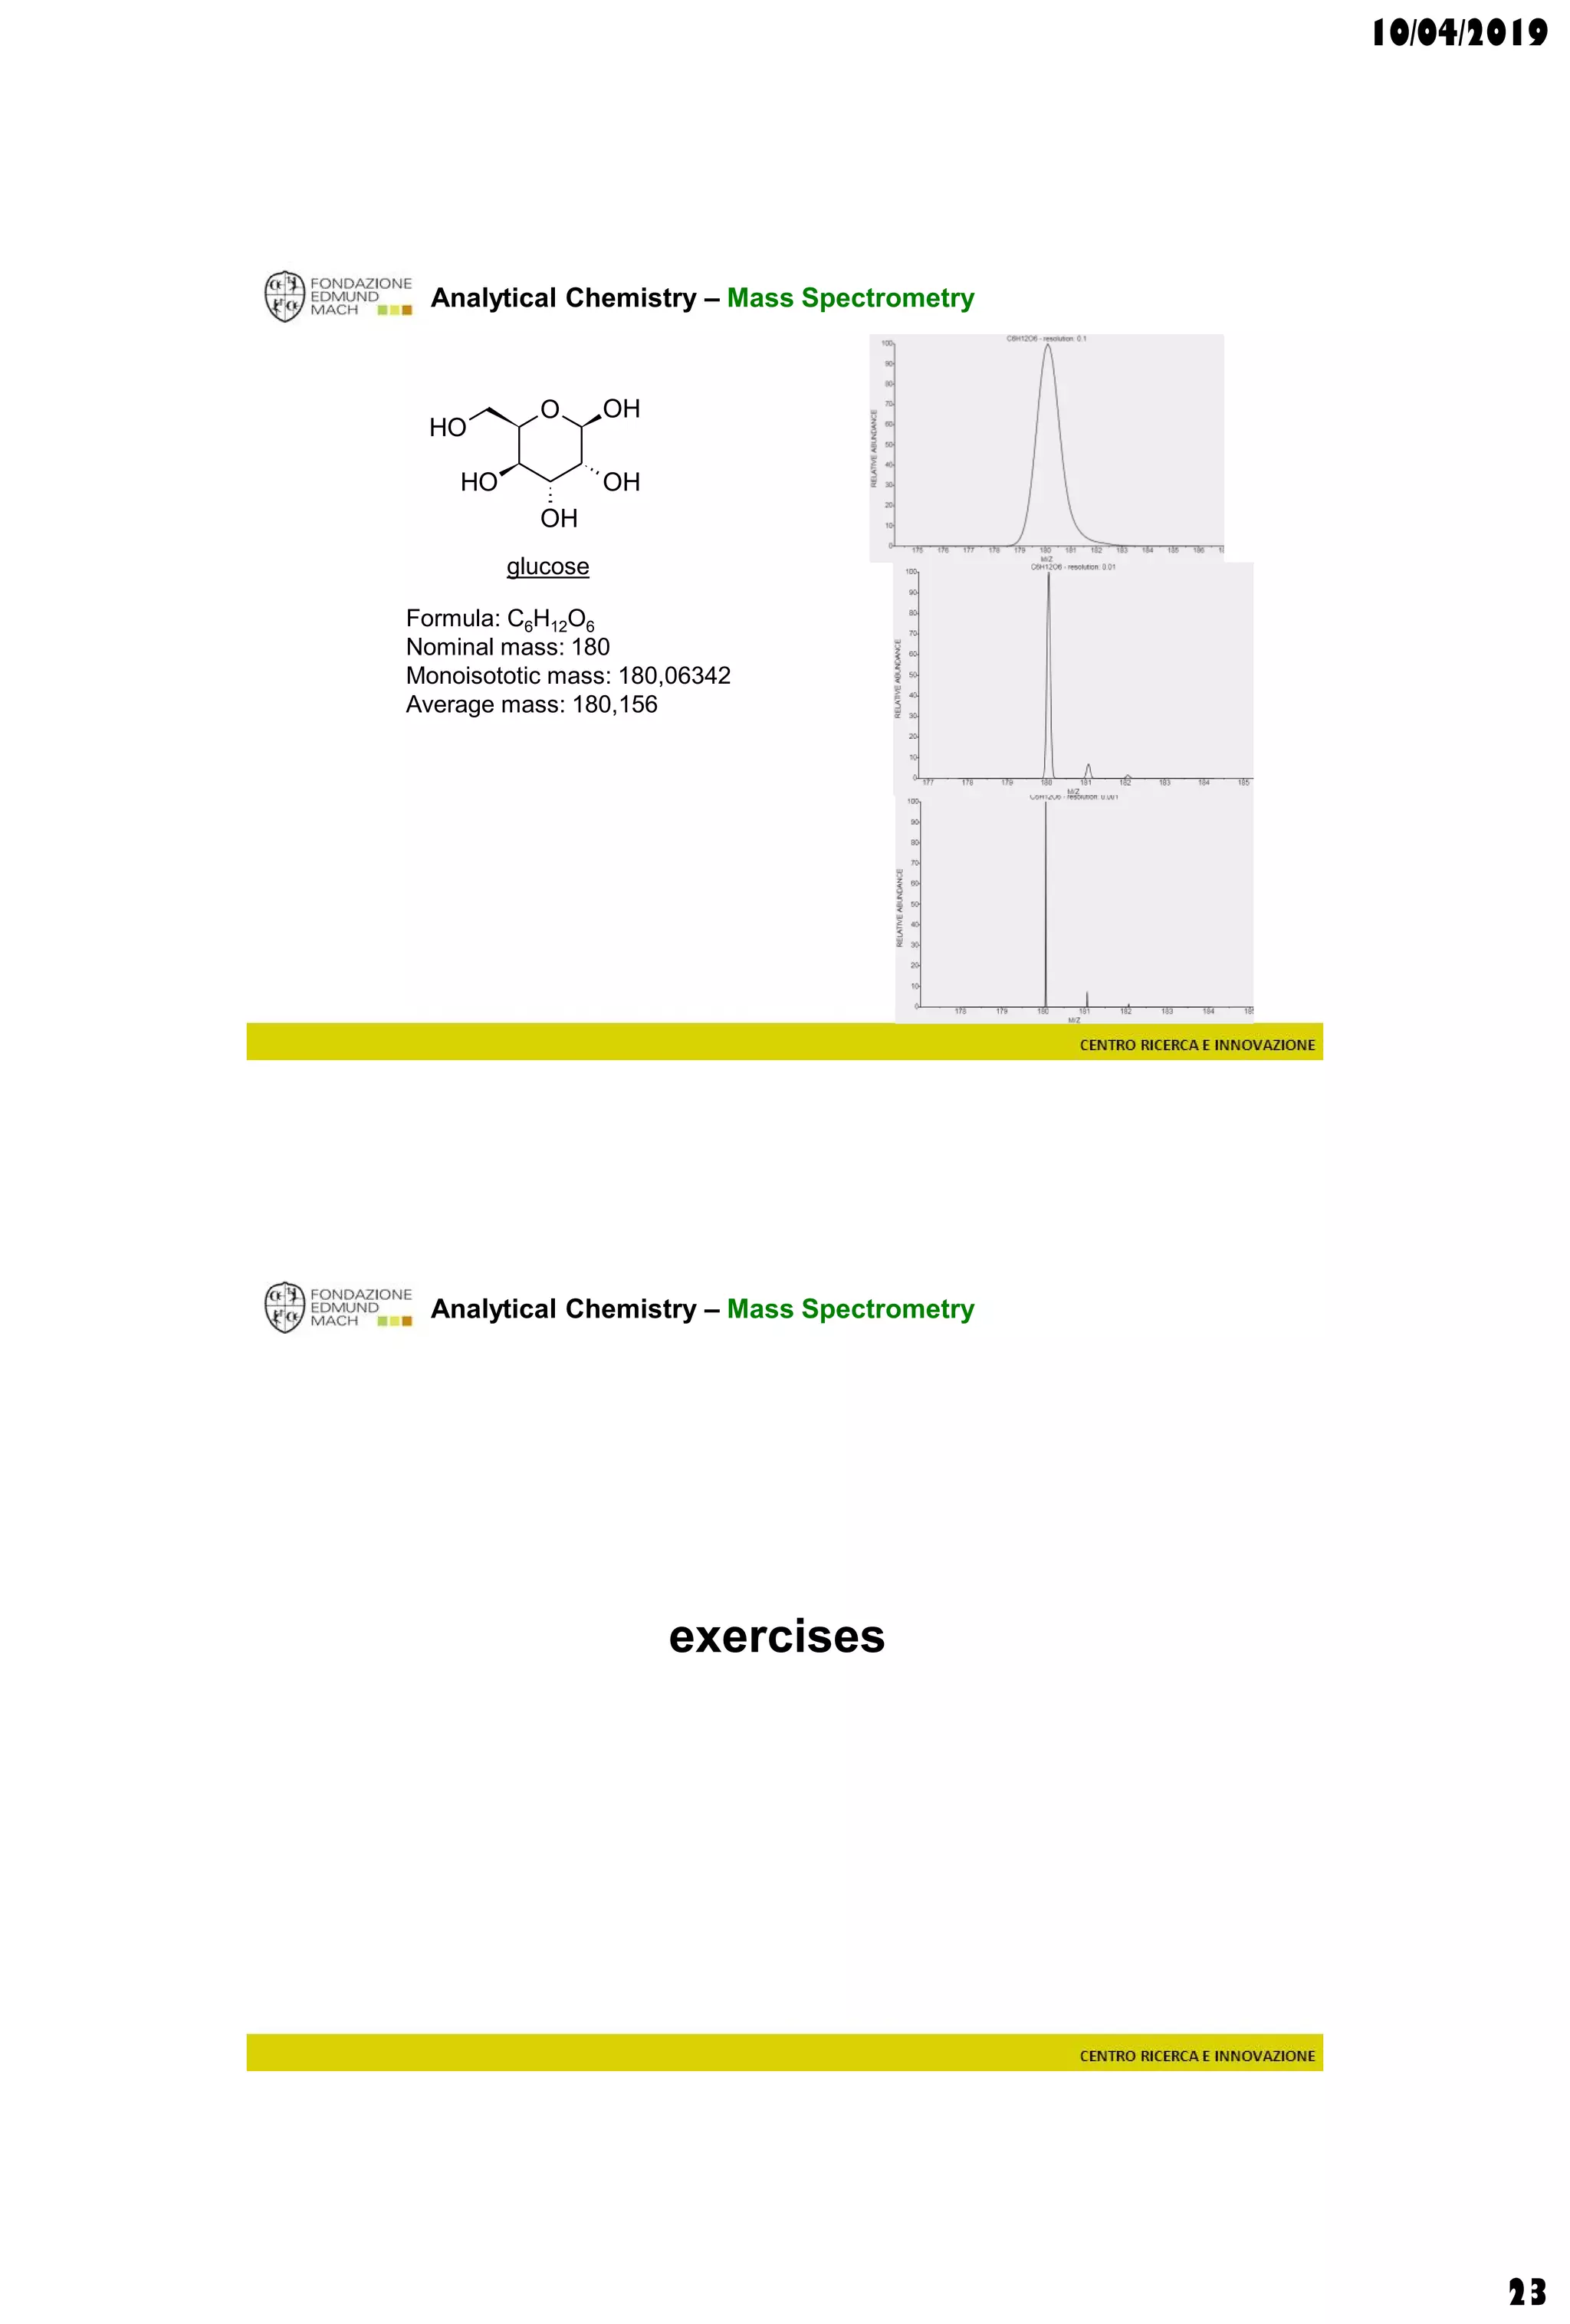
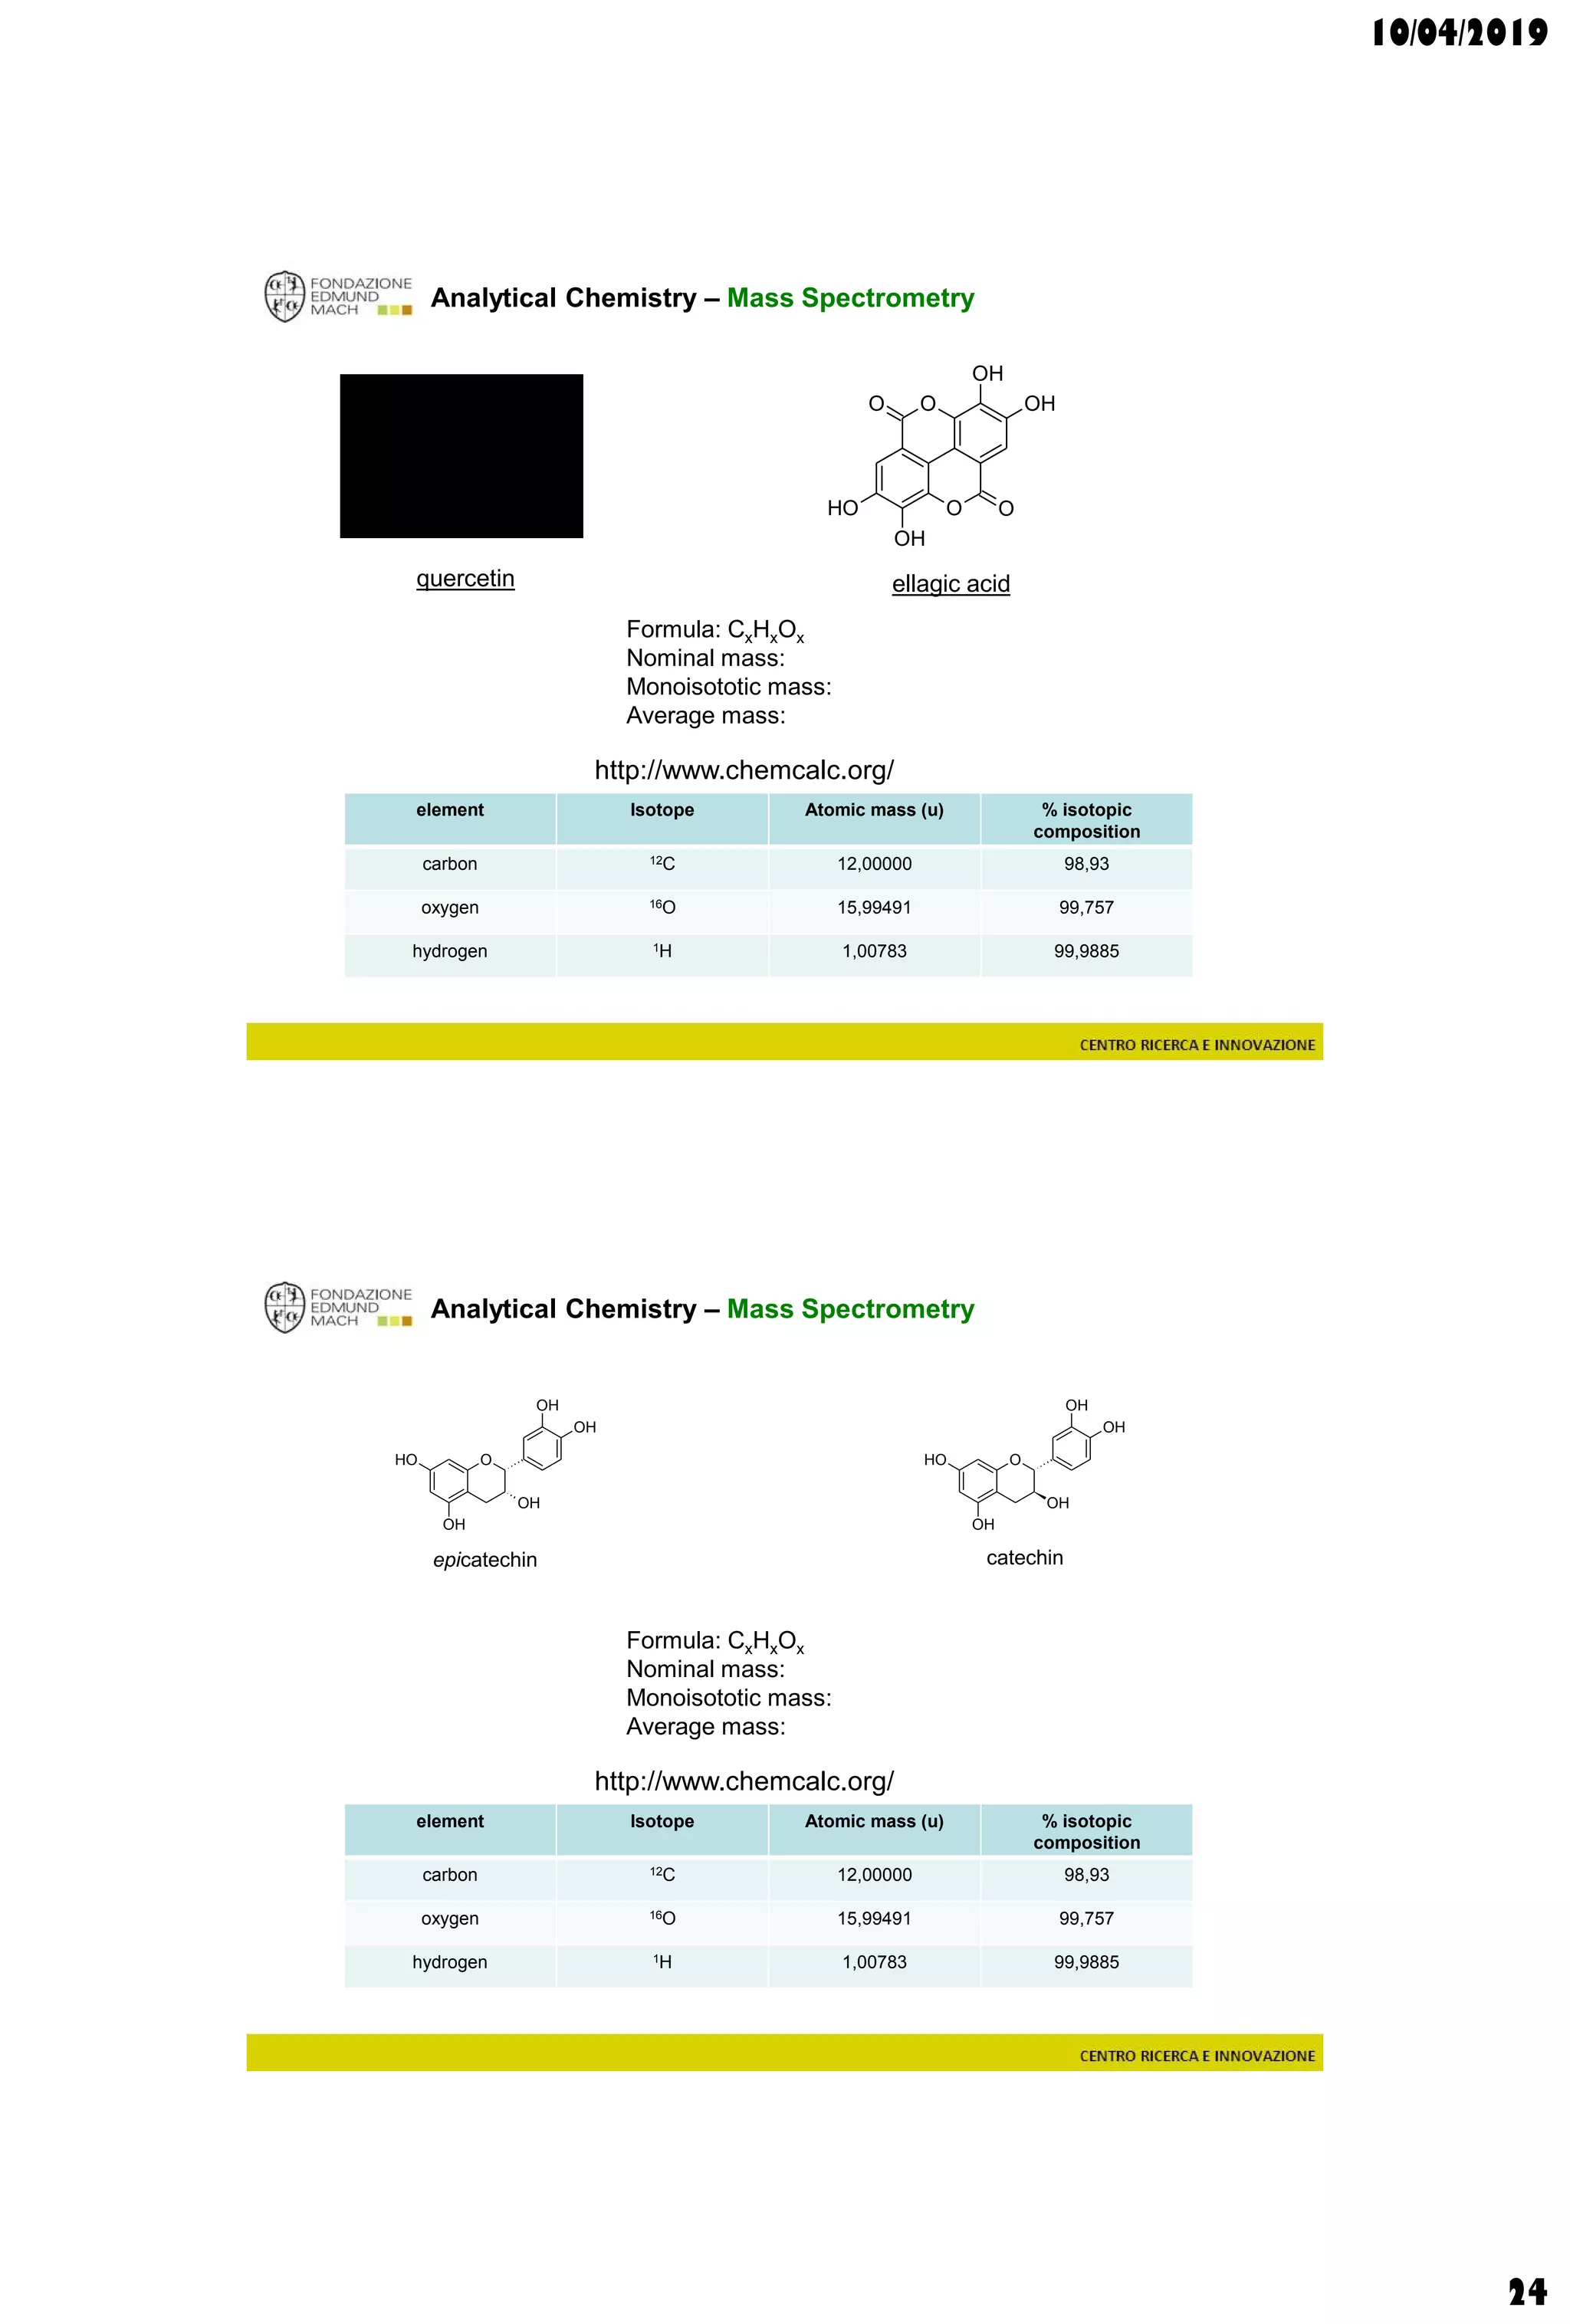
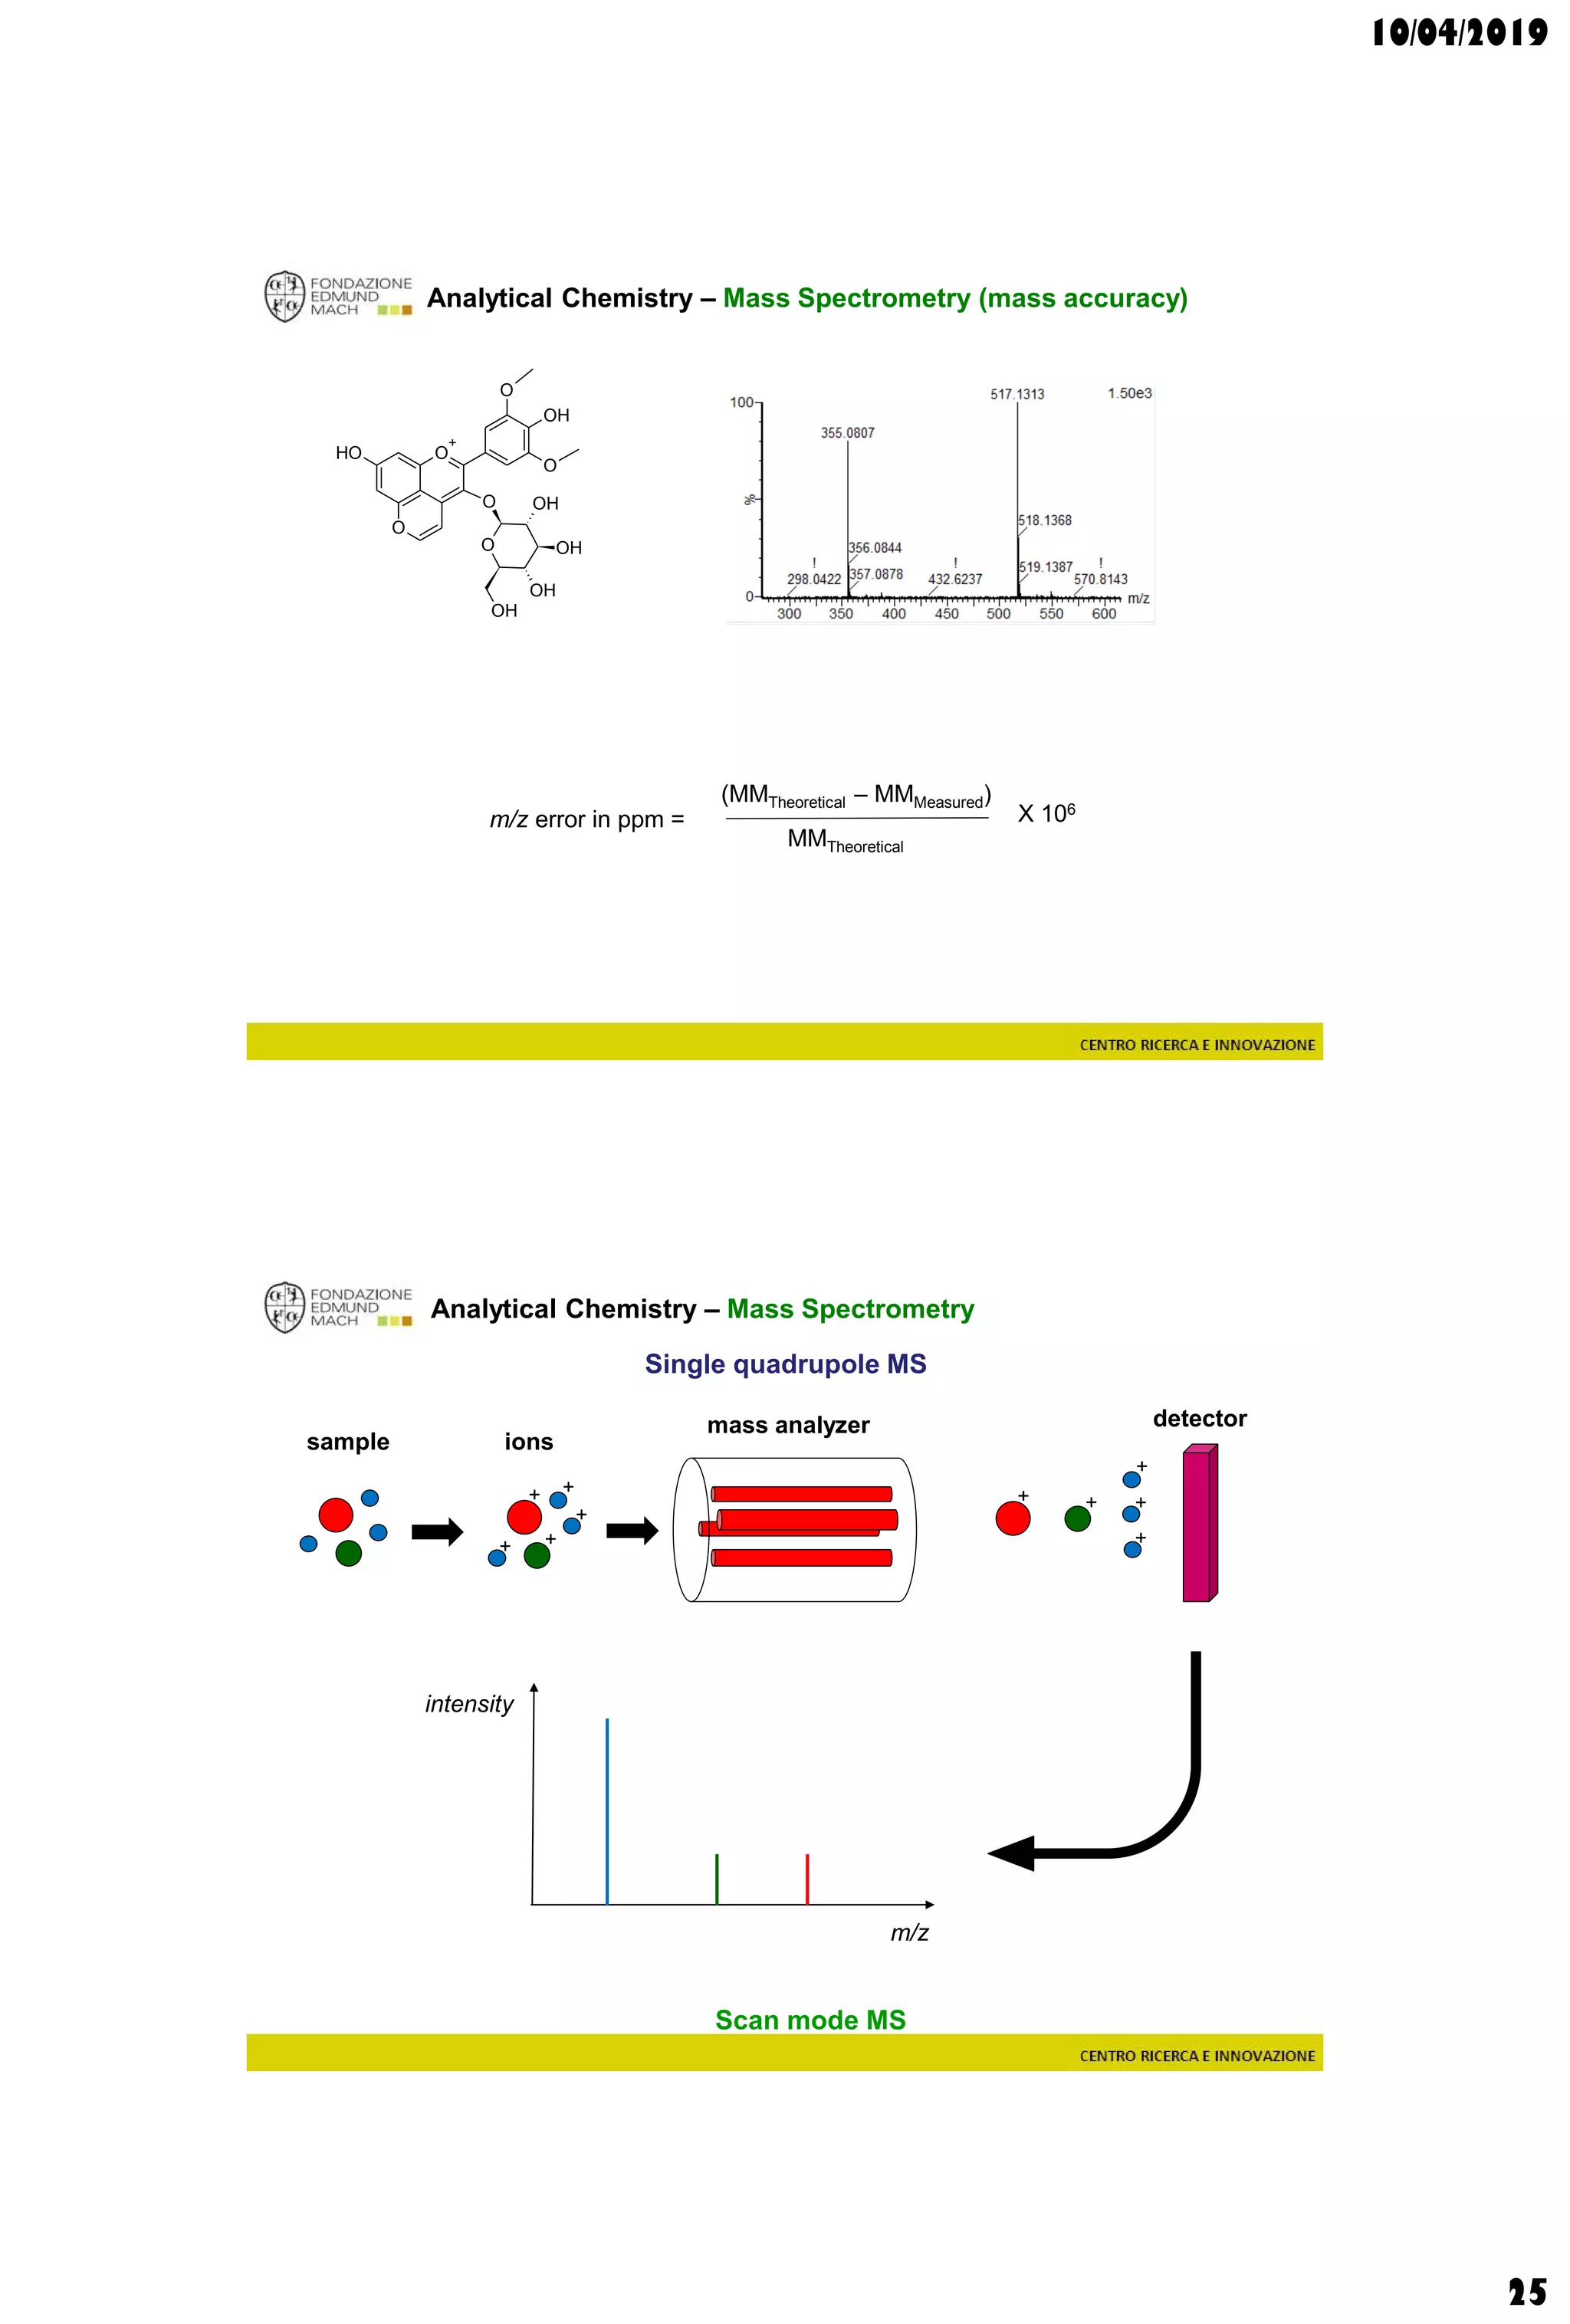
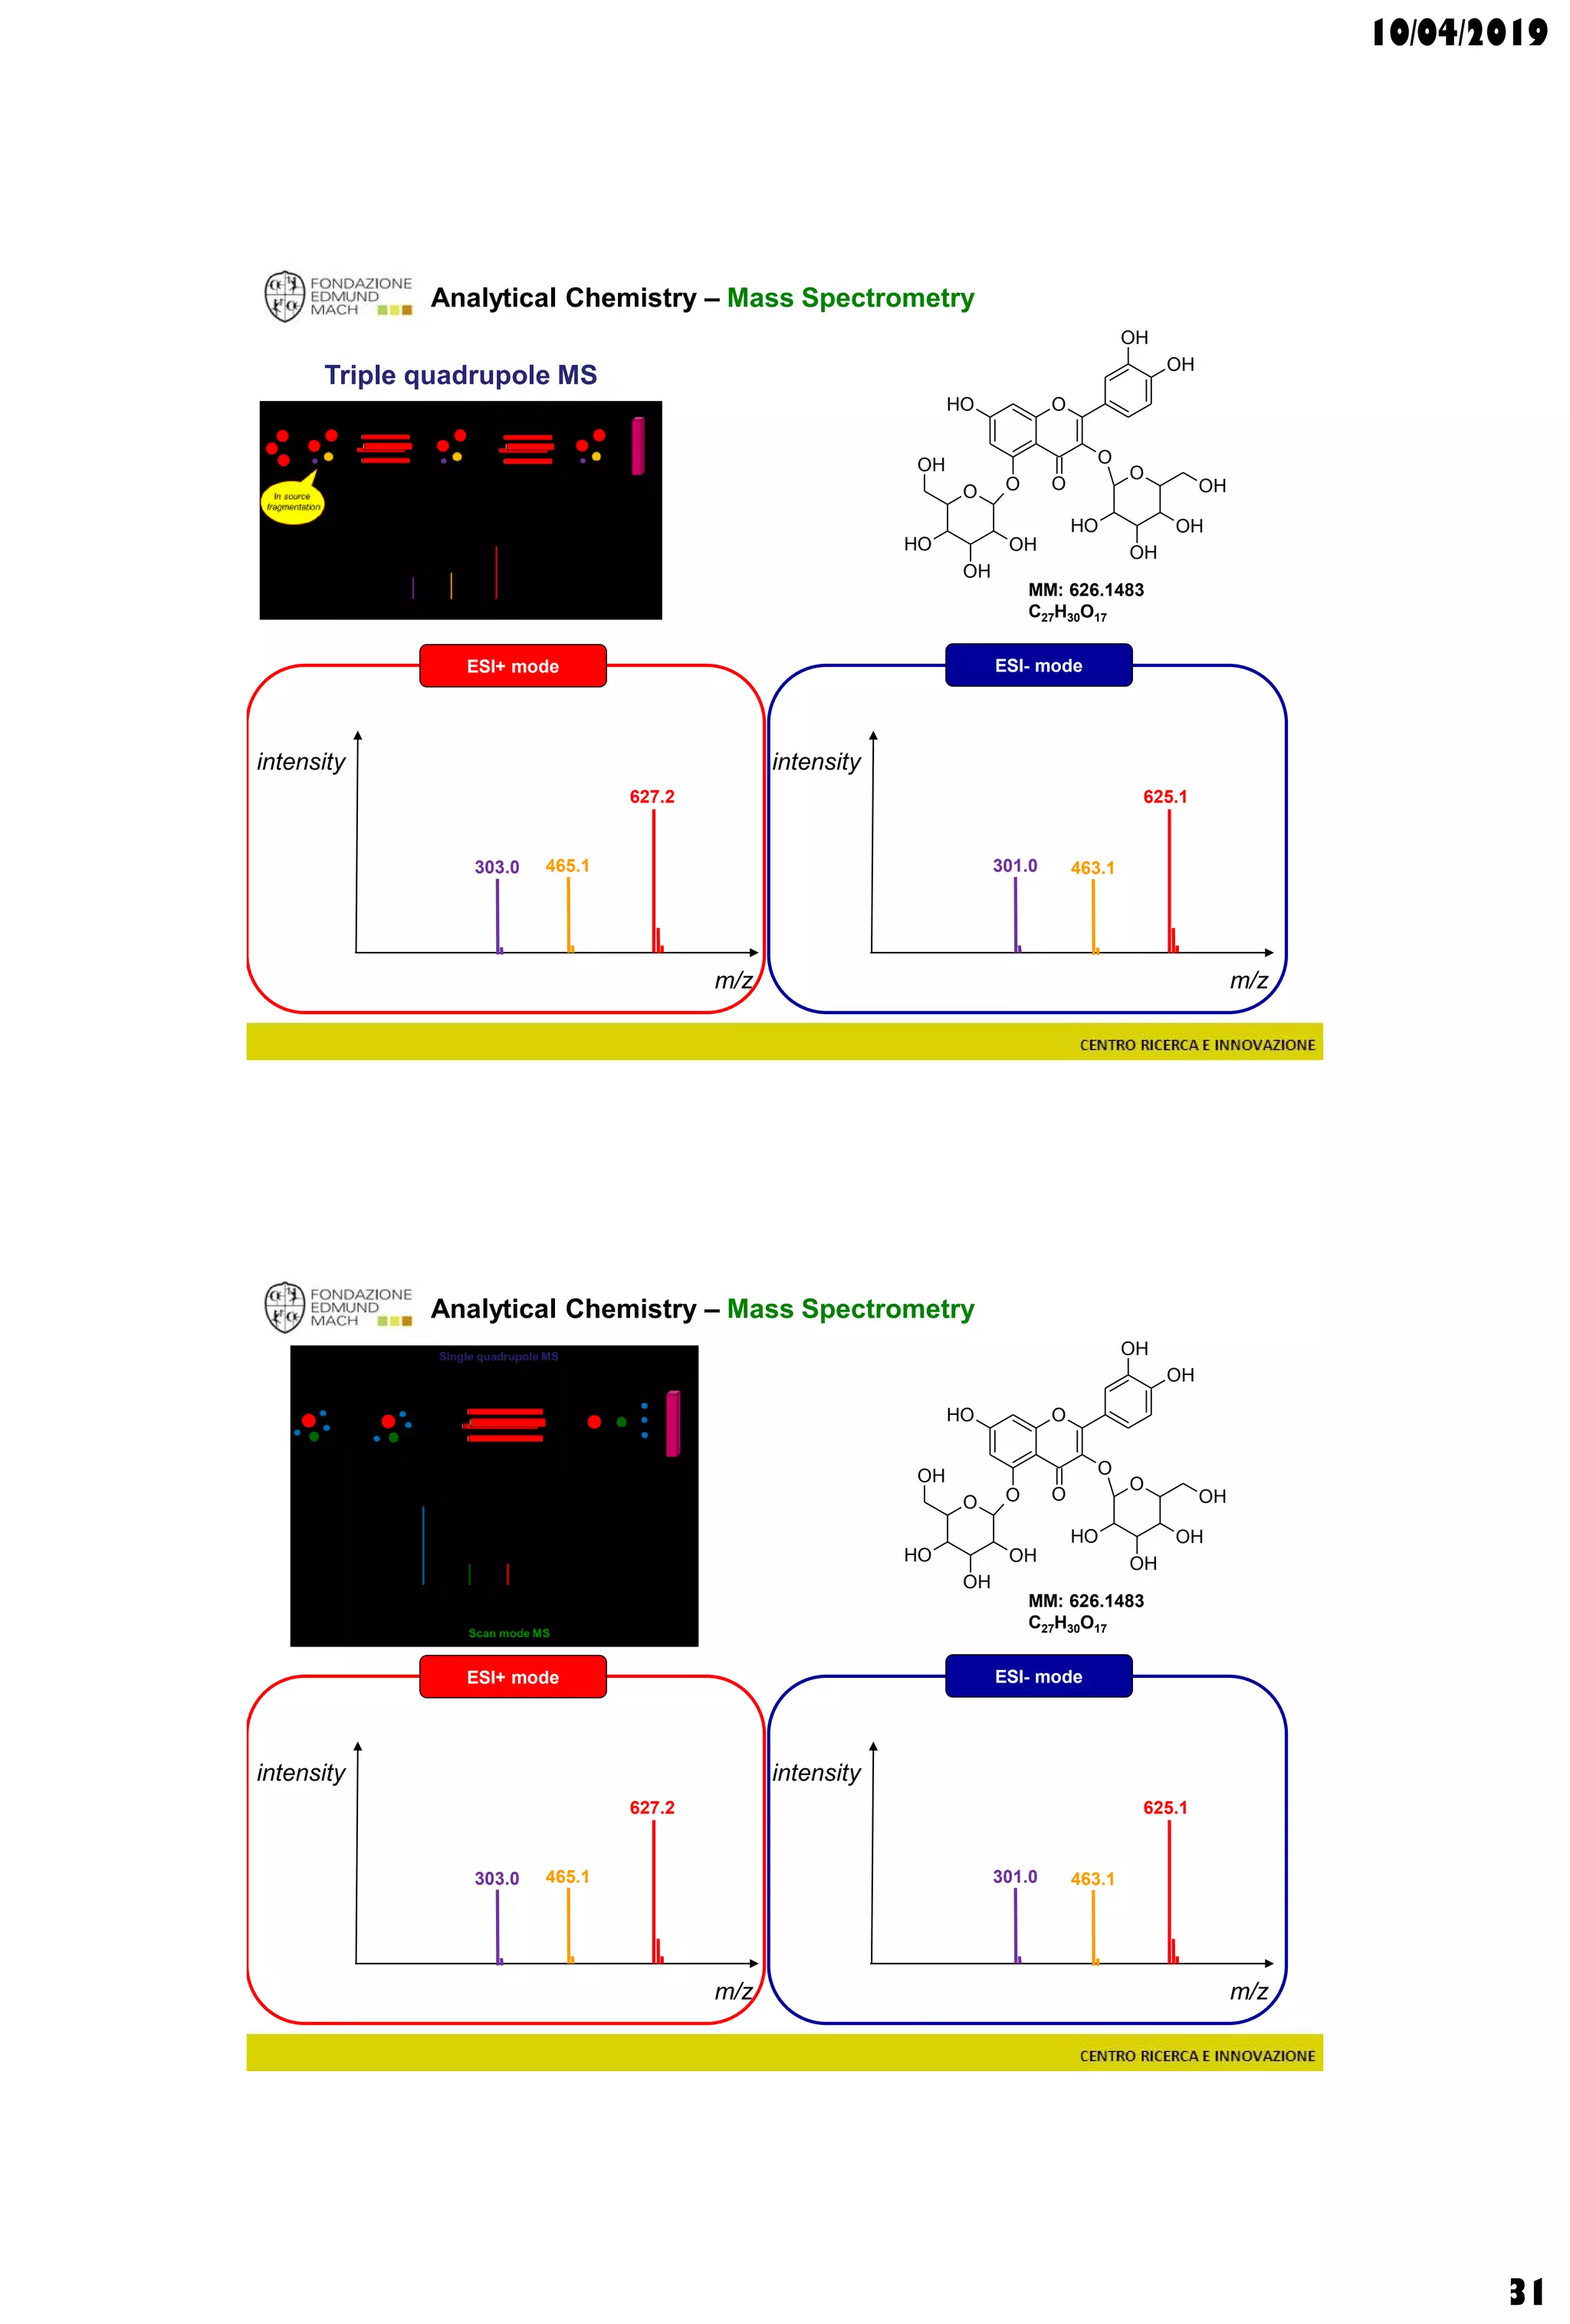
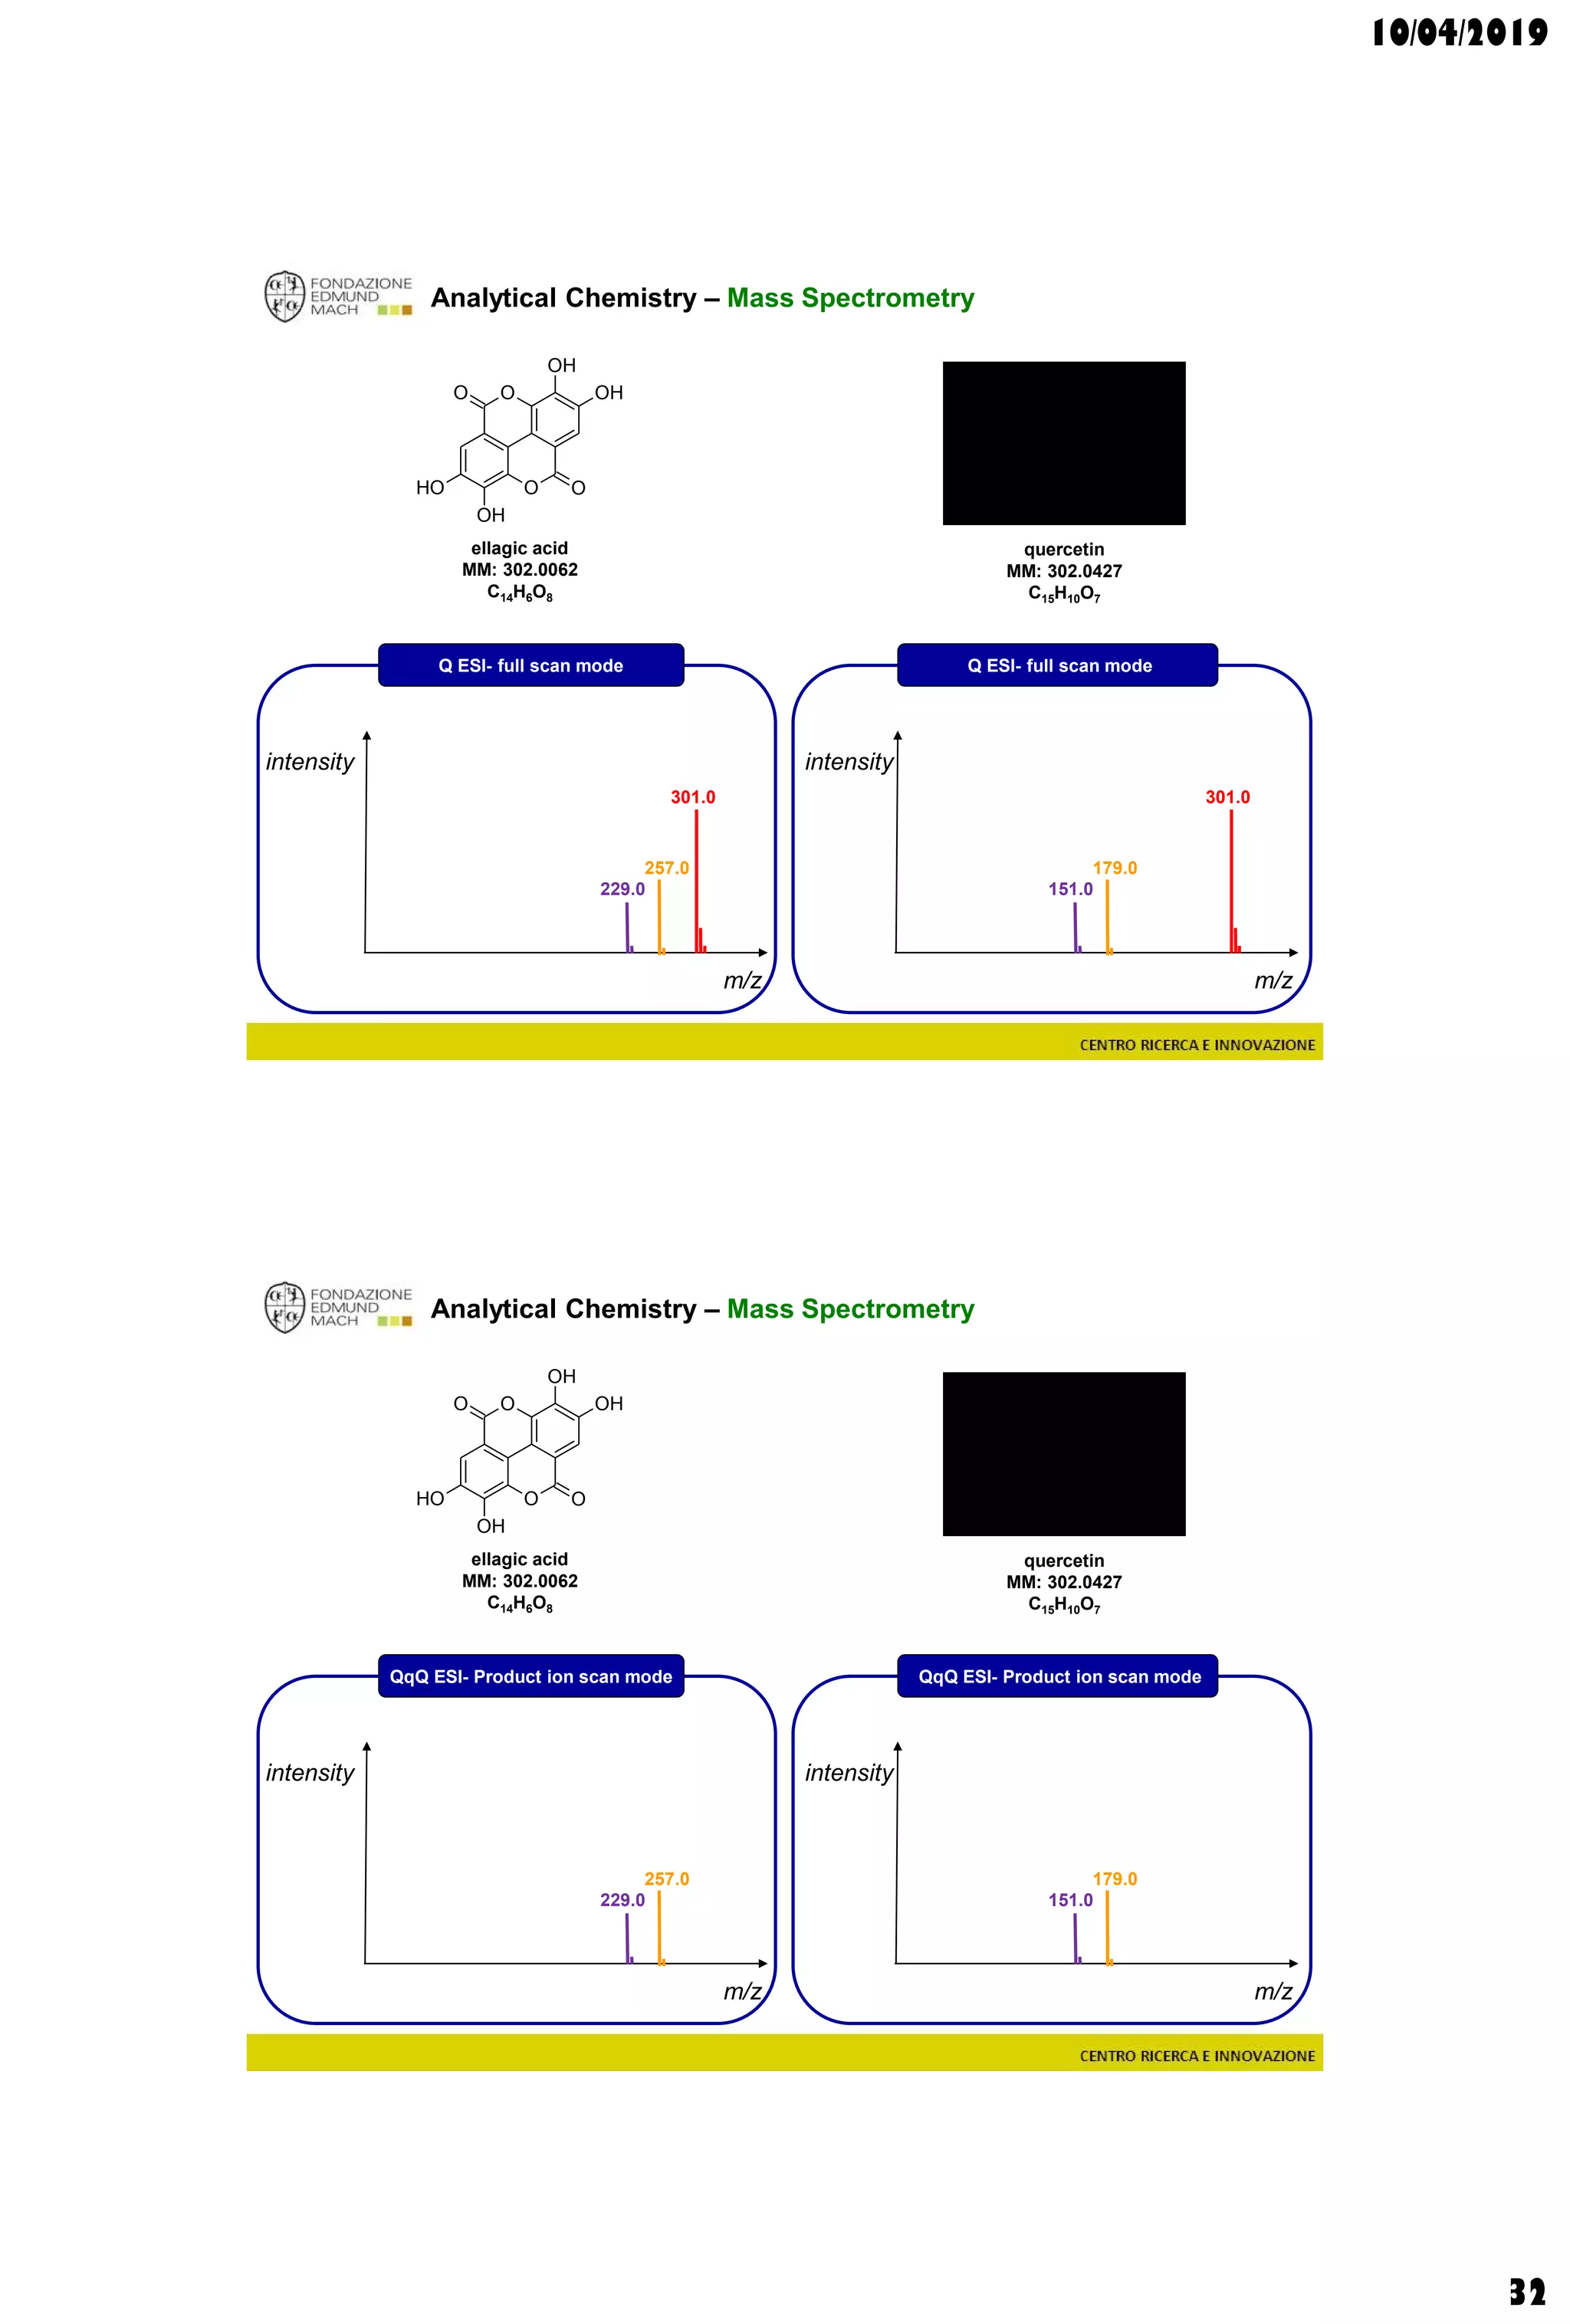
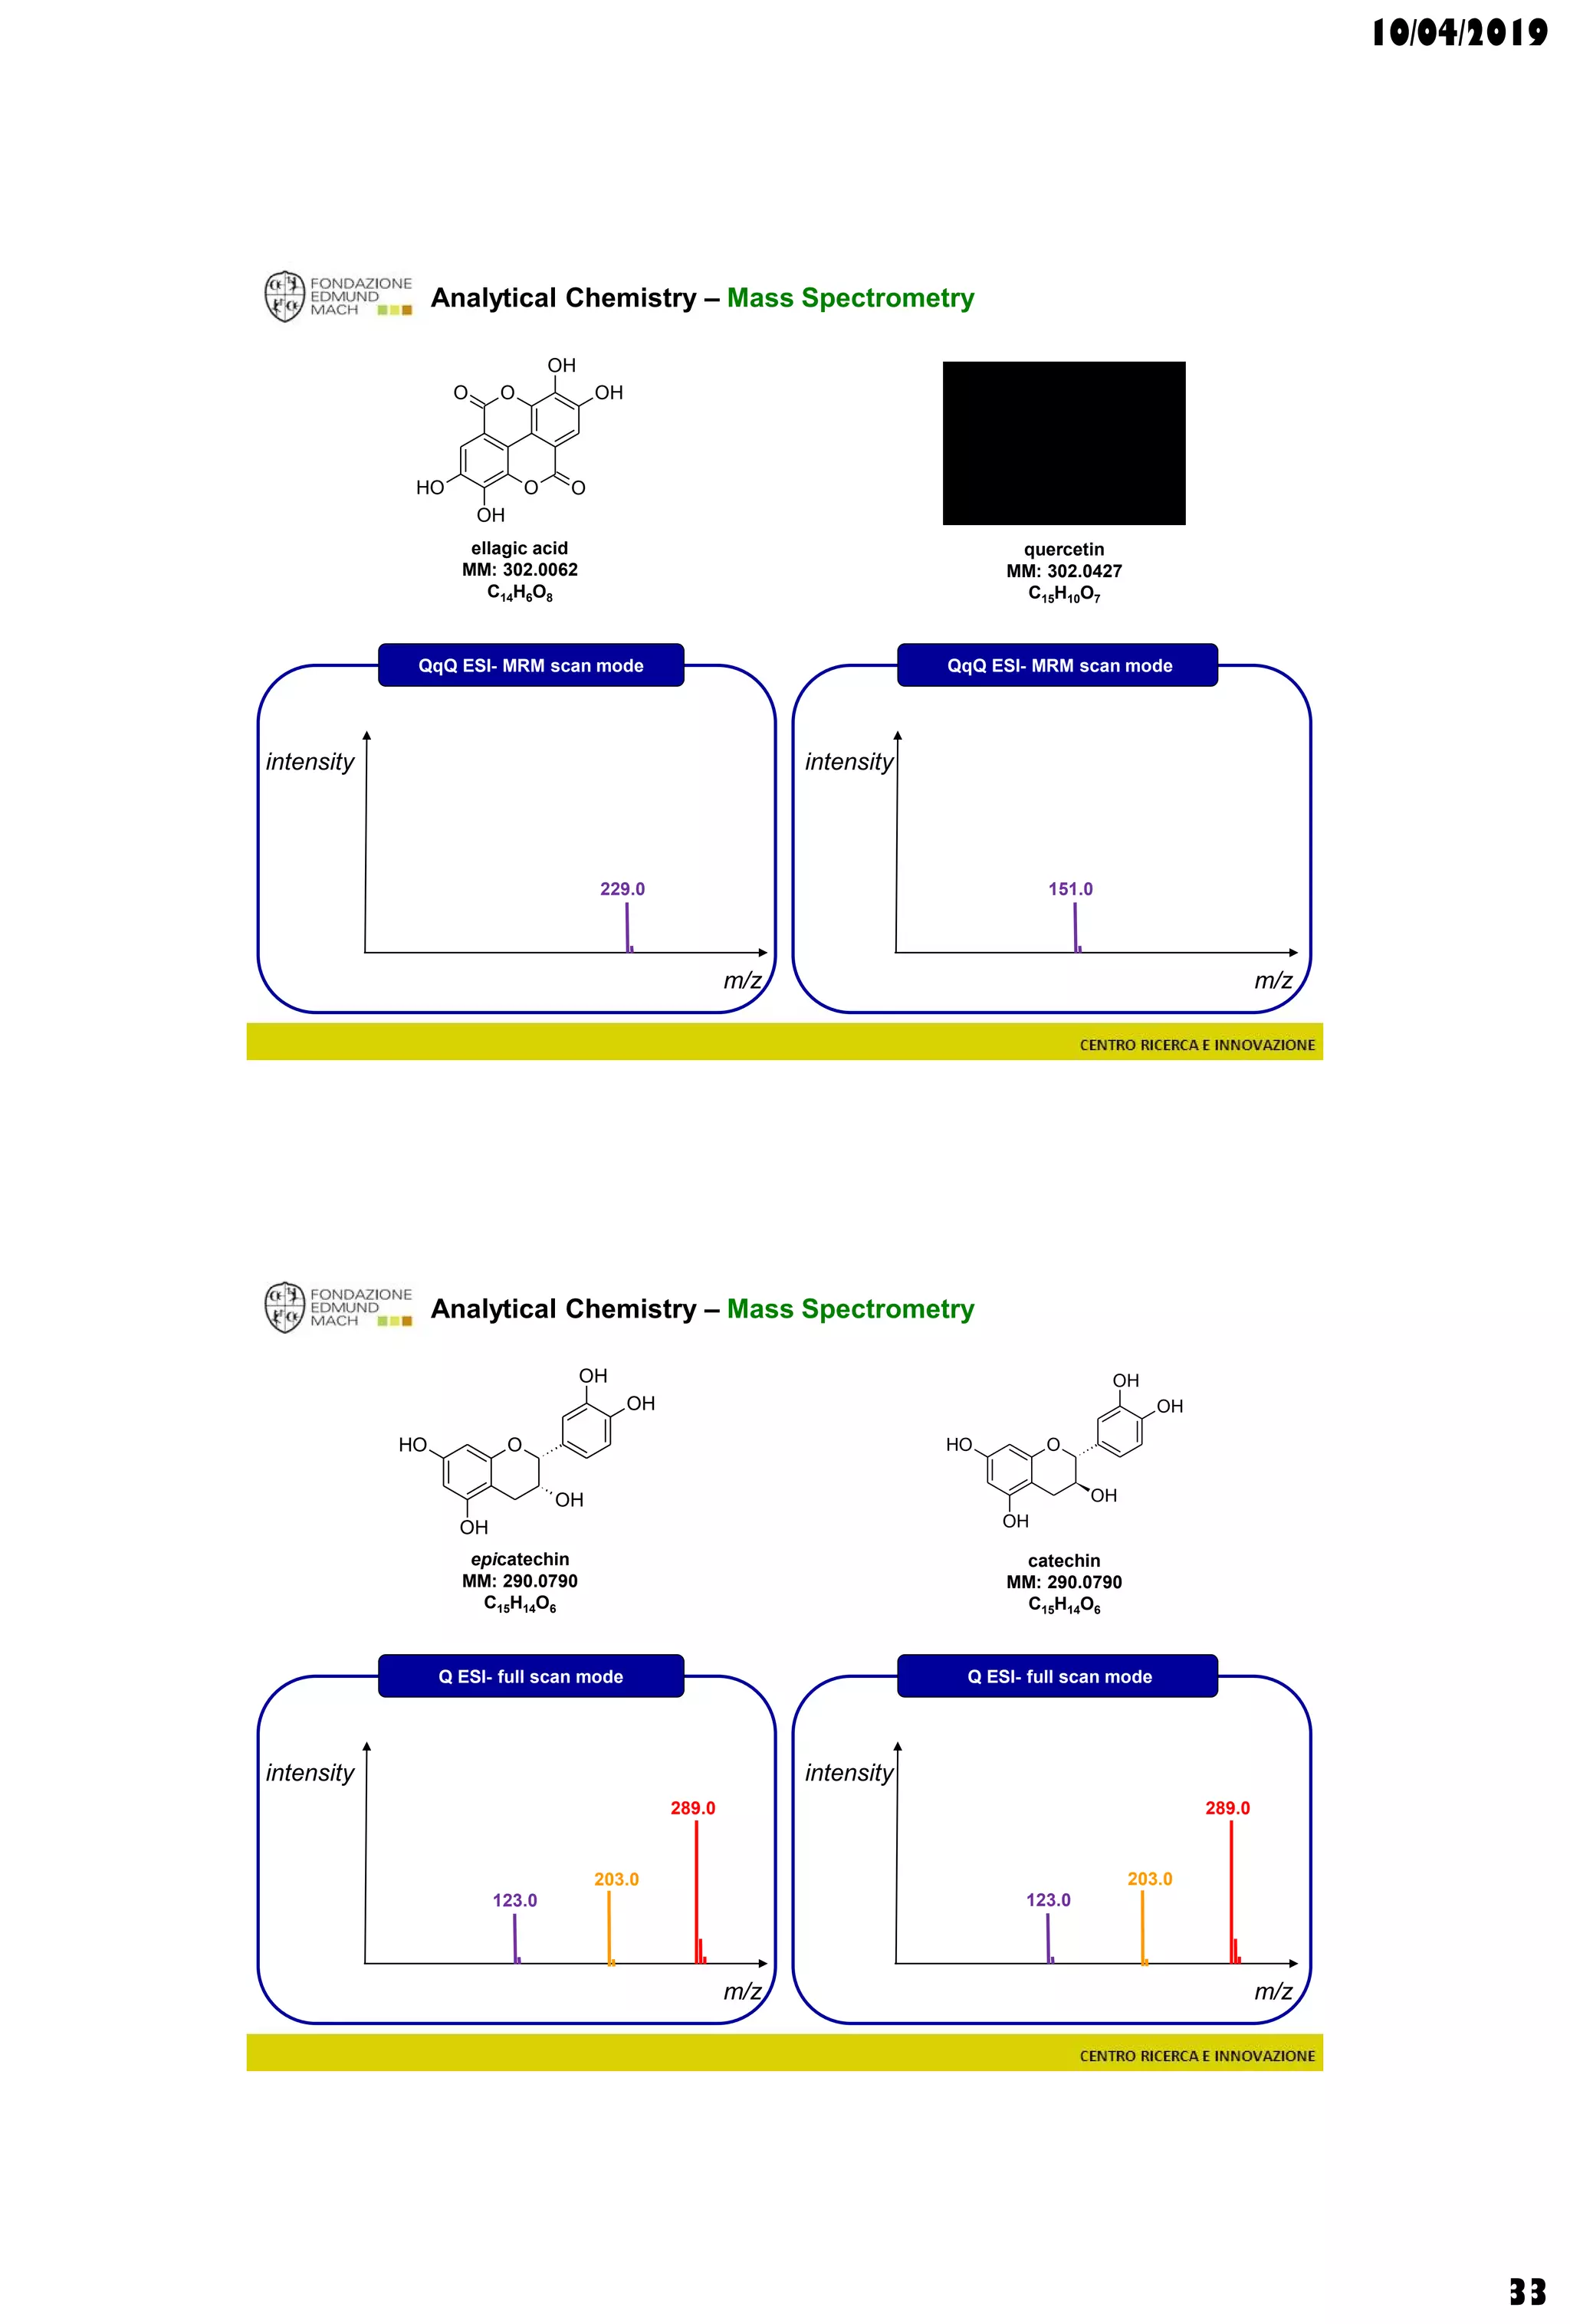
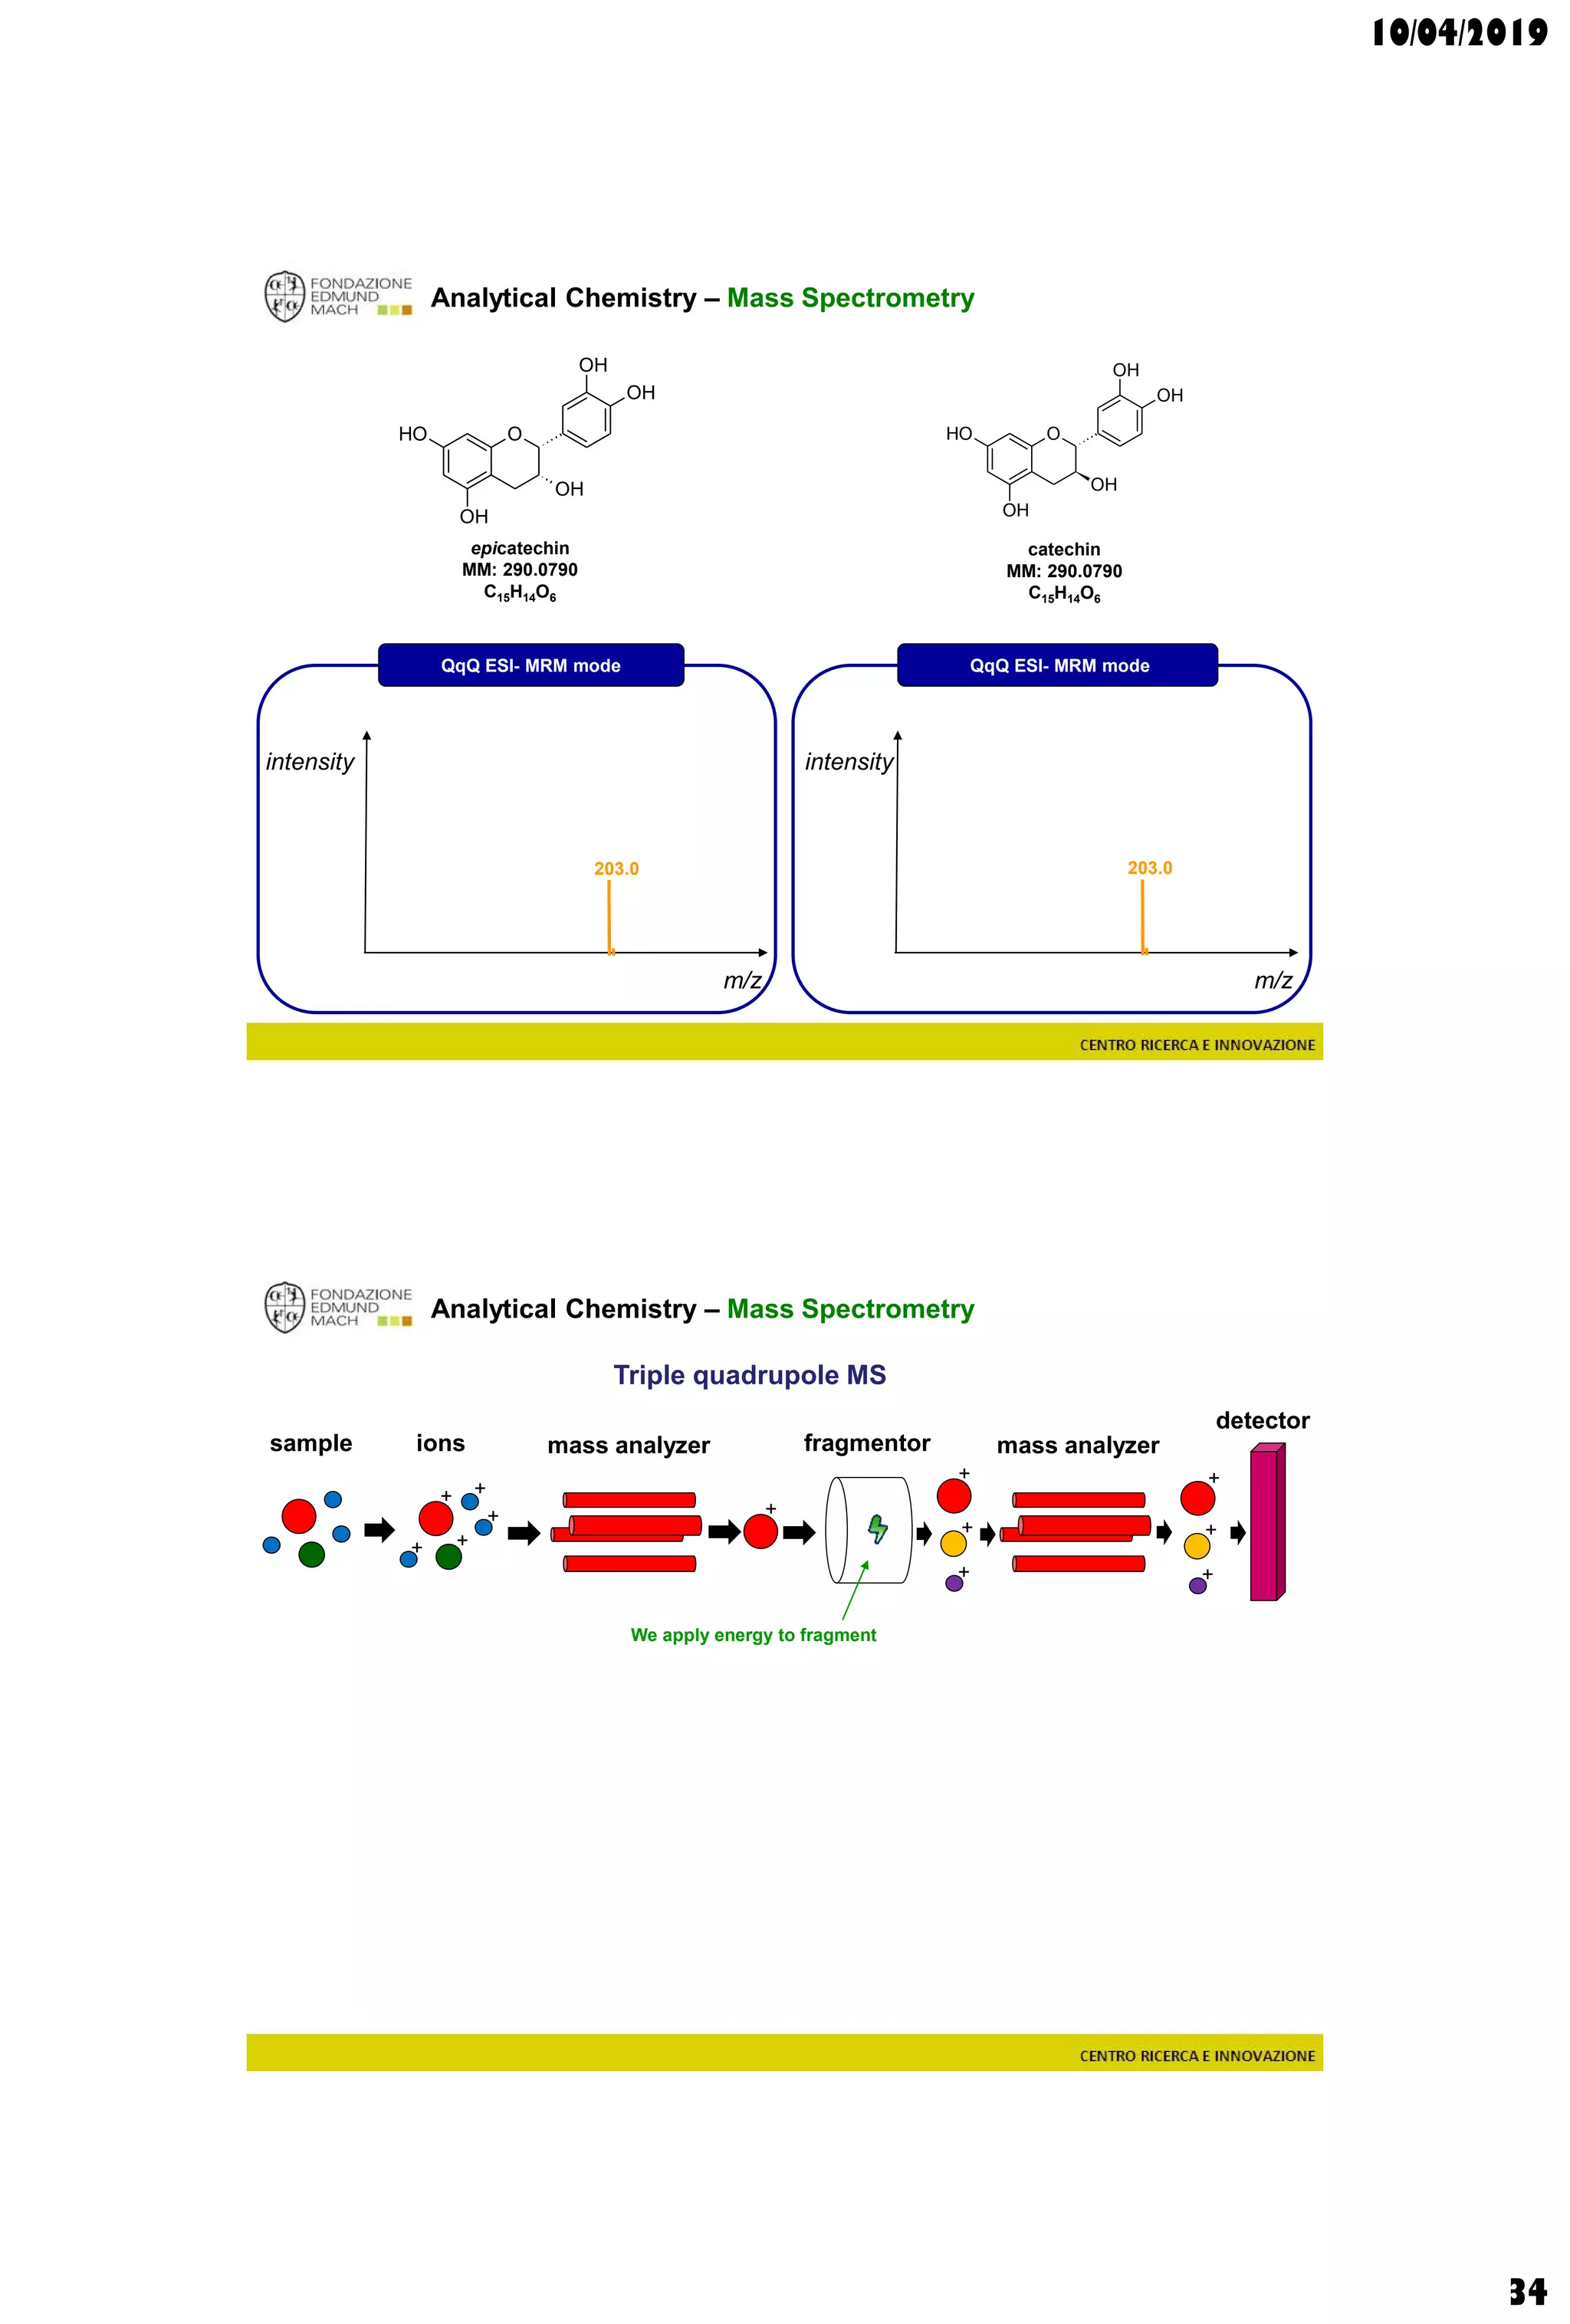
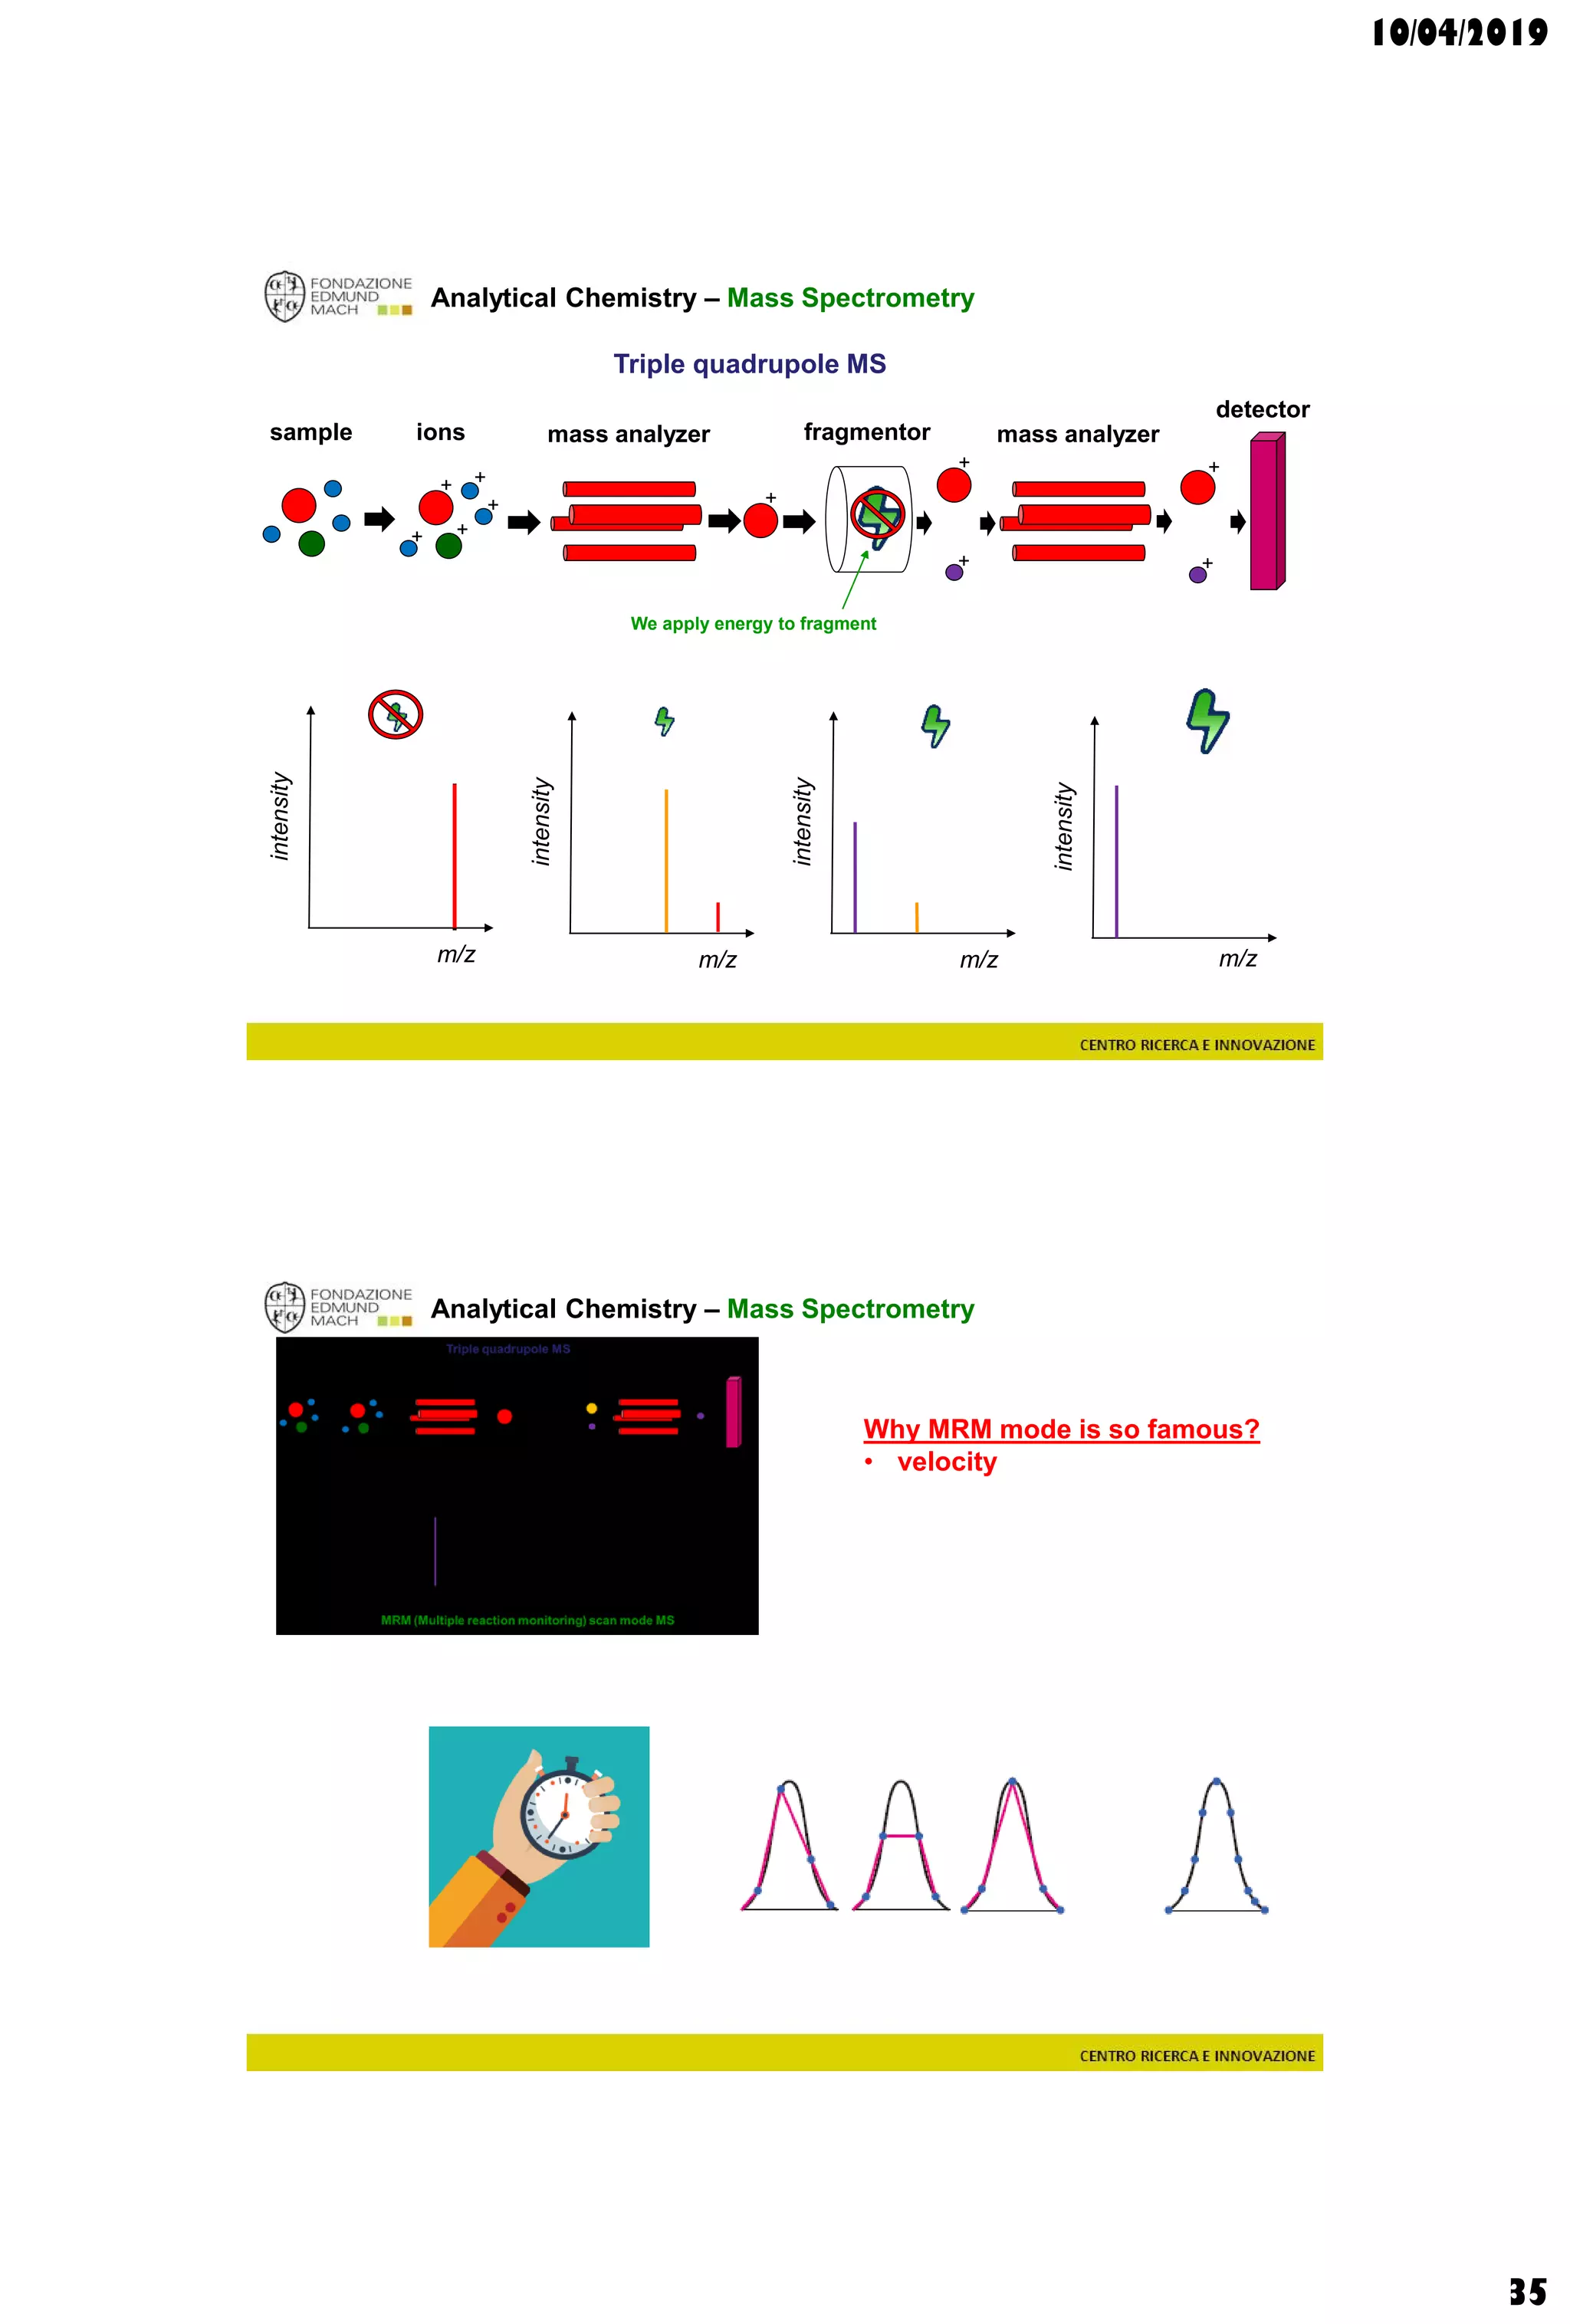
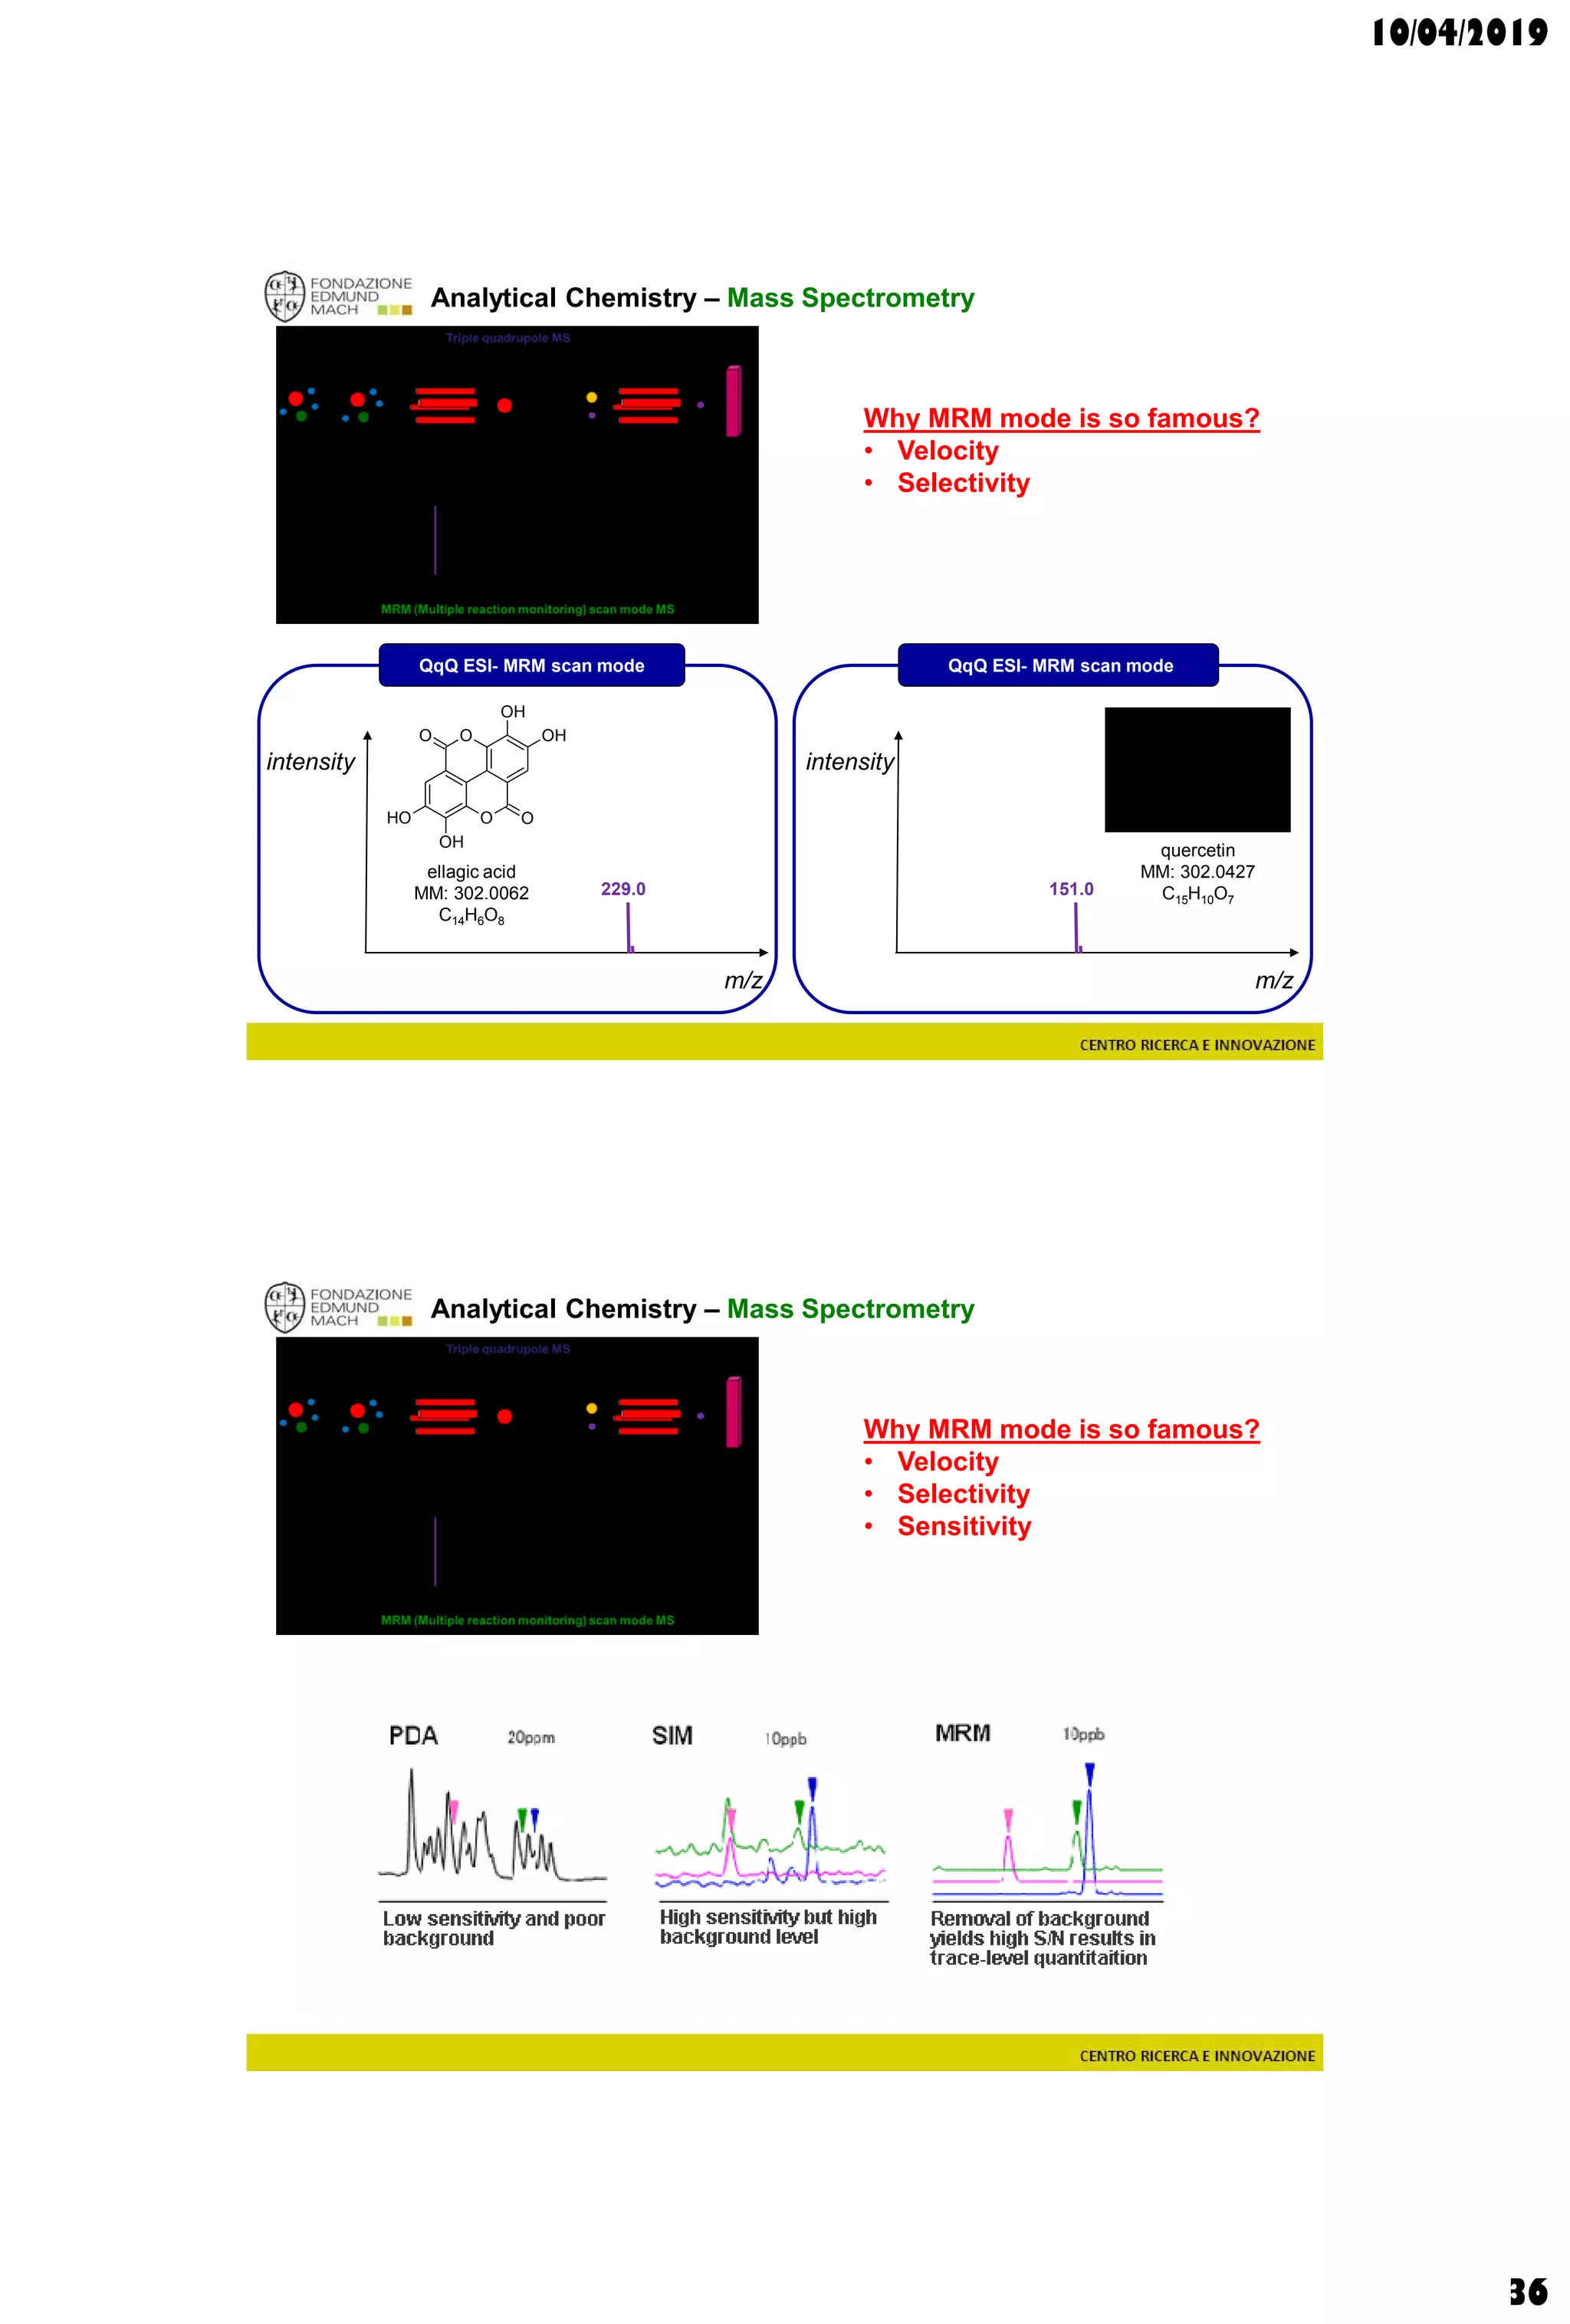
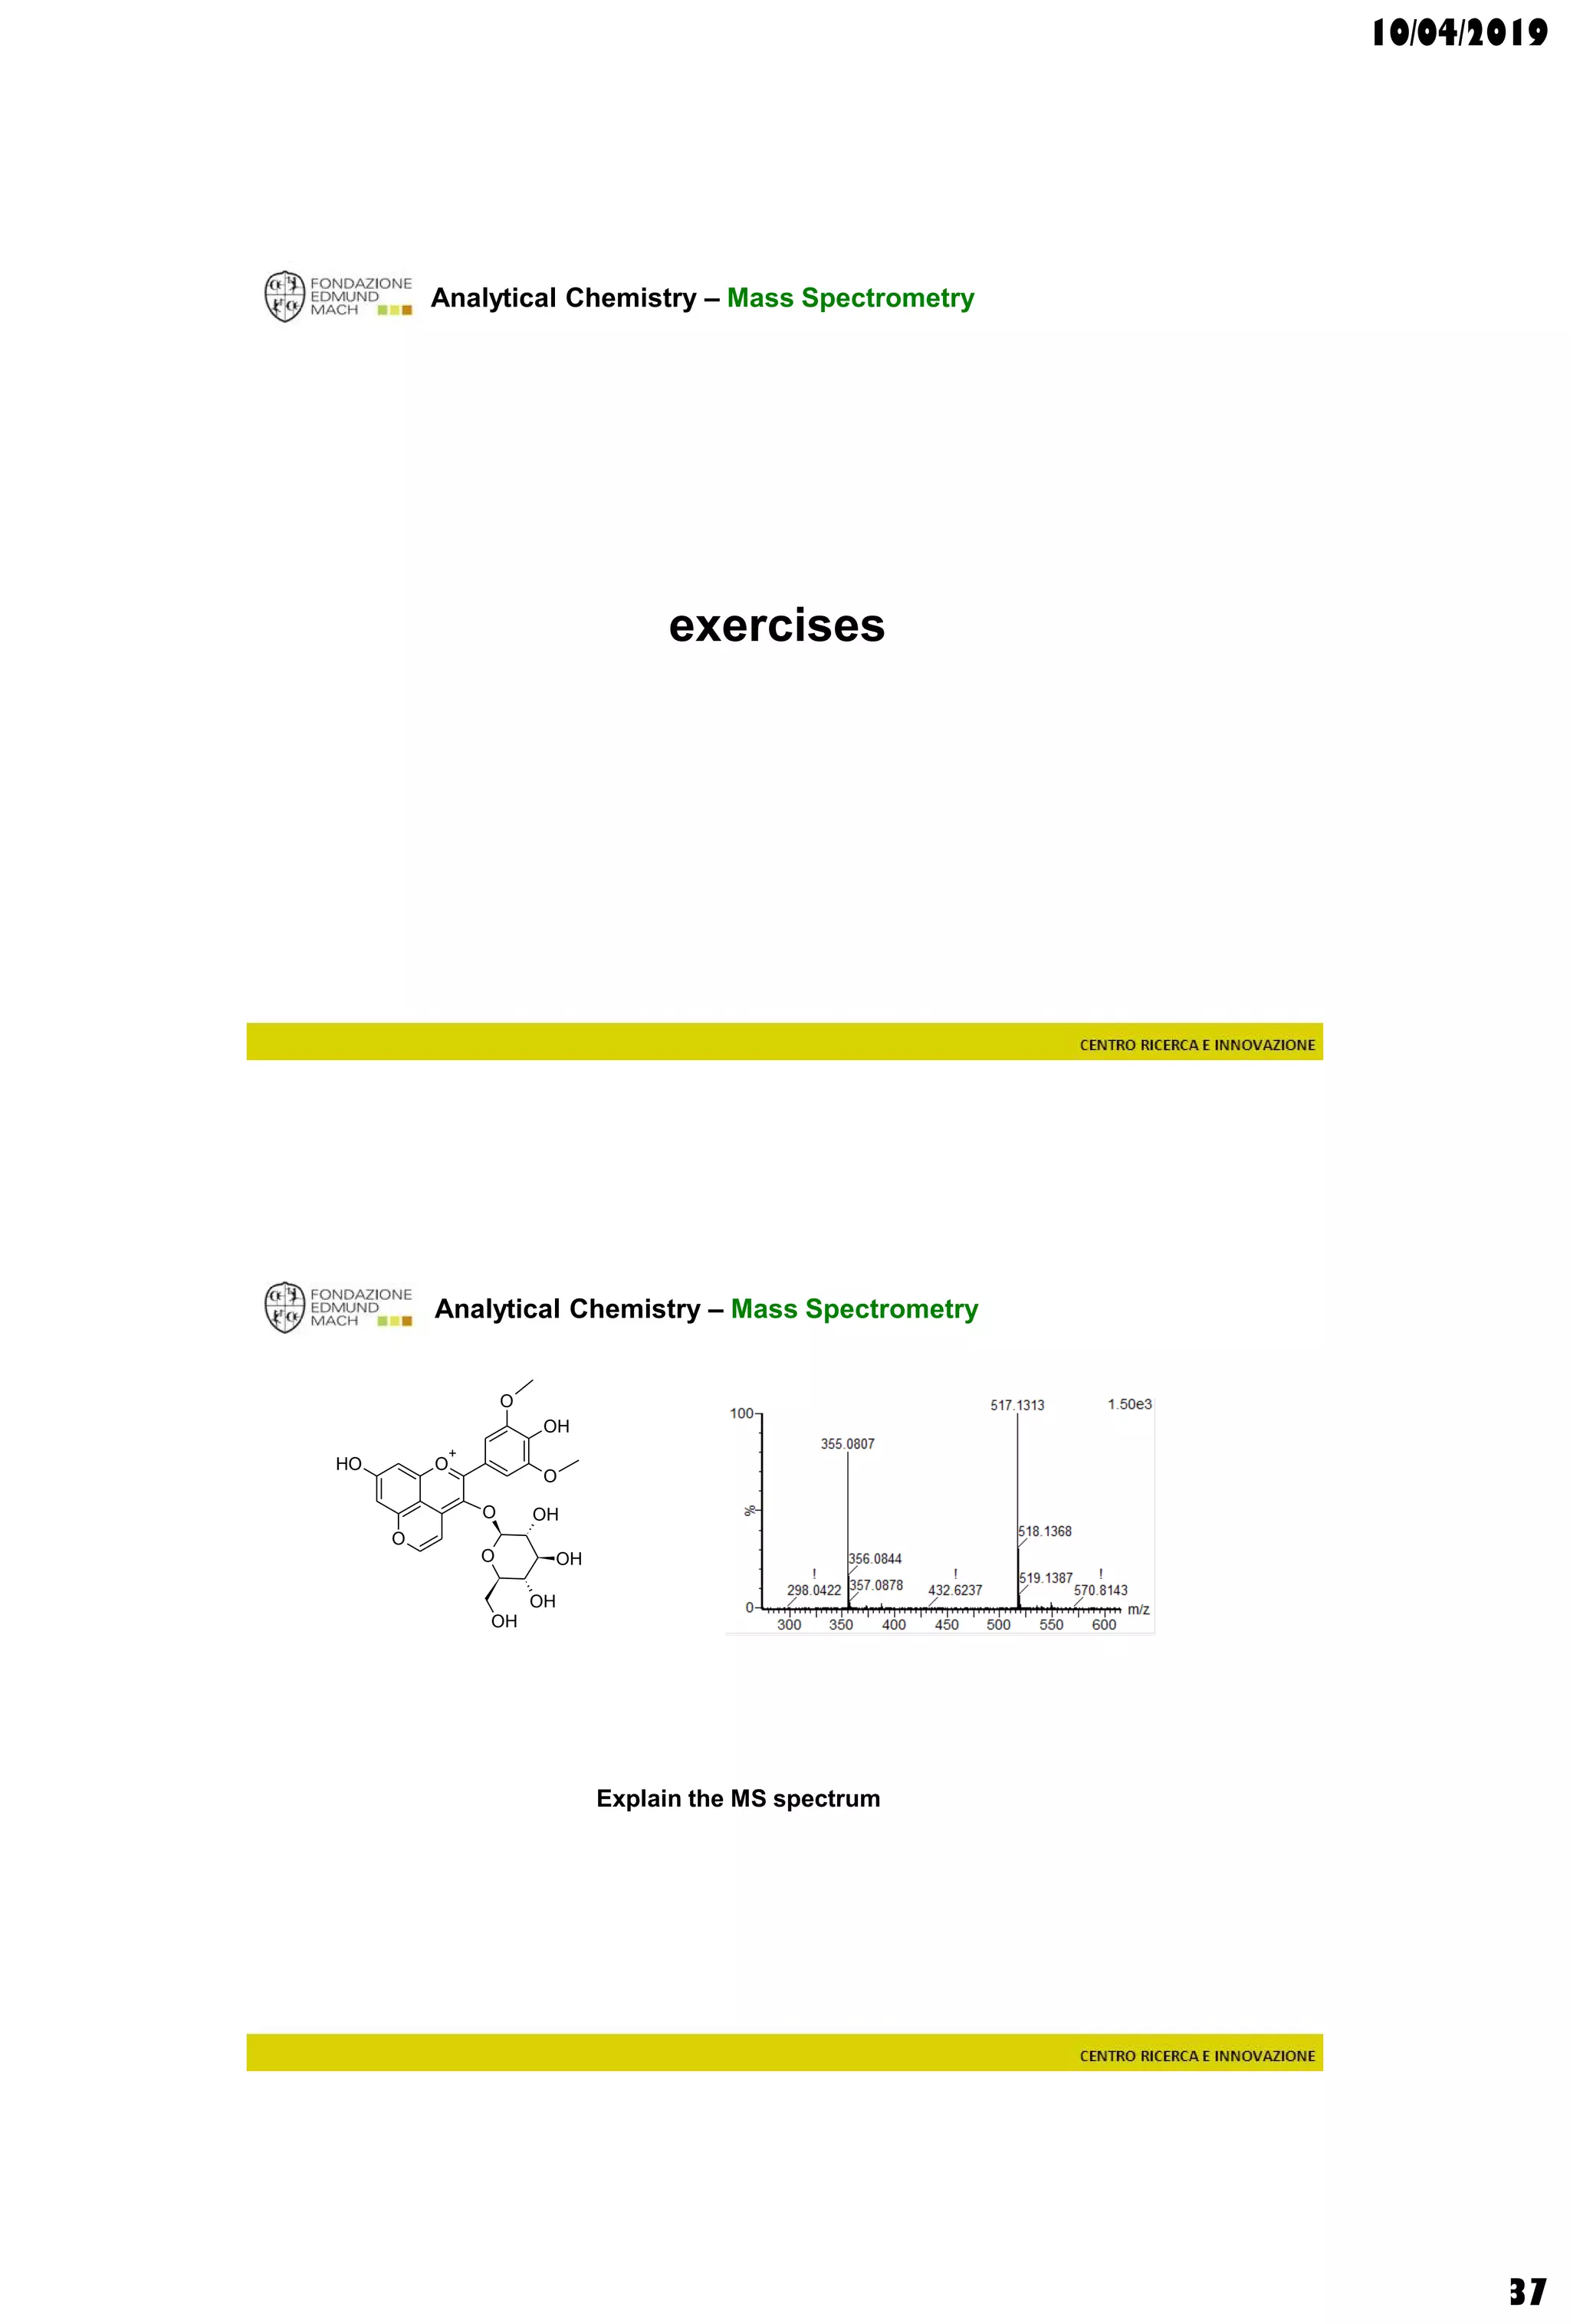
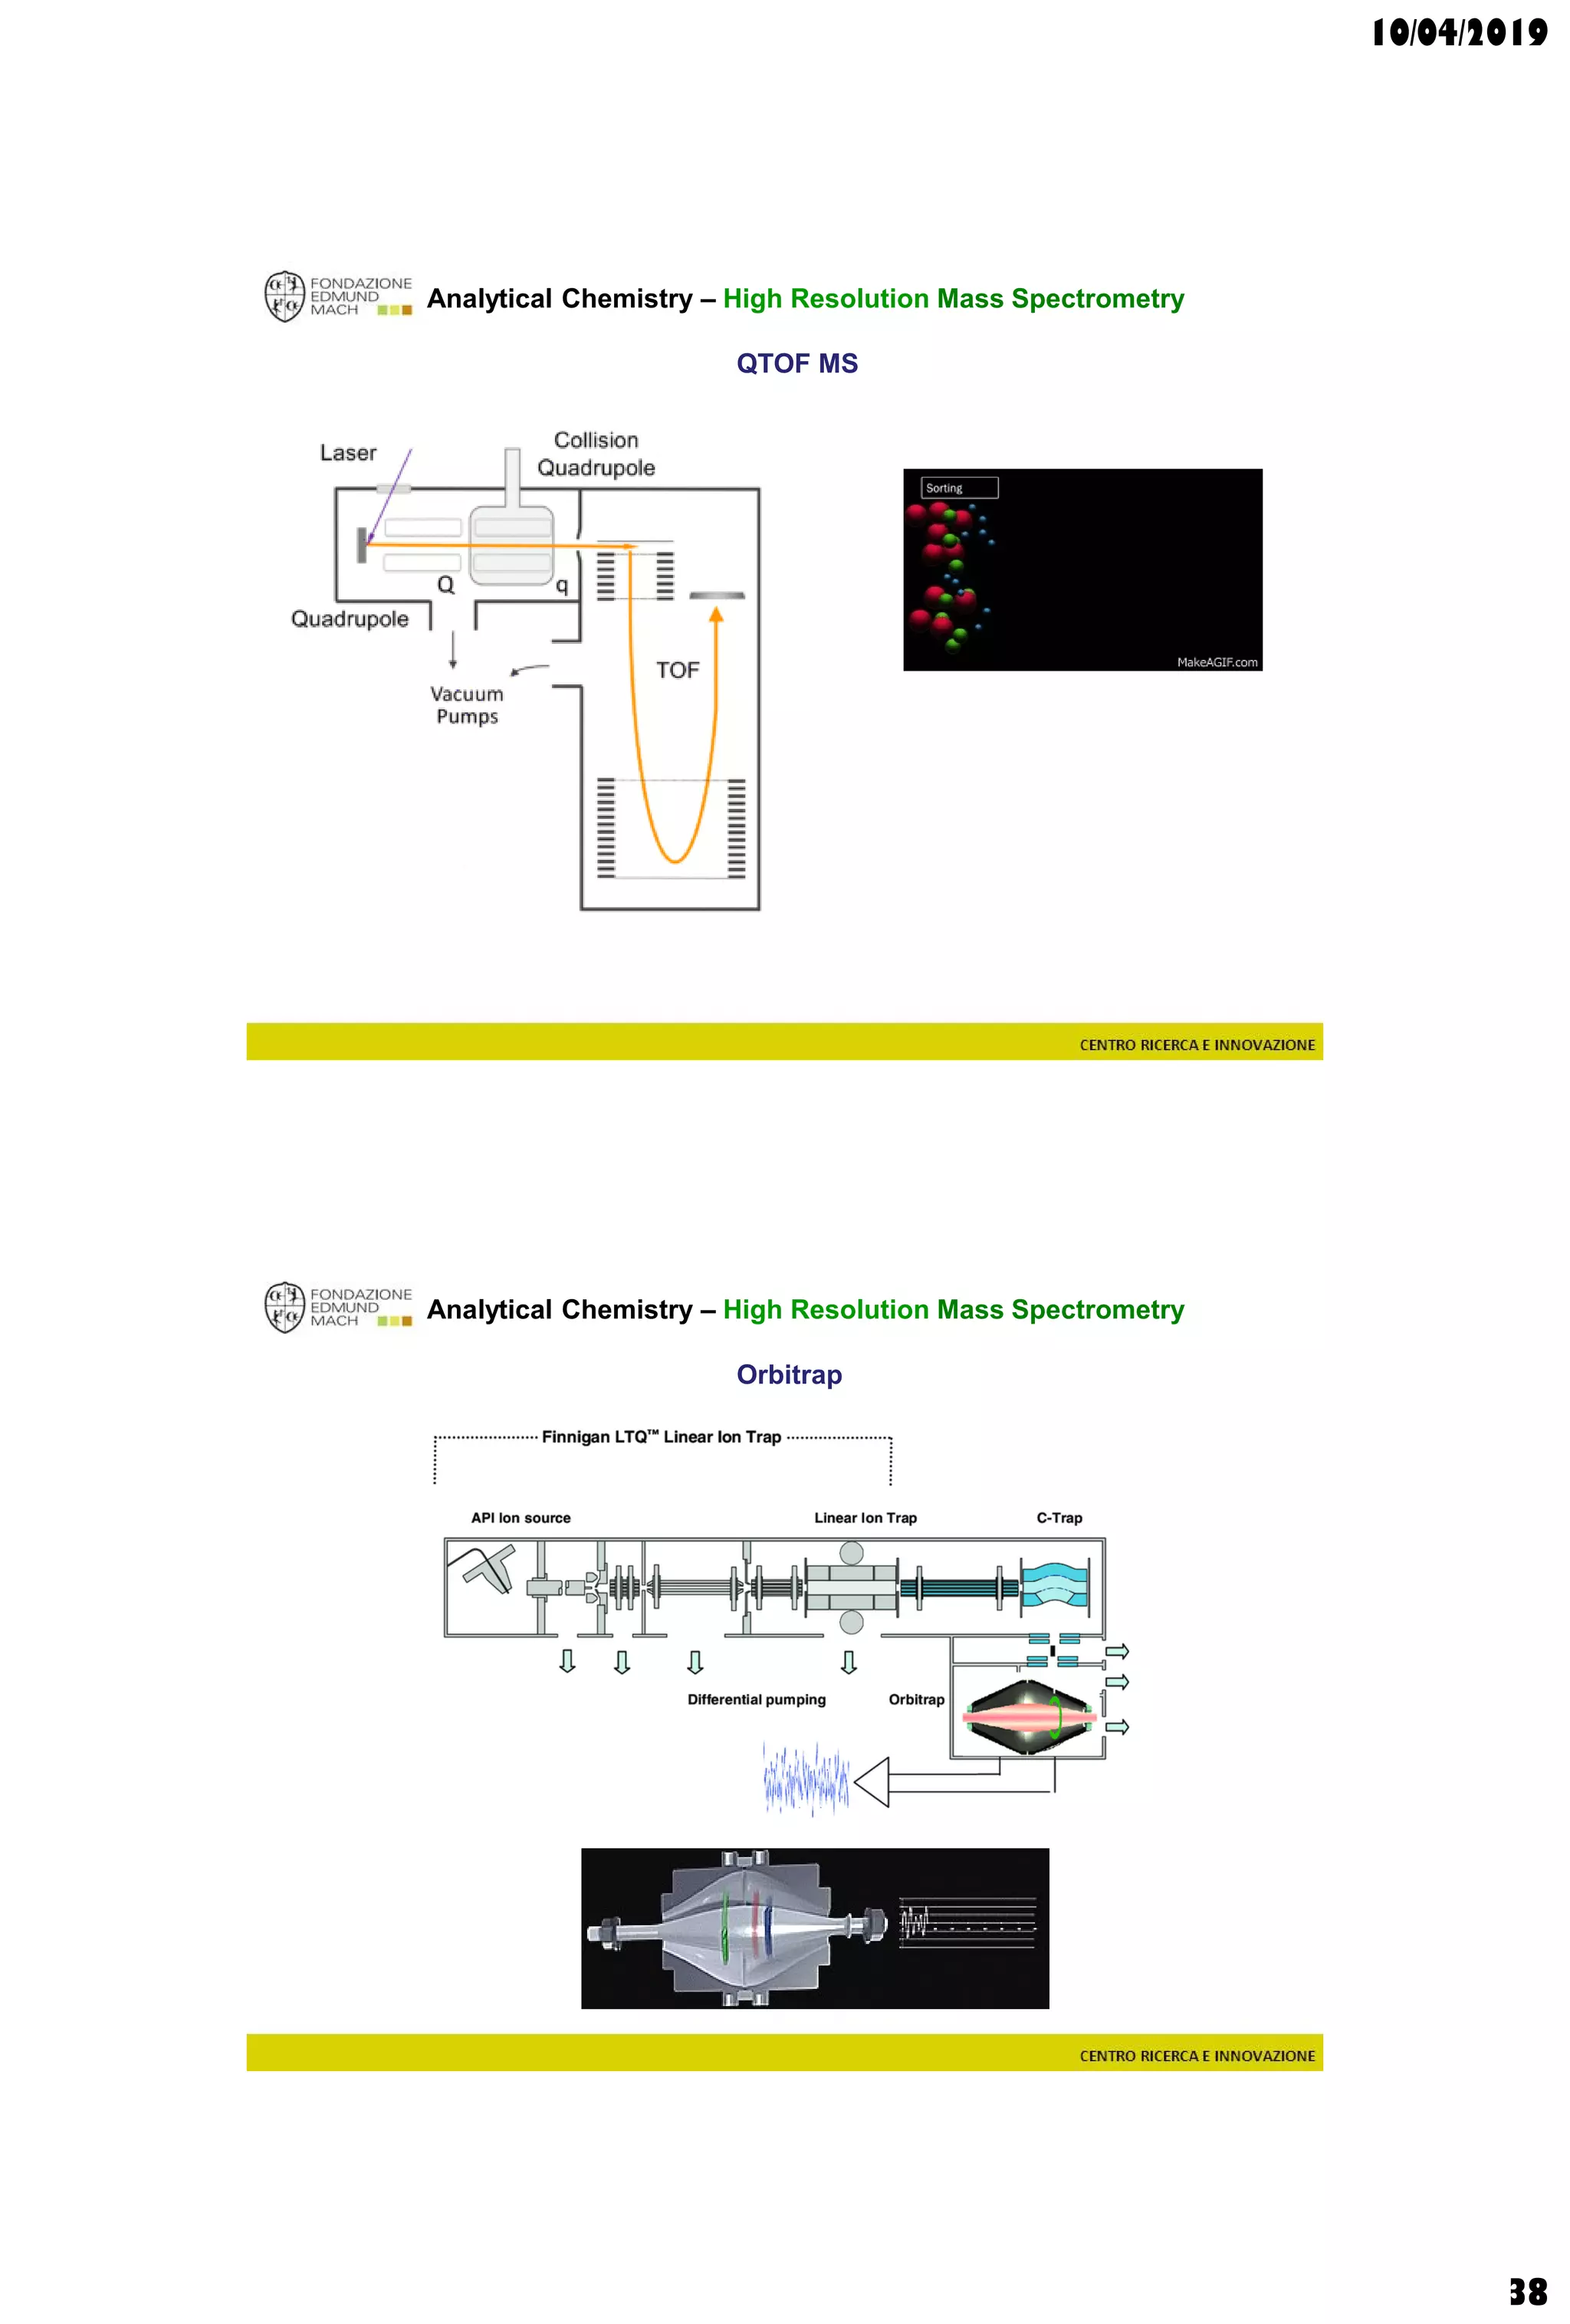
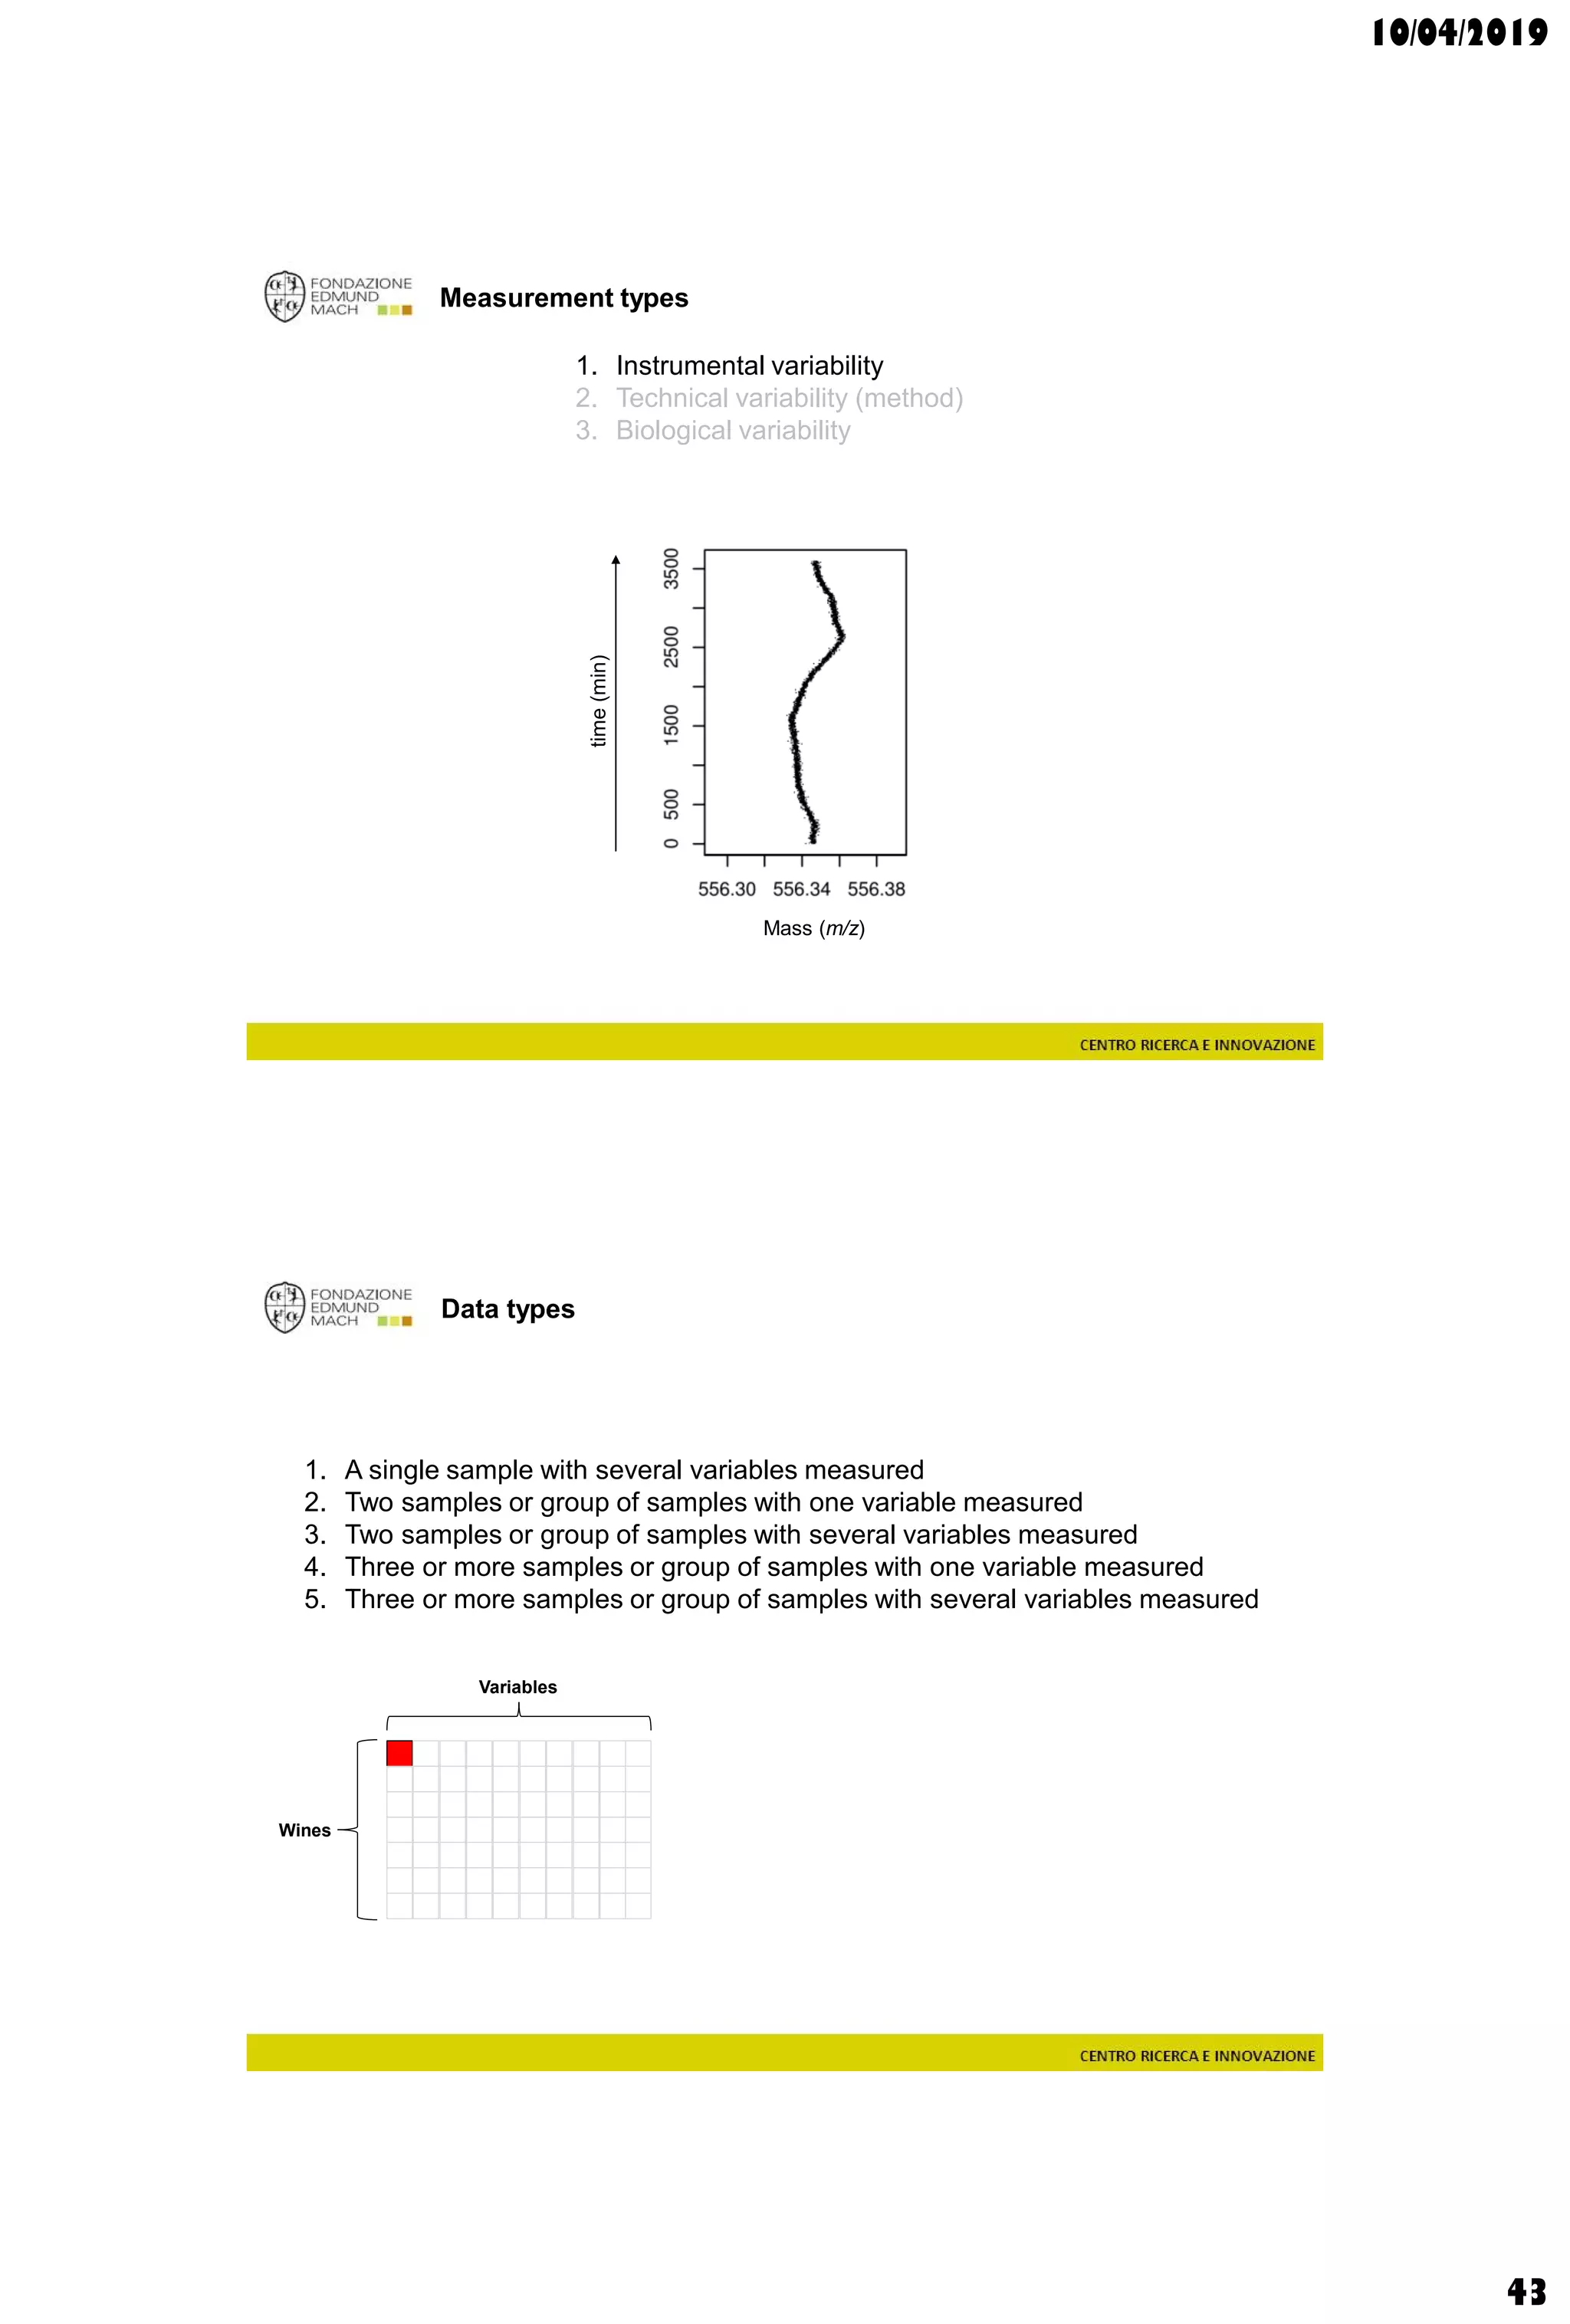
Analytical Chemistry – Mass Spectrometry
m/z
intensity
analyte ions mass analyzer
detector
mass analyzer
+
+
+
In source
fragmentation
+
+
+
+
+
+
+
+ +
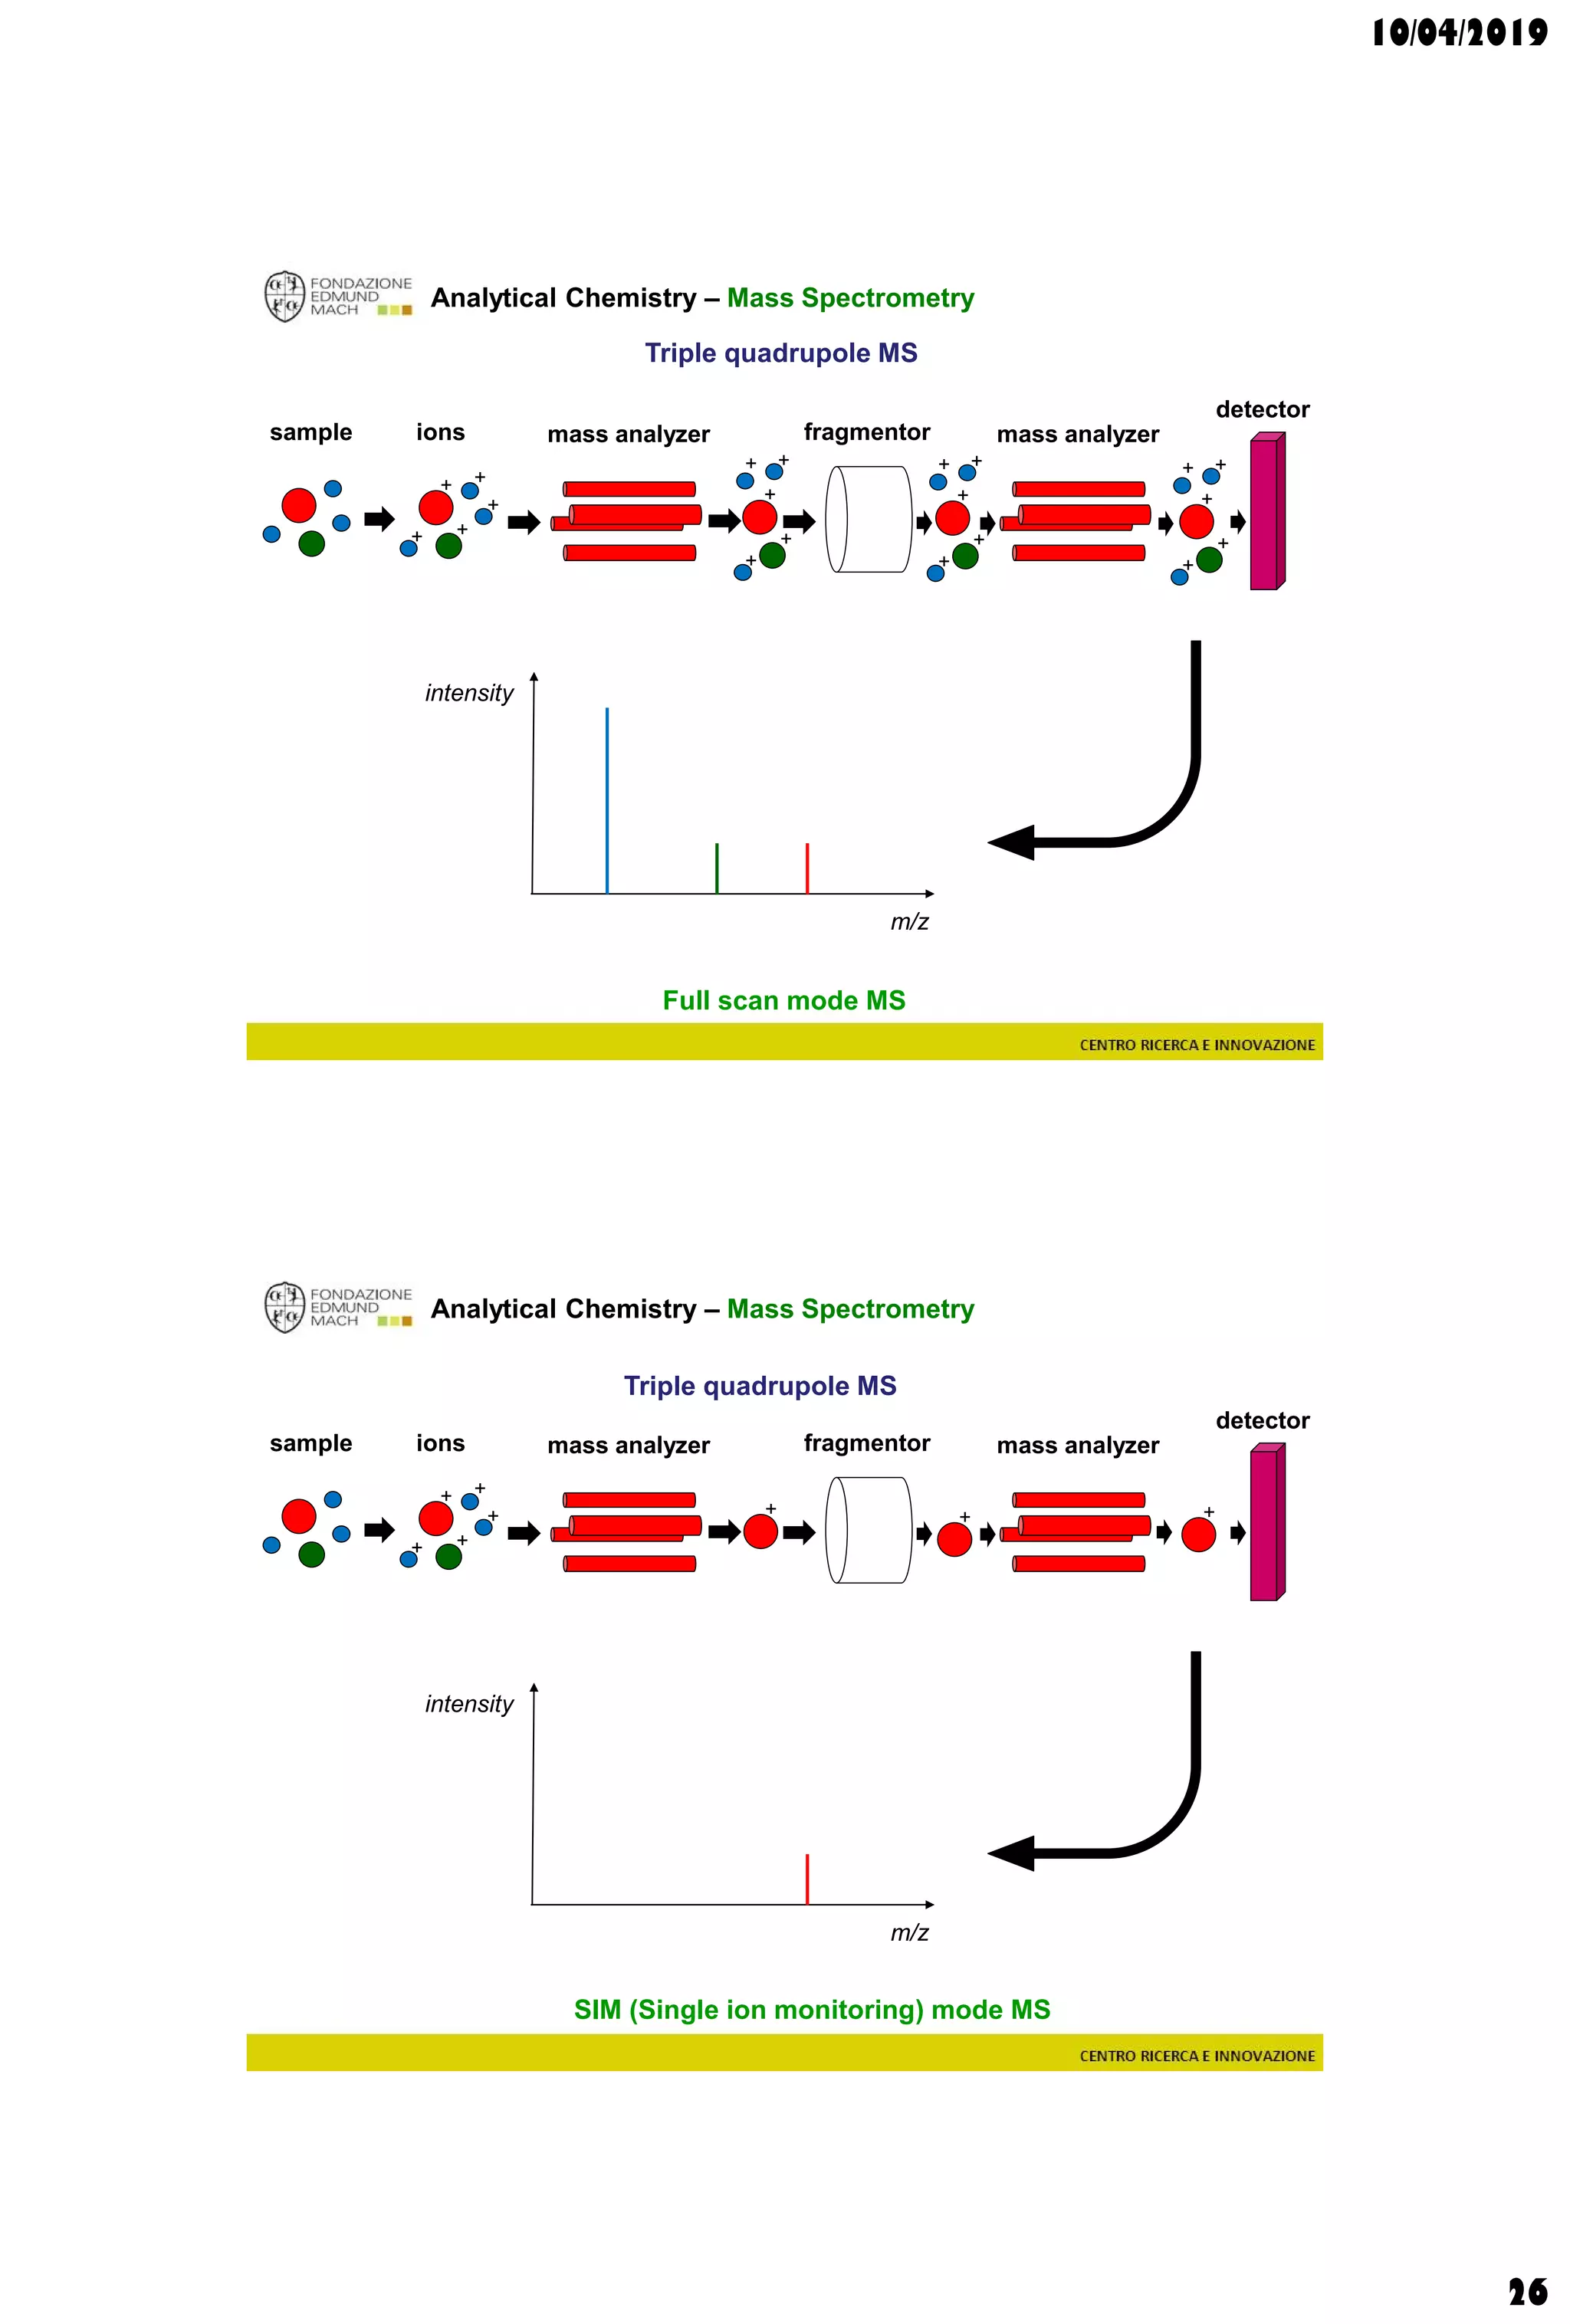
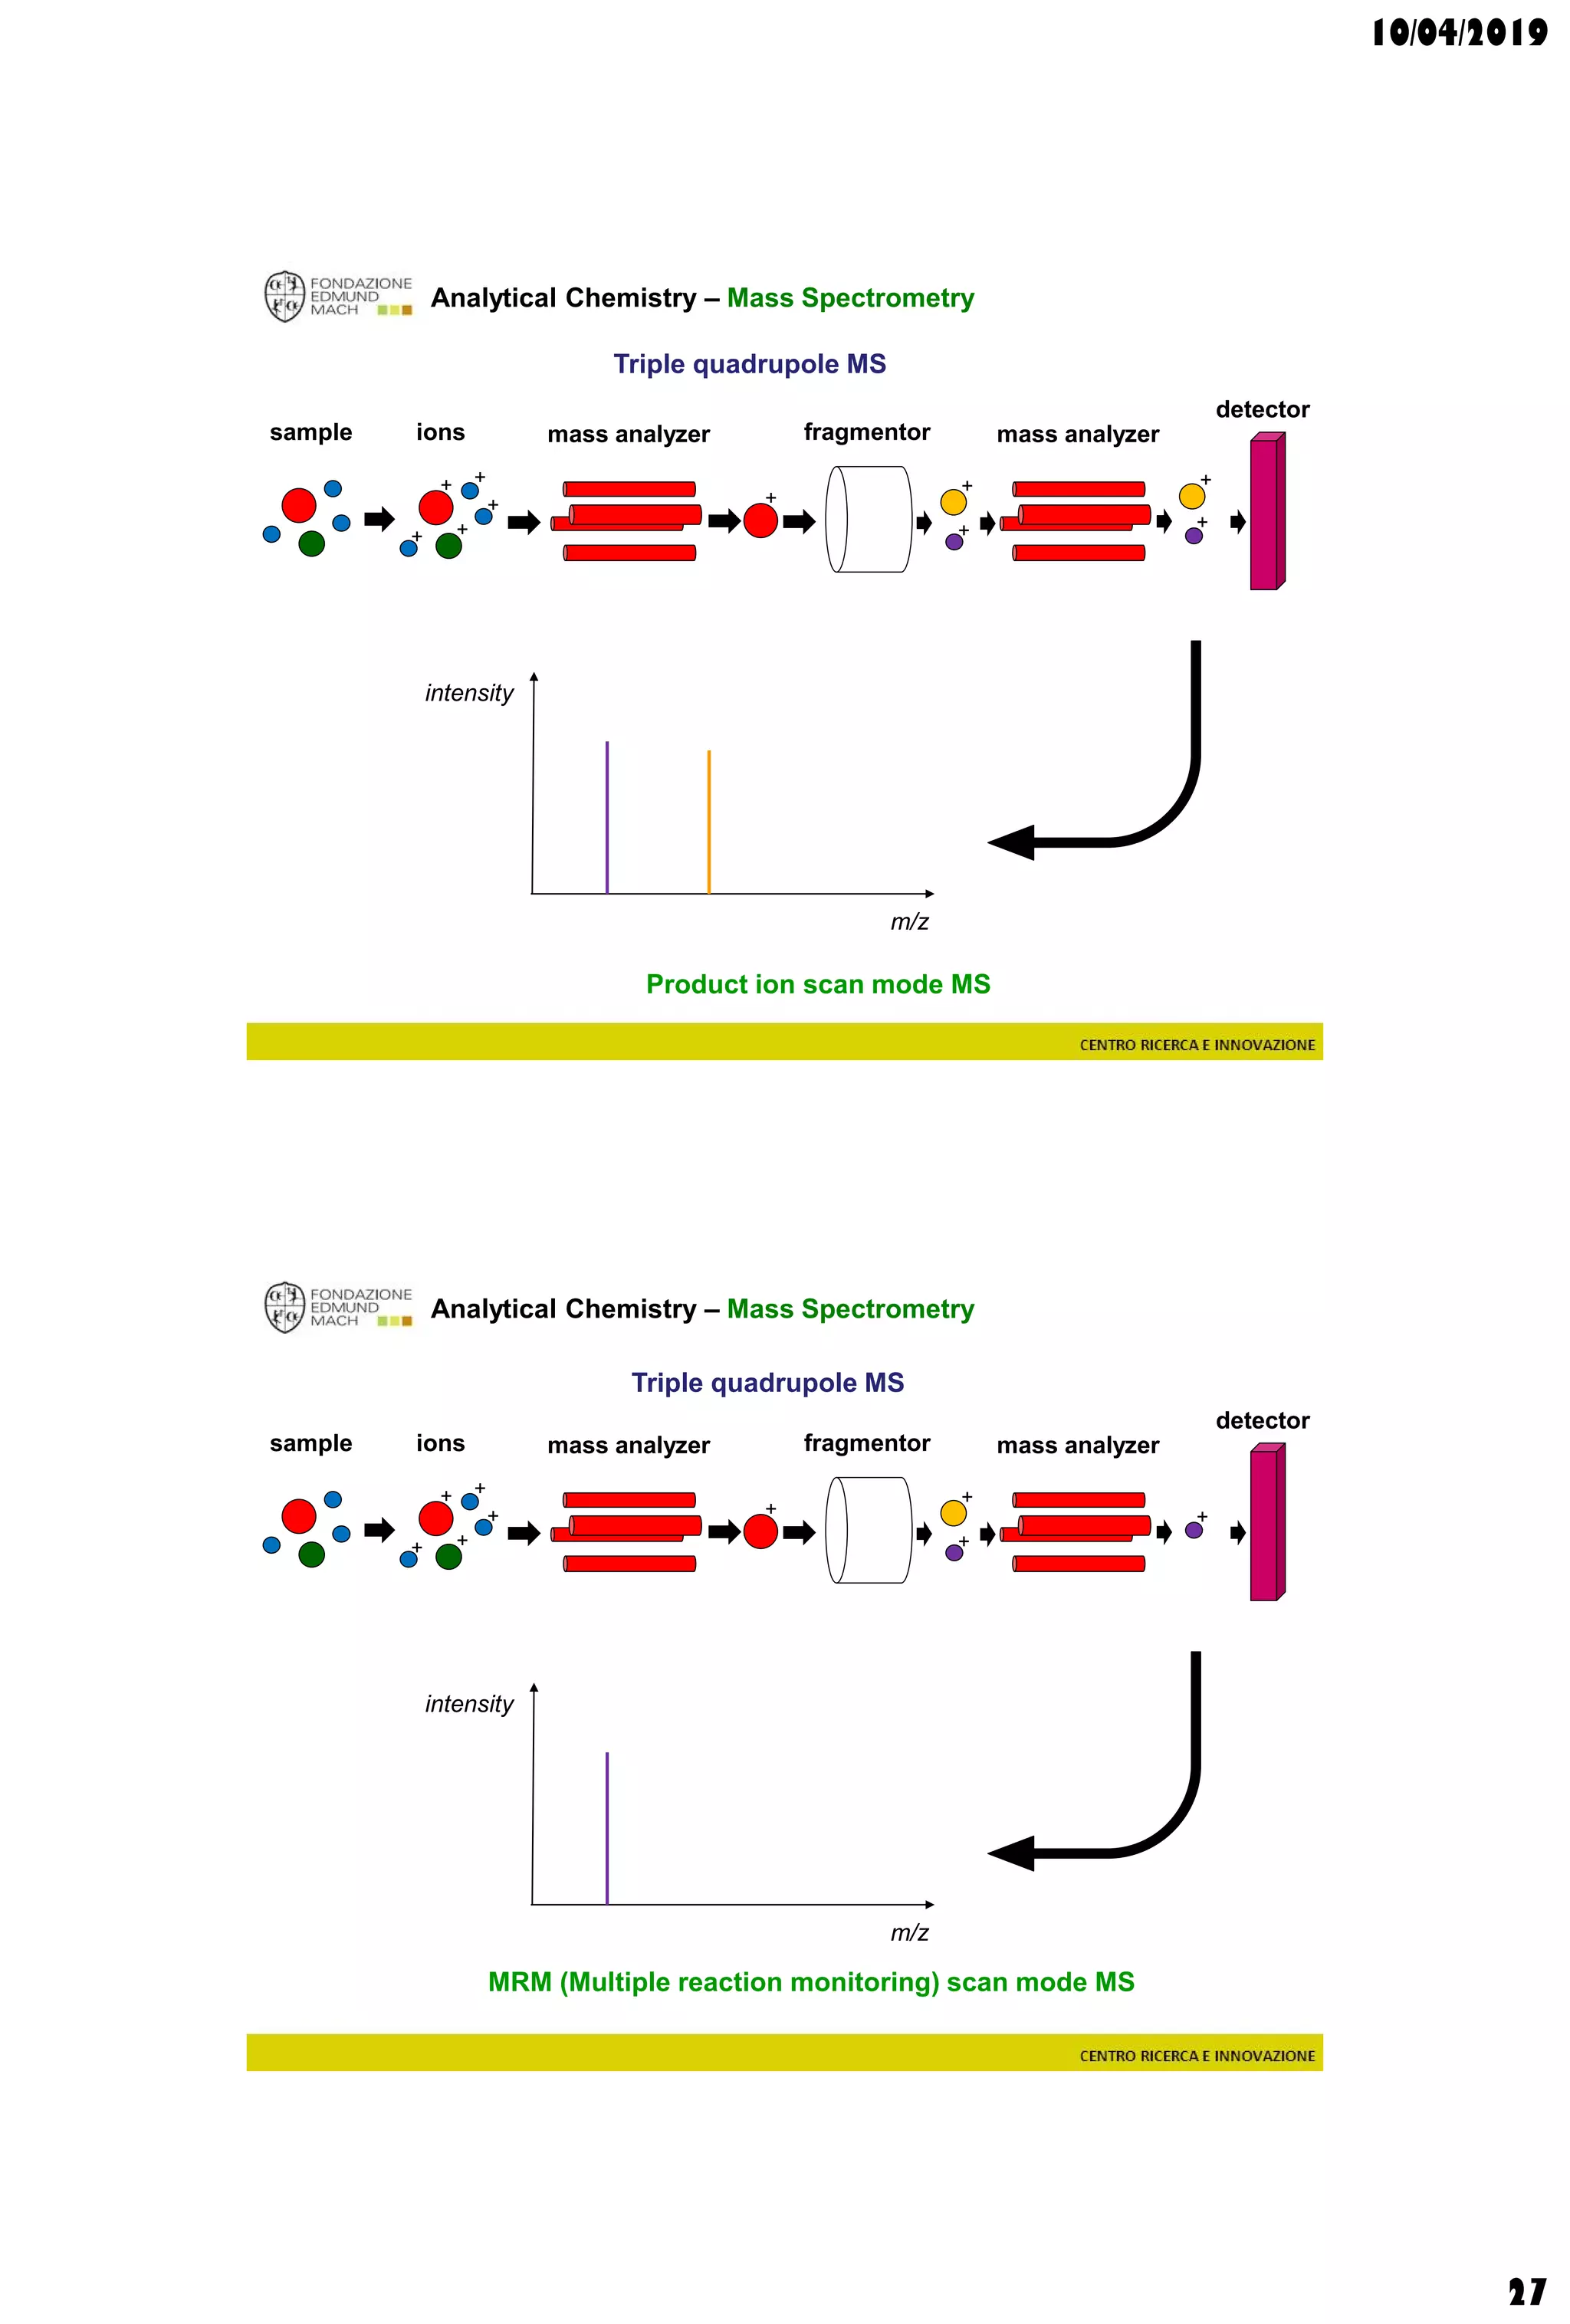
Analytical Chemistry – Mass Spectrometry
Single quadrupole MS
m/z
intensity
627.2
MM: 626.1483
C27H30O17
O
O
O
OH
OH
OH
O
O
OH
OH
OH
OH
OH
OH
OH
OH
O
m/z
intensity
625.1
ESI+ mode ESI- mode
[M-H]- = 625.1410[M+H]+ = 627.1556](https://image.slidesharecdn.com/c3a2019-190410214616/75/Wine-and-grape-Metabolomics-Chapters-3-4-28-2048.jpg)
![10/04/2019
29
Analytical Chemistry – Mass Spectrometry
Single quadrupole MS
m/z
intensity
611.2
MM: 611.1607
C27H31O16
ESI+ mode
[M]+ = 611.1607
O
O
+
O
OH
OH
OH
O
O
OH
OH
OH
OH
OH
OH
OH
OH
Analytical Chemistry – Mass Spectrometry
m/z
intensity
627.2
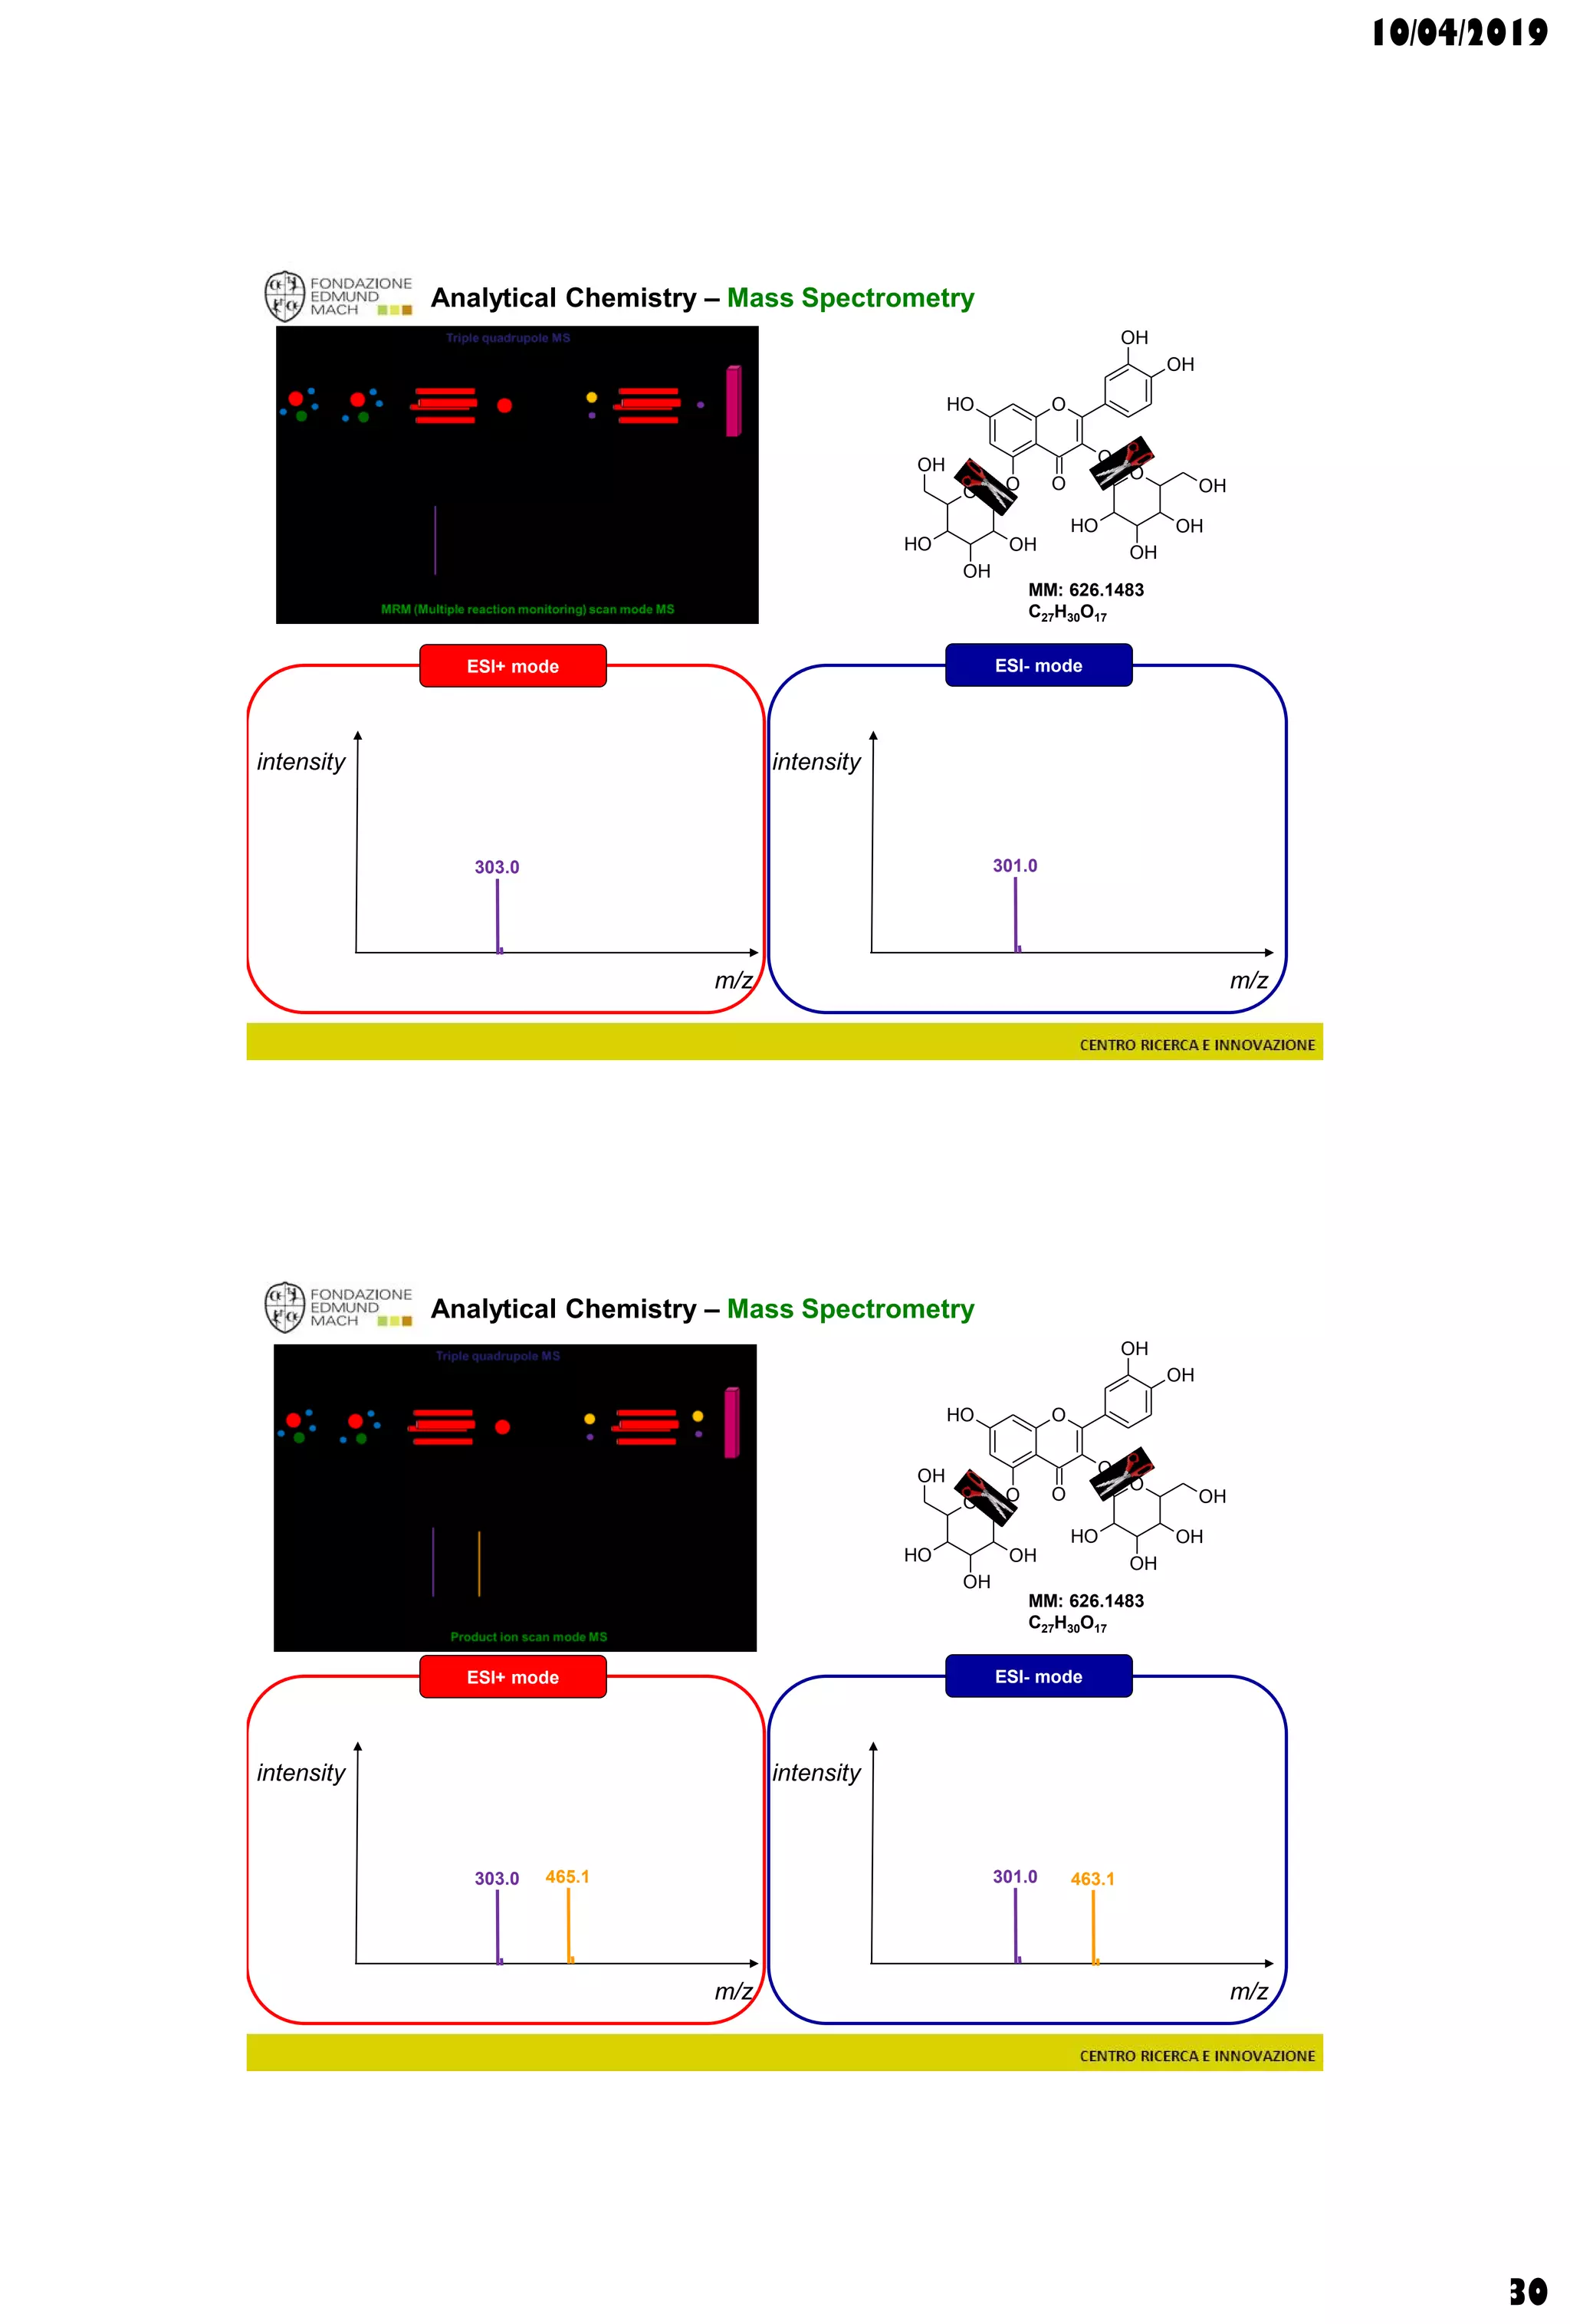
MM: 626.1483
C27H30O17
O
O
O
OH
OH
OH
O
O
OH
OH
OH
OH
OH
OH
OH
OH
O
m/z
intensity
625.1
ESI+ mode ESI- mode](https://image.slidesharecdn.com/c3a2019-190410214616/75/Wine-and-grape-Metabolomics-Chapters-3-4-29-2048.jpg)
![10/04/2019
55
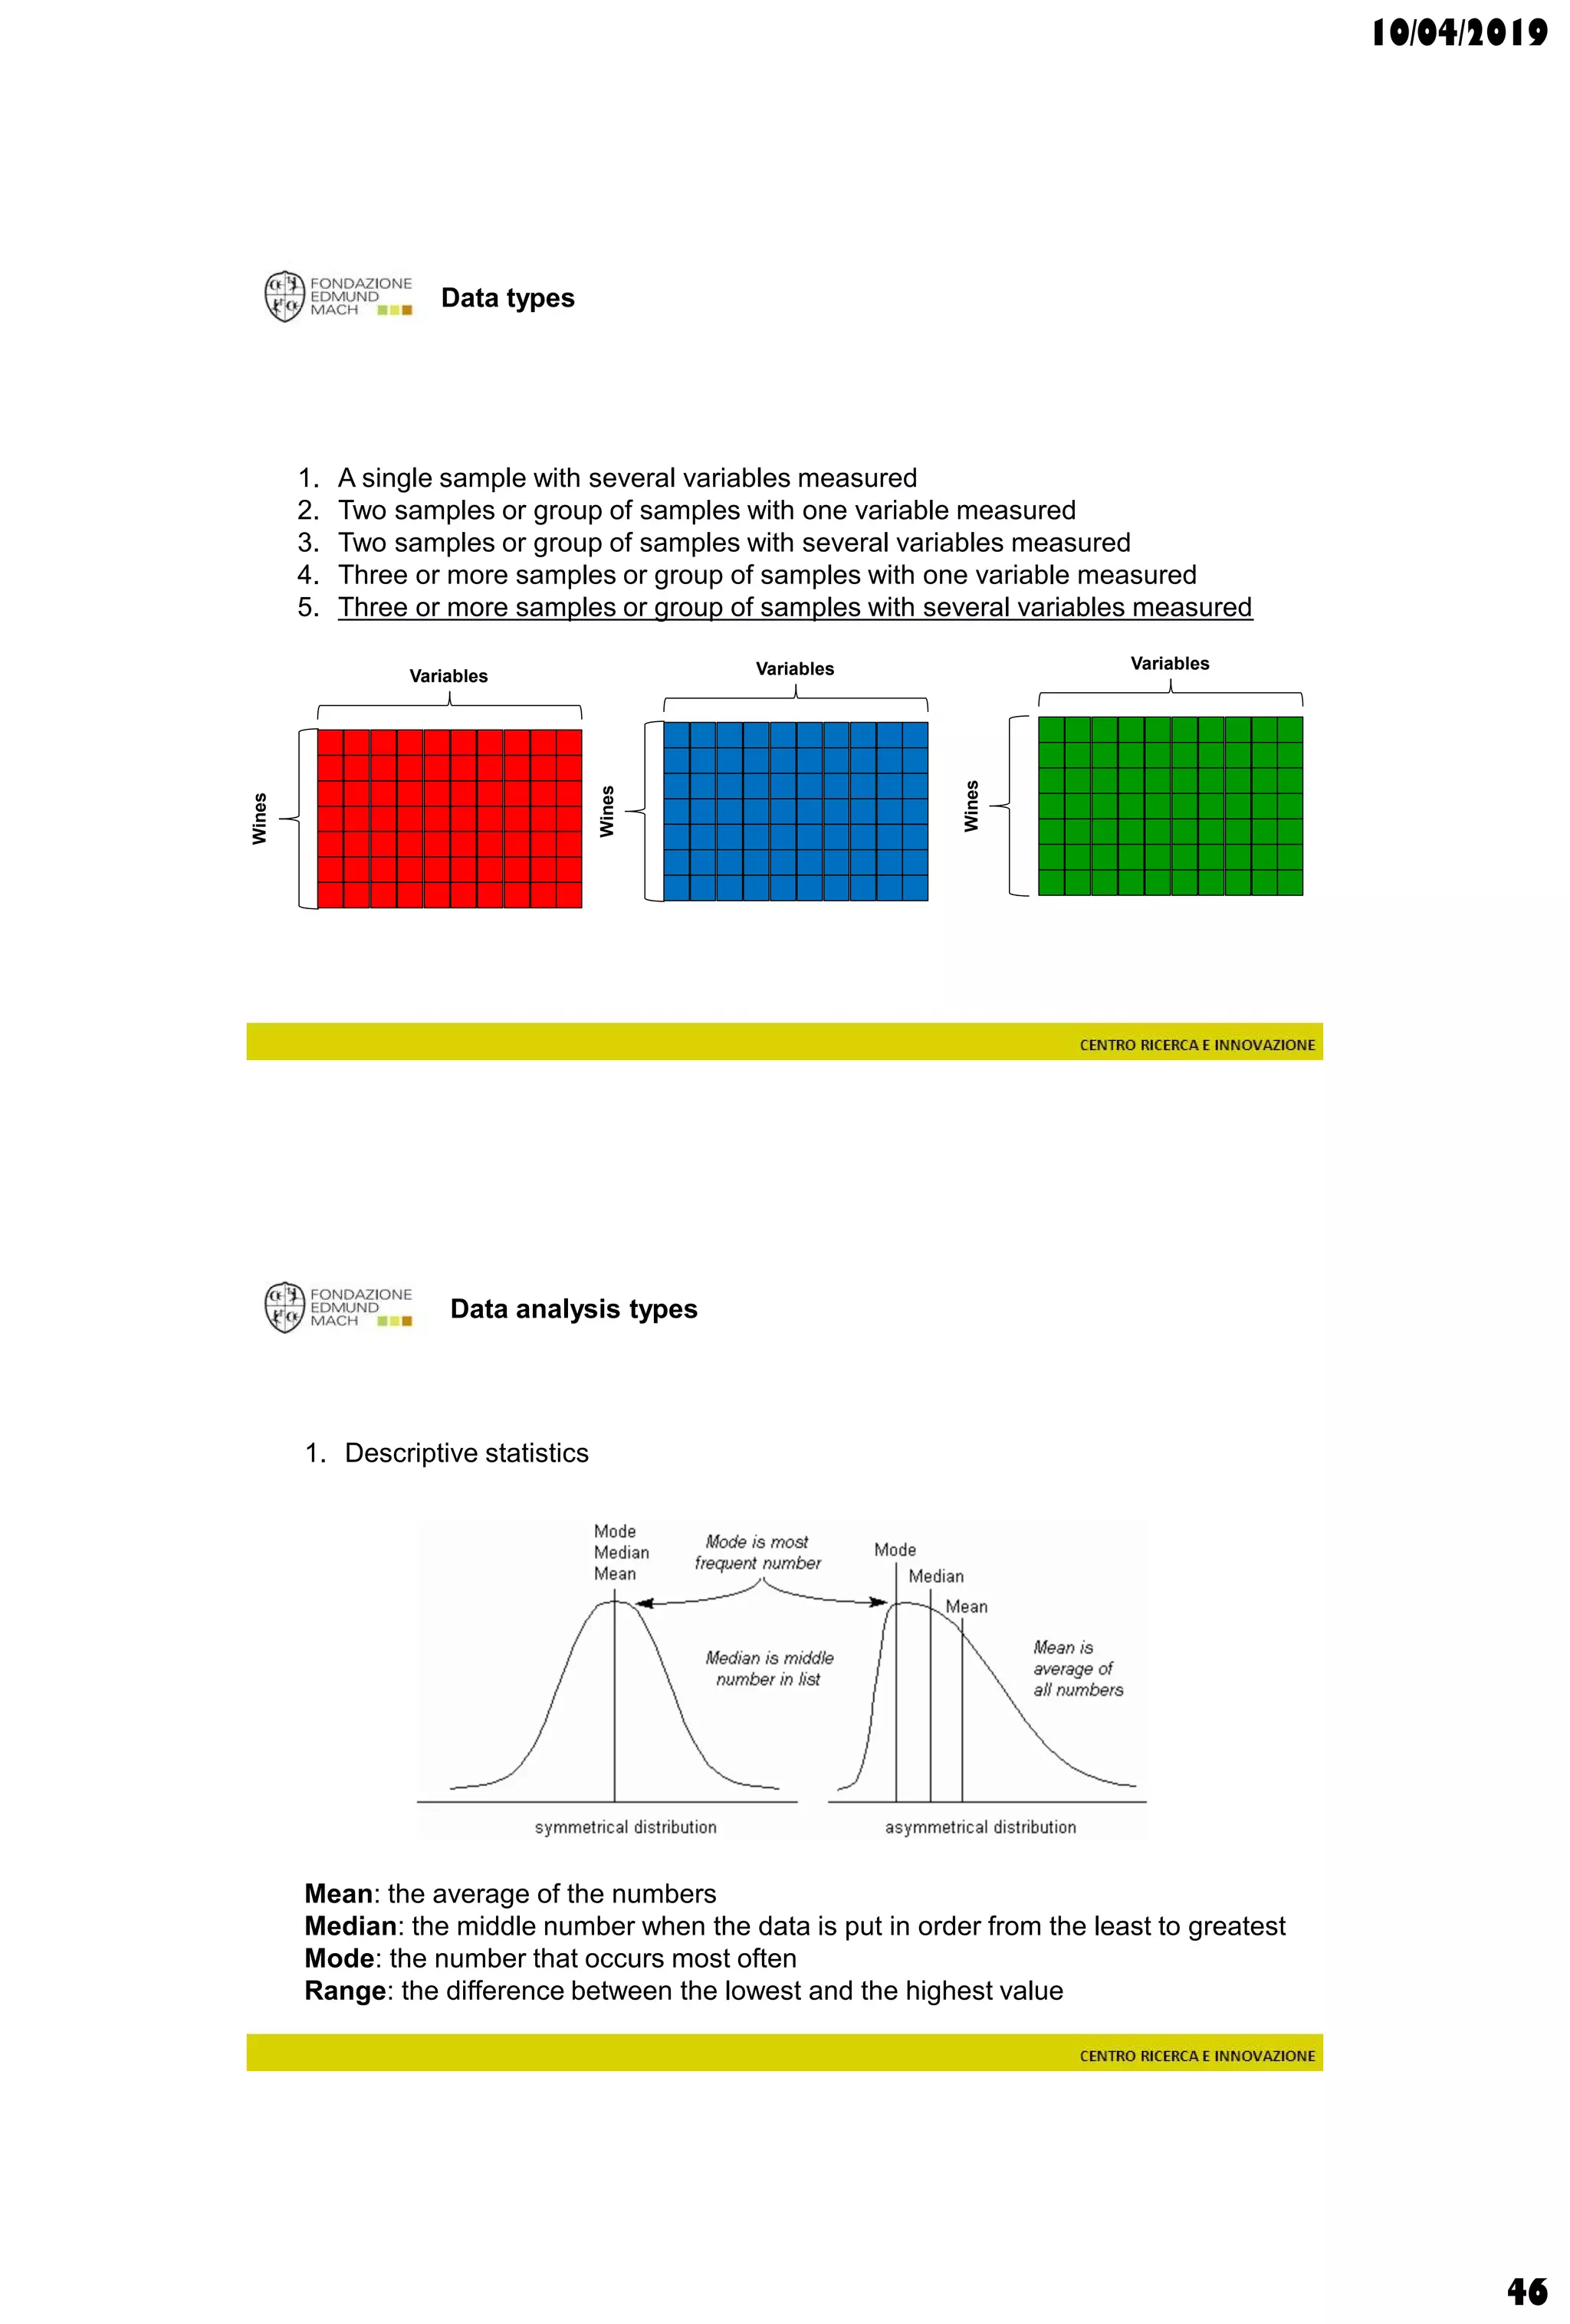
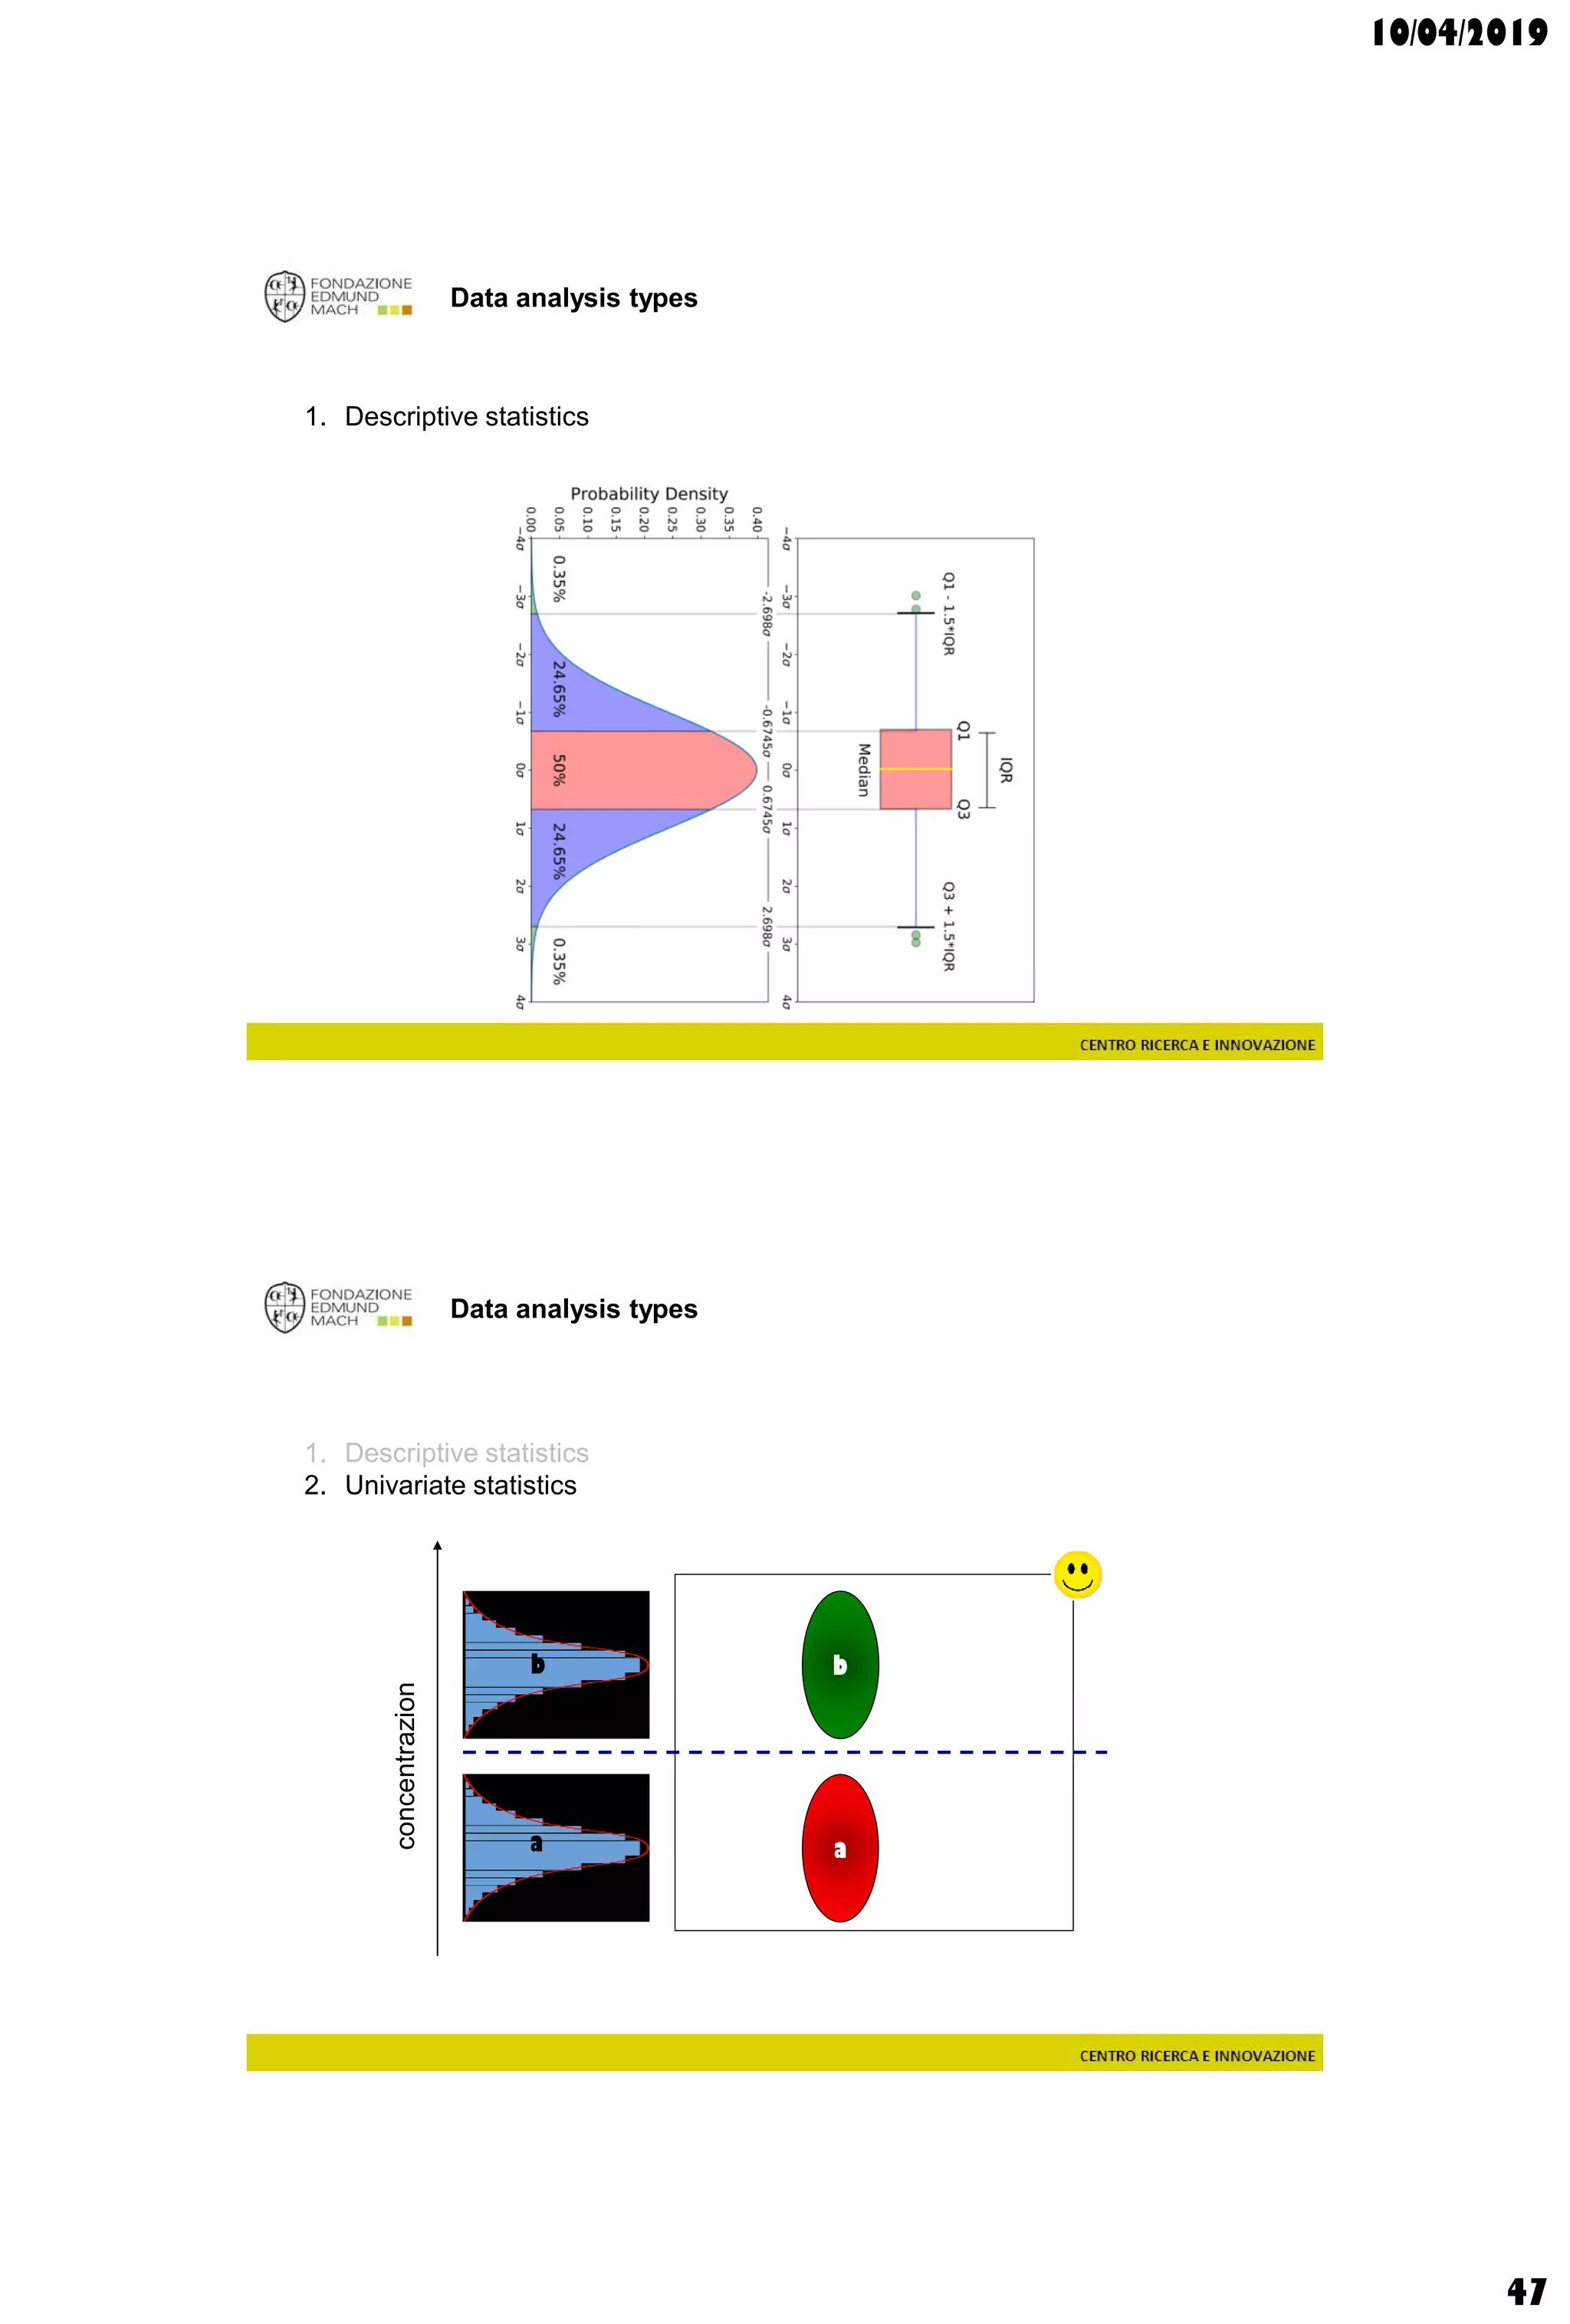
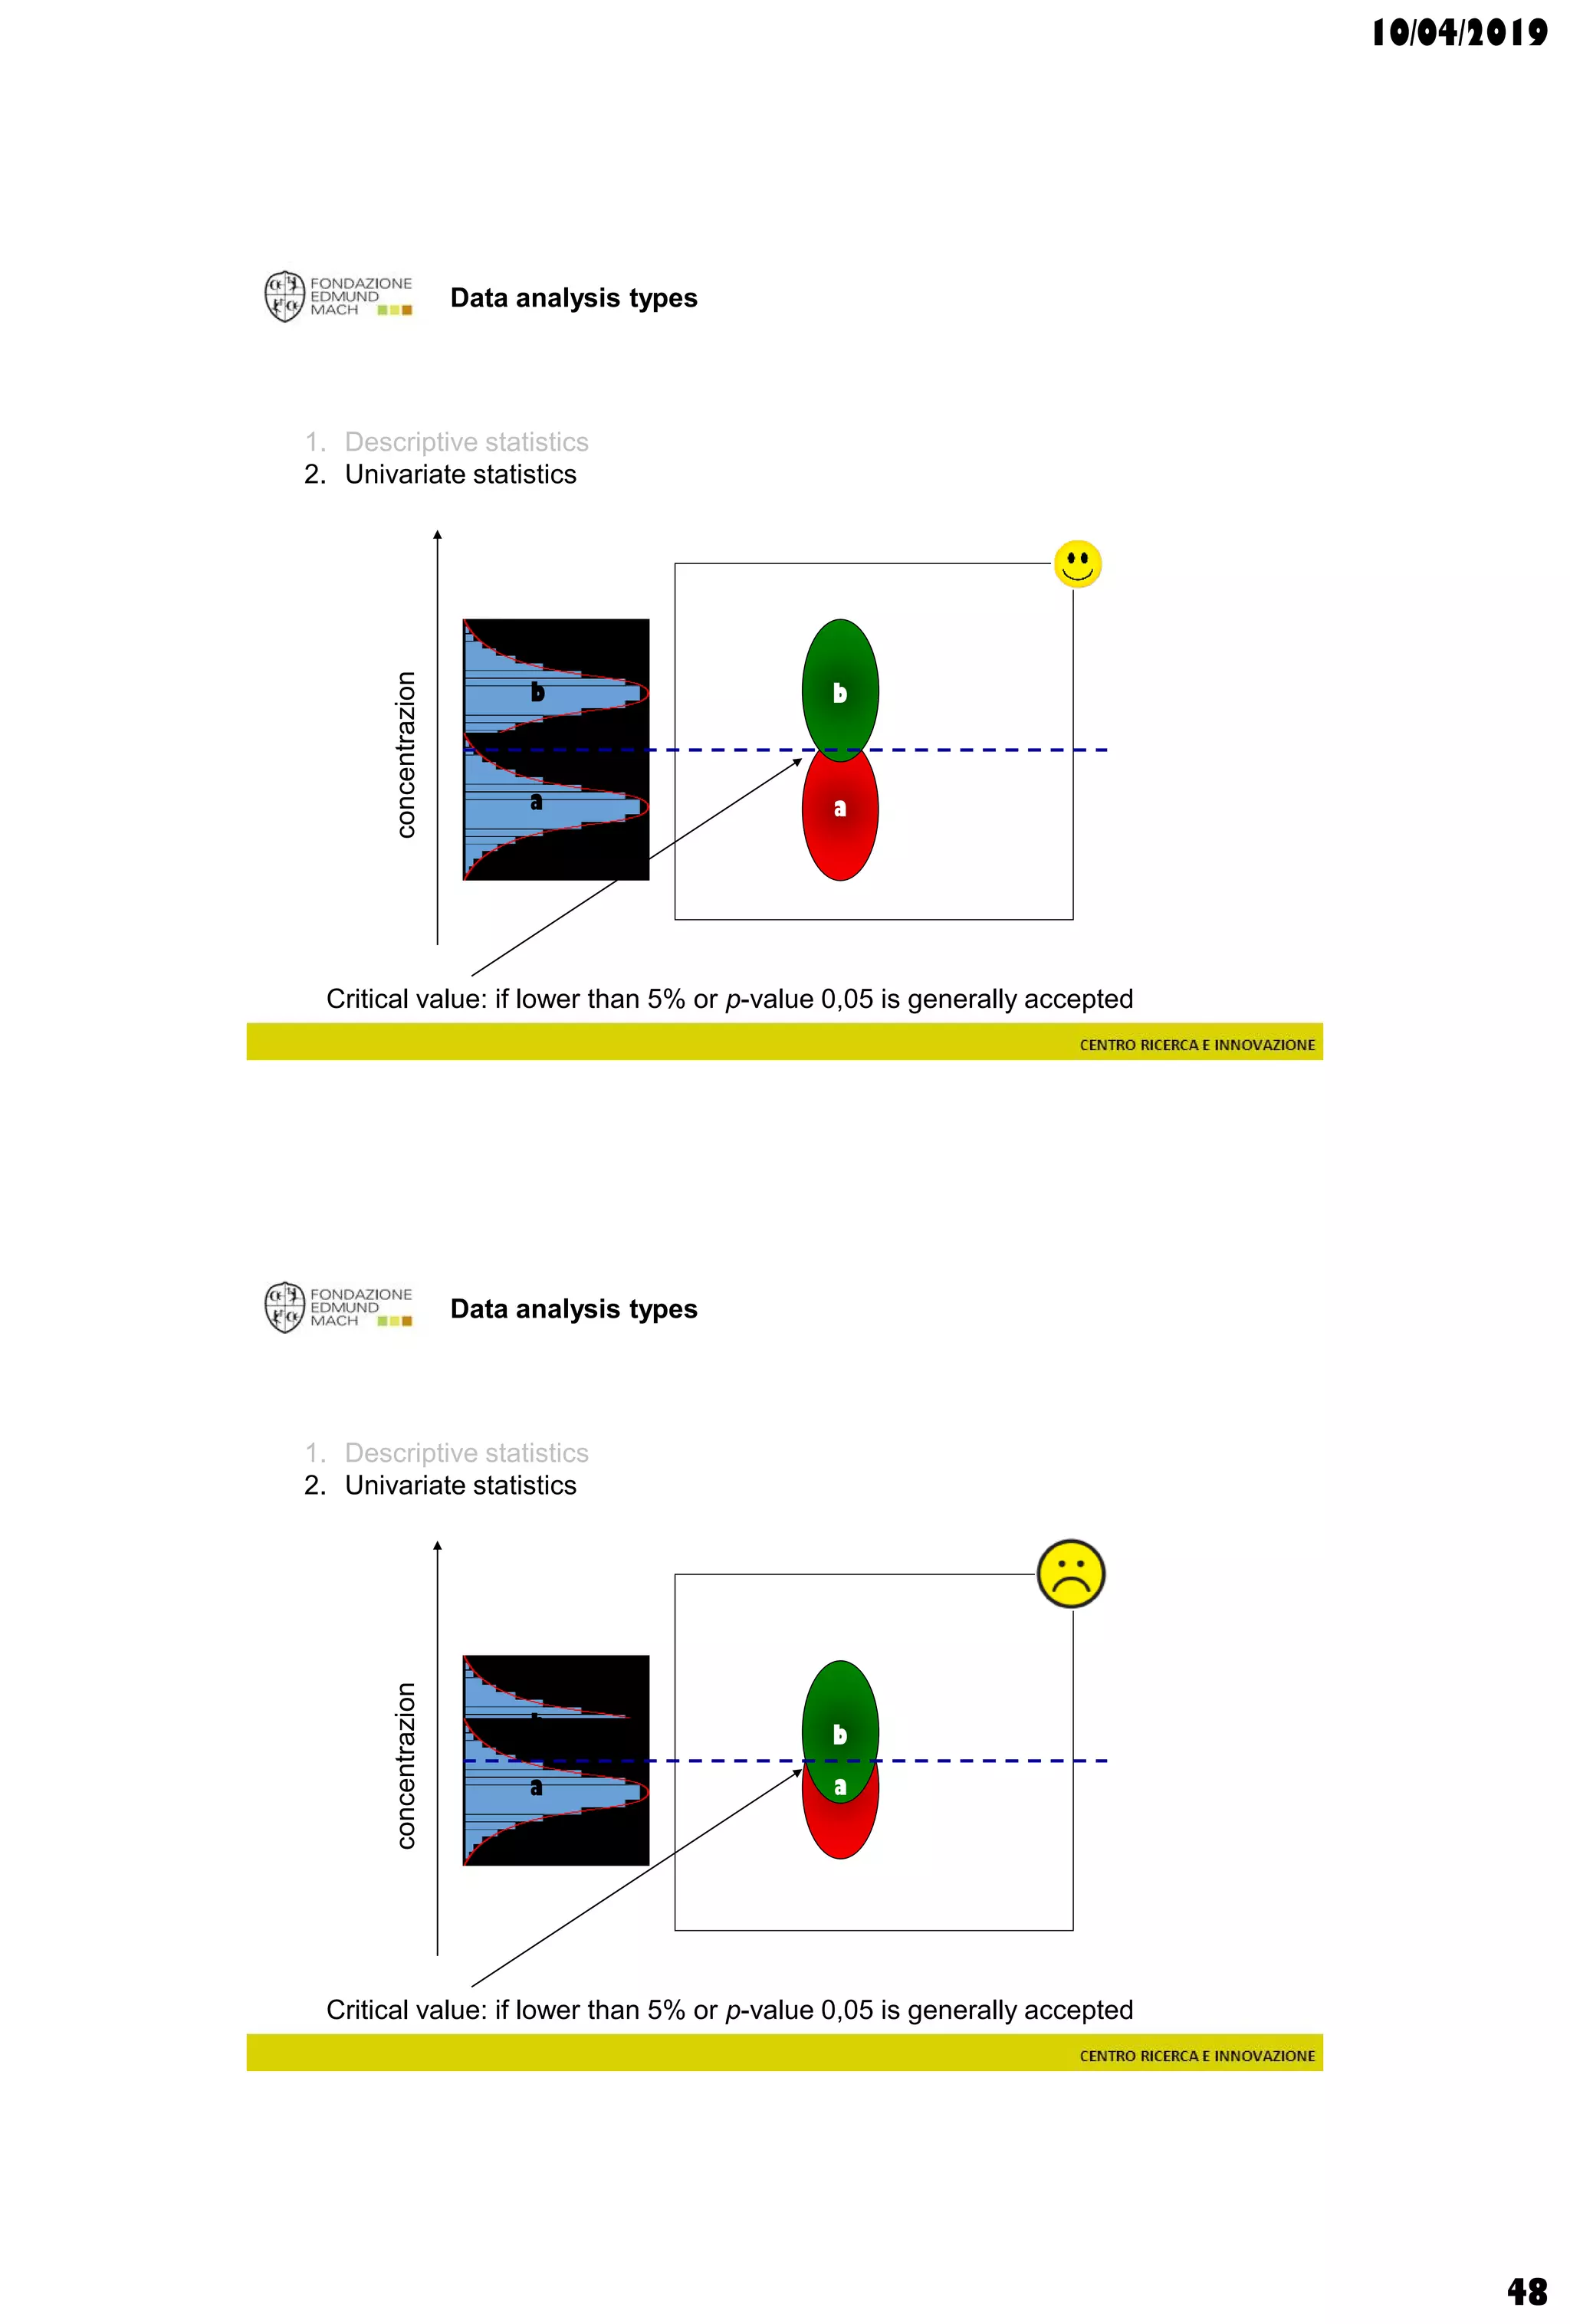
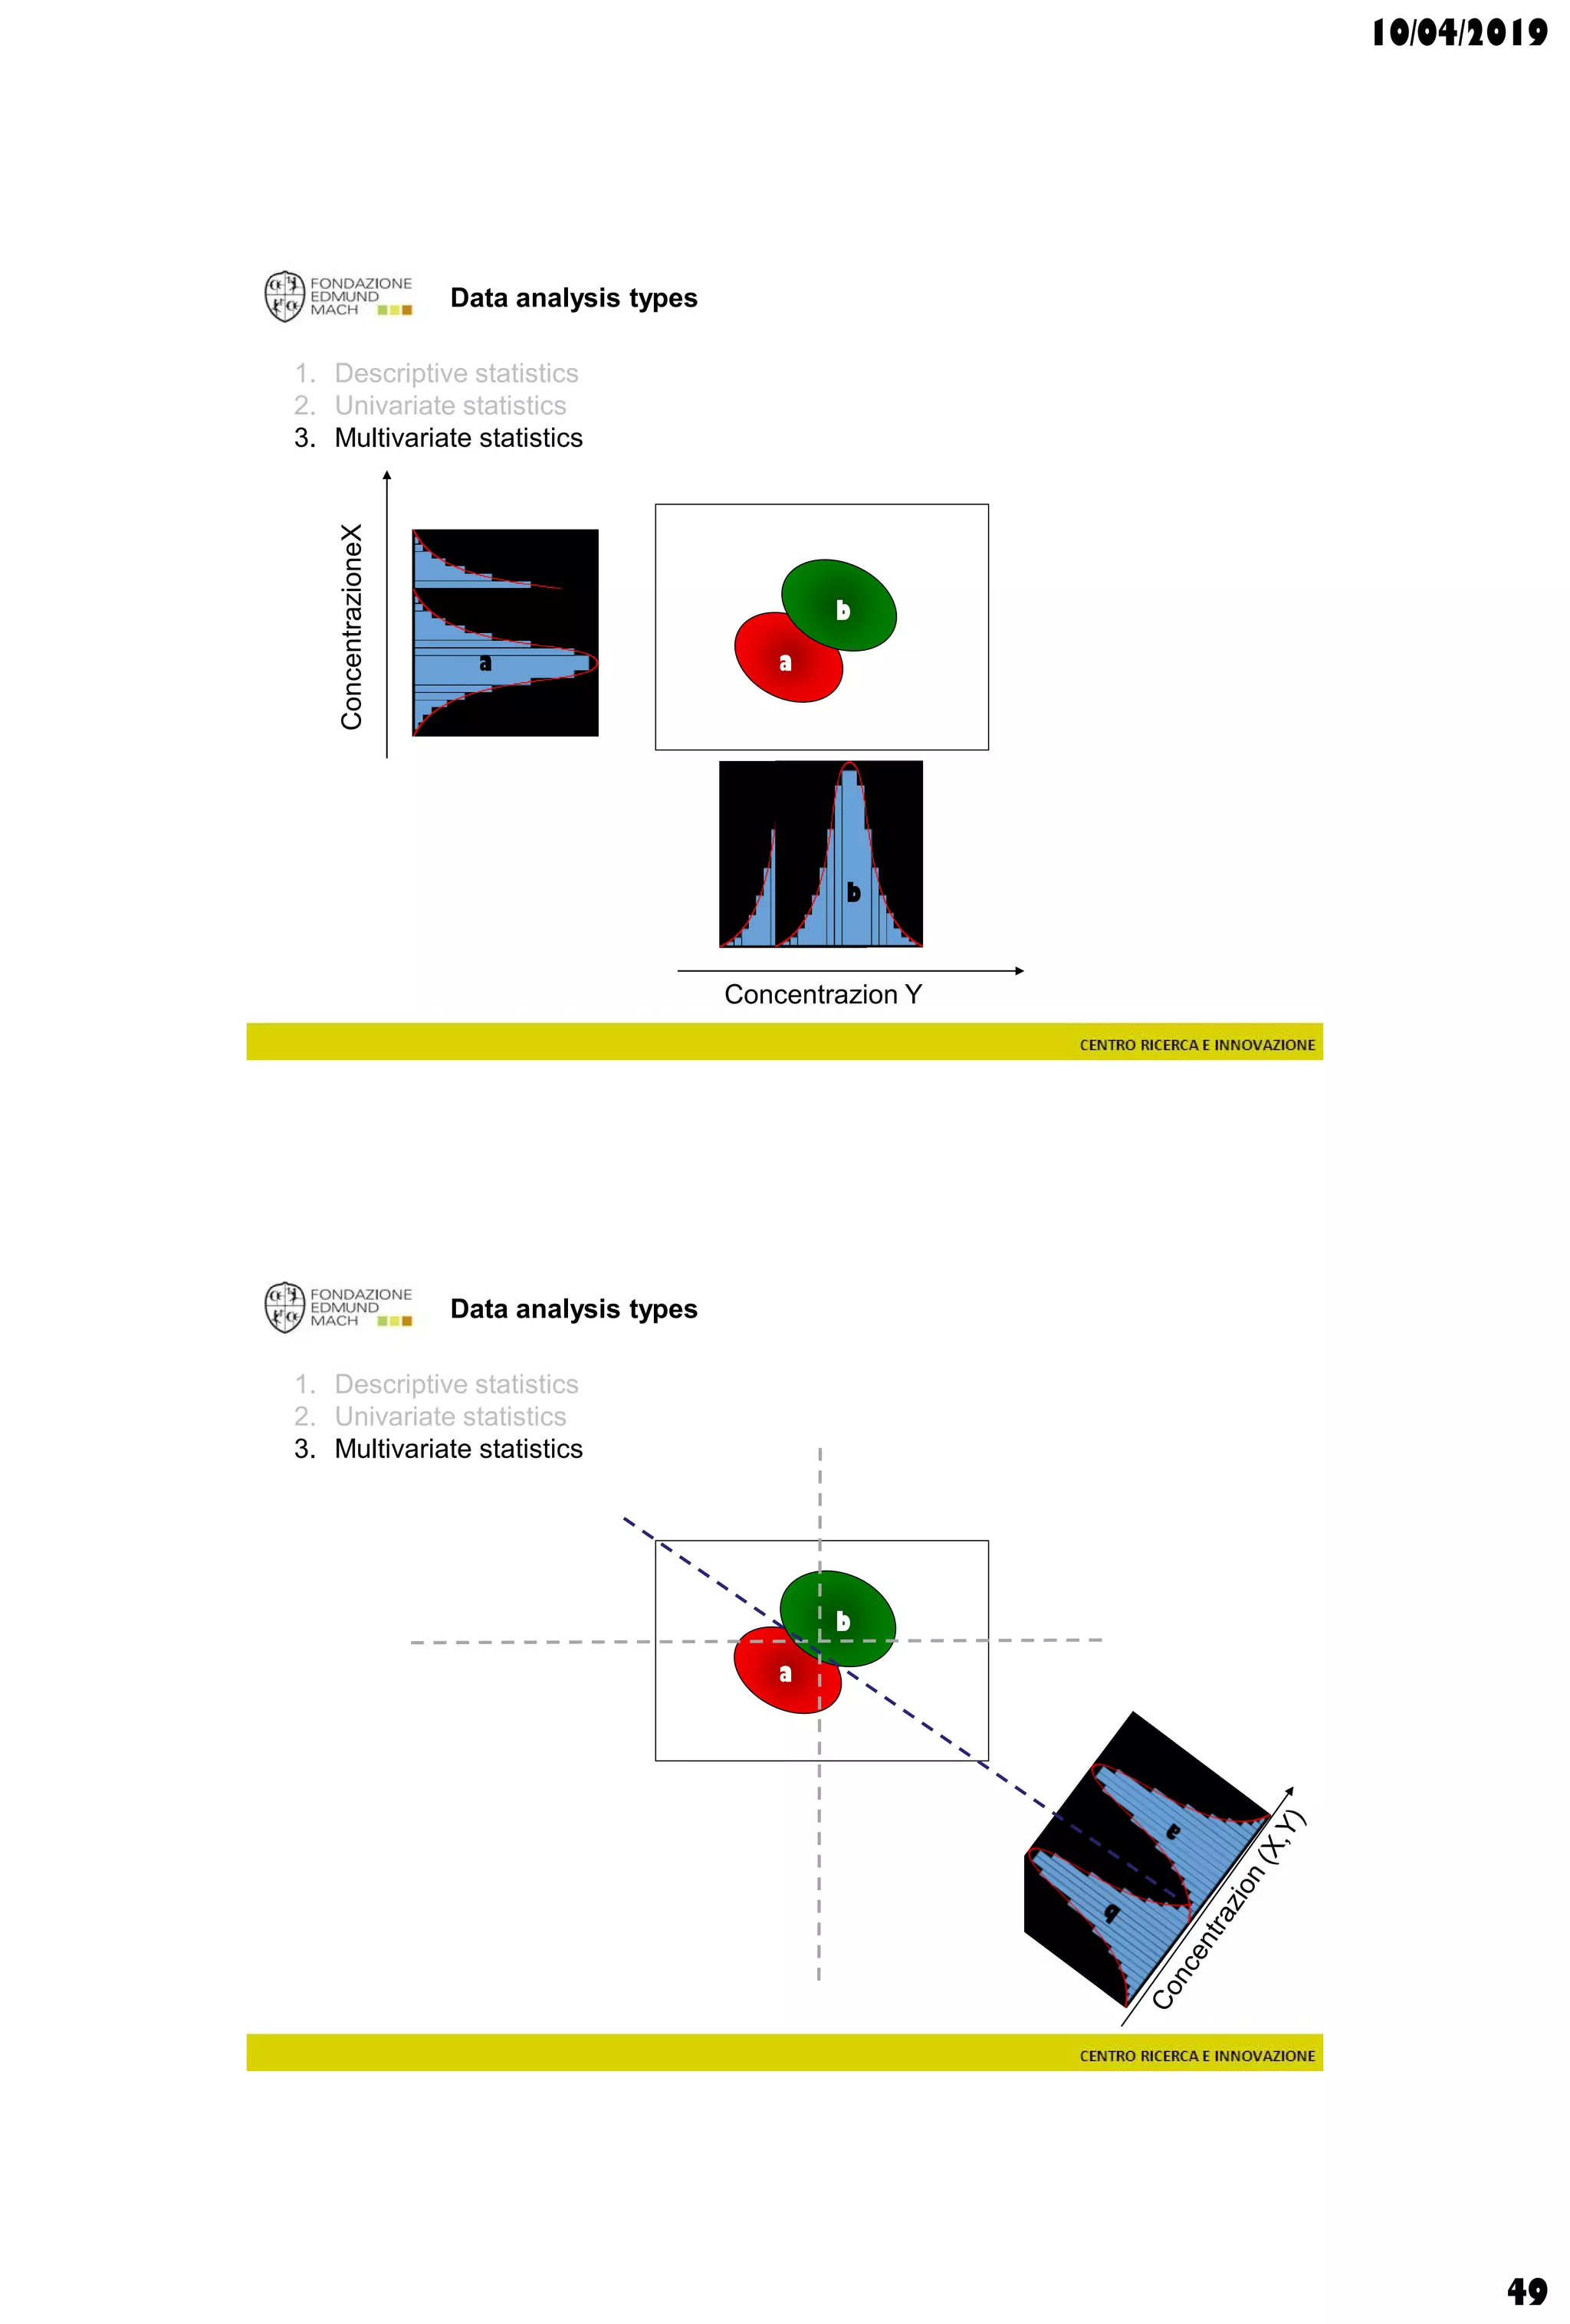
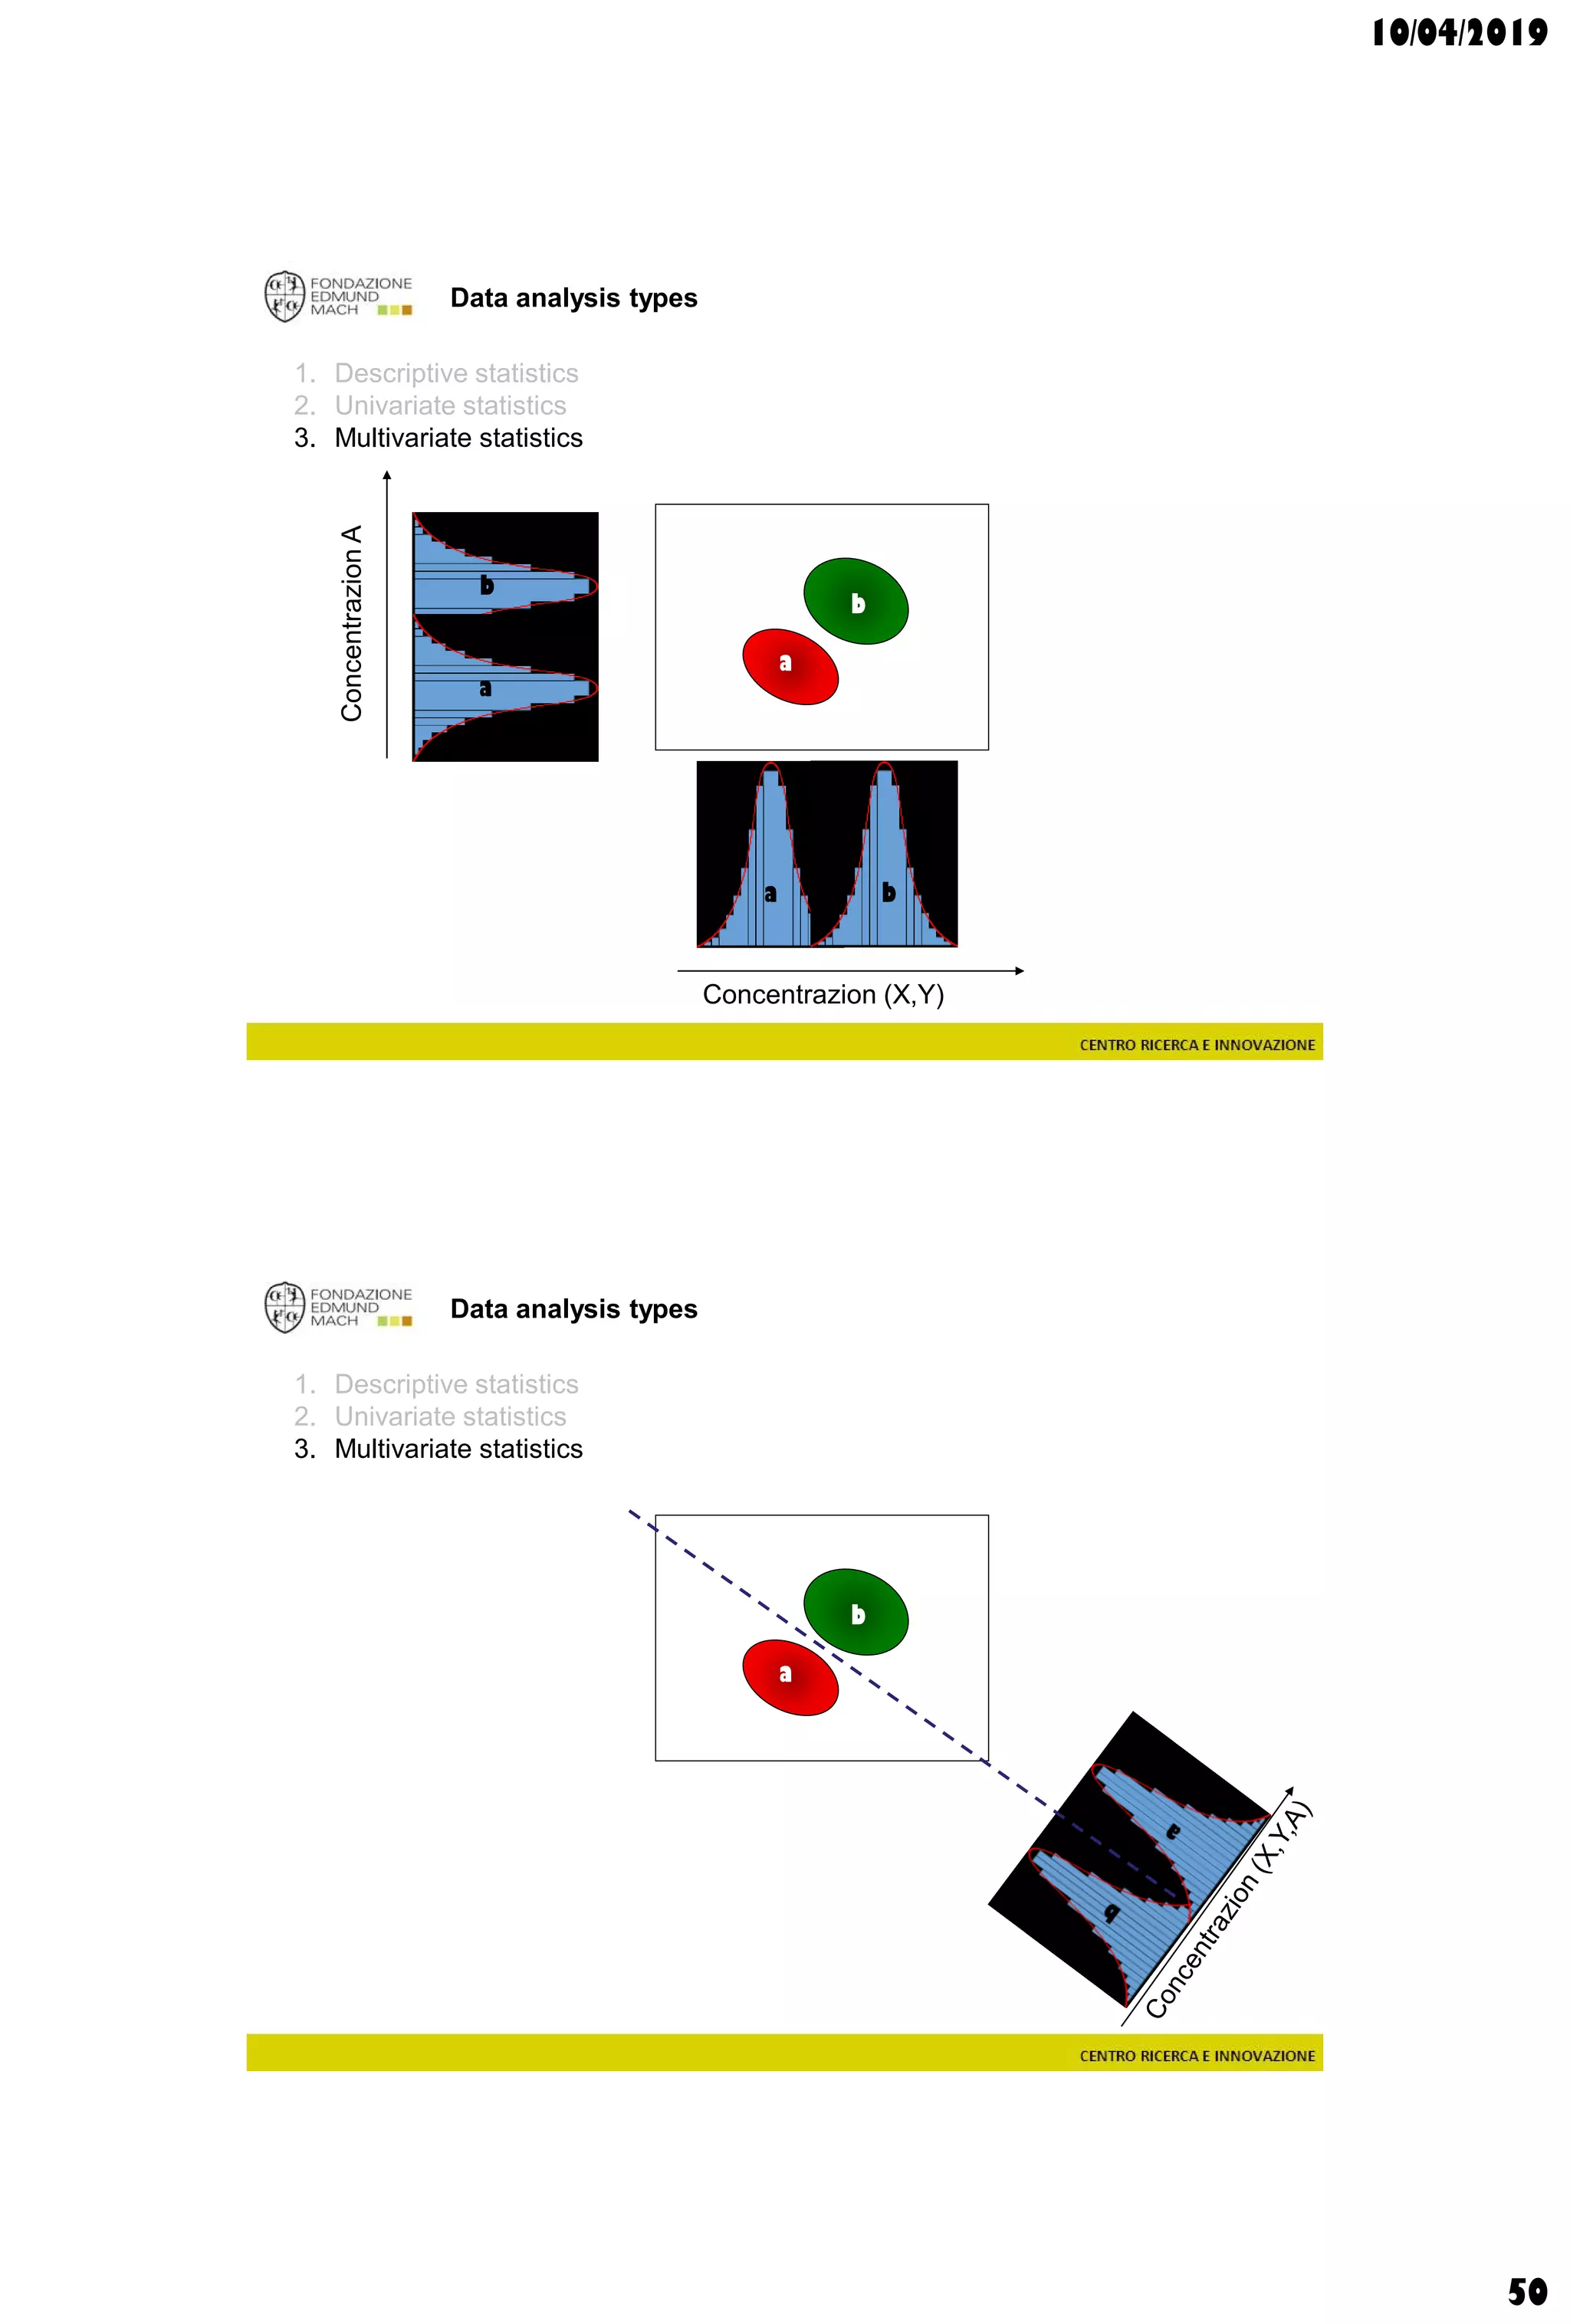
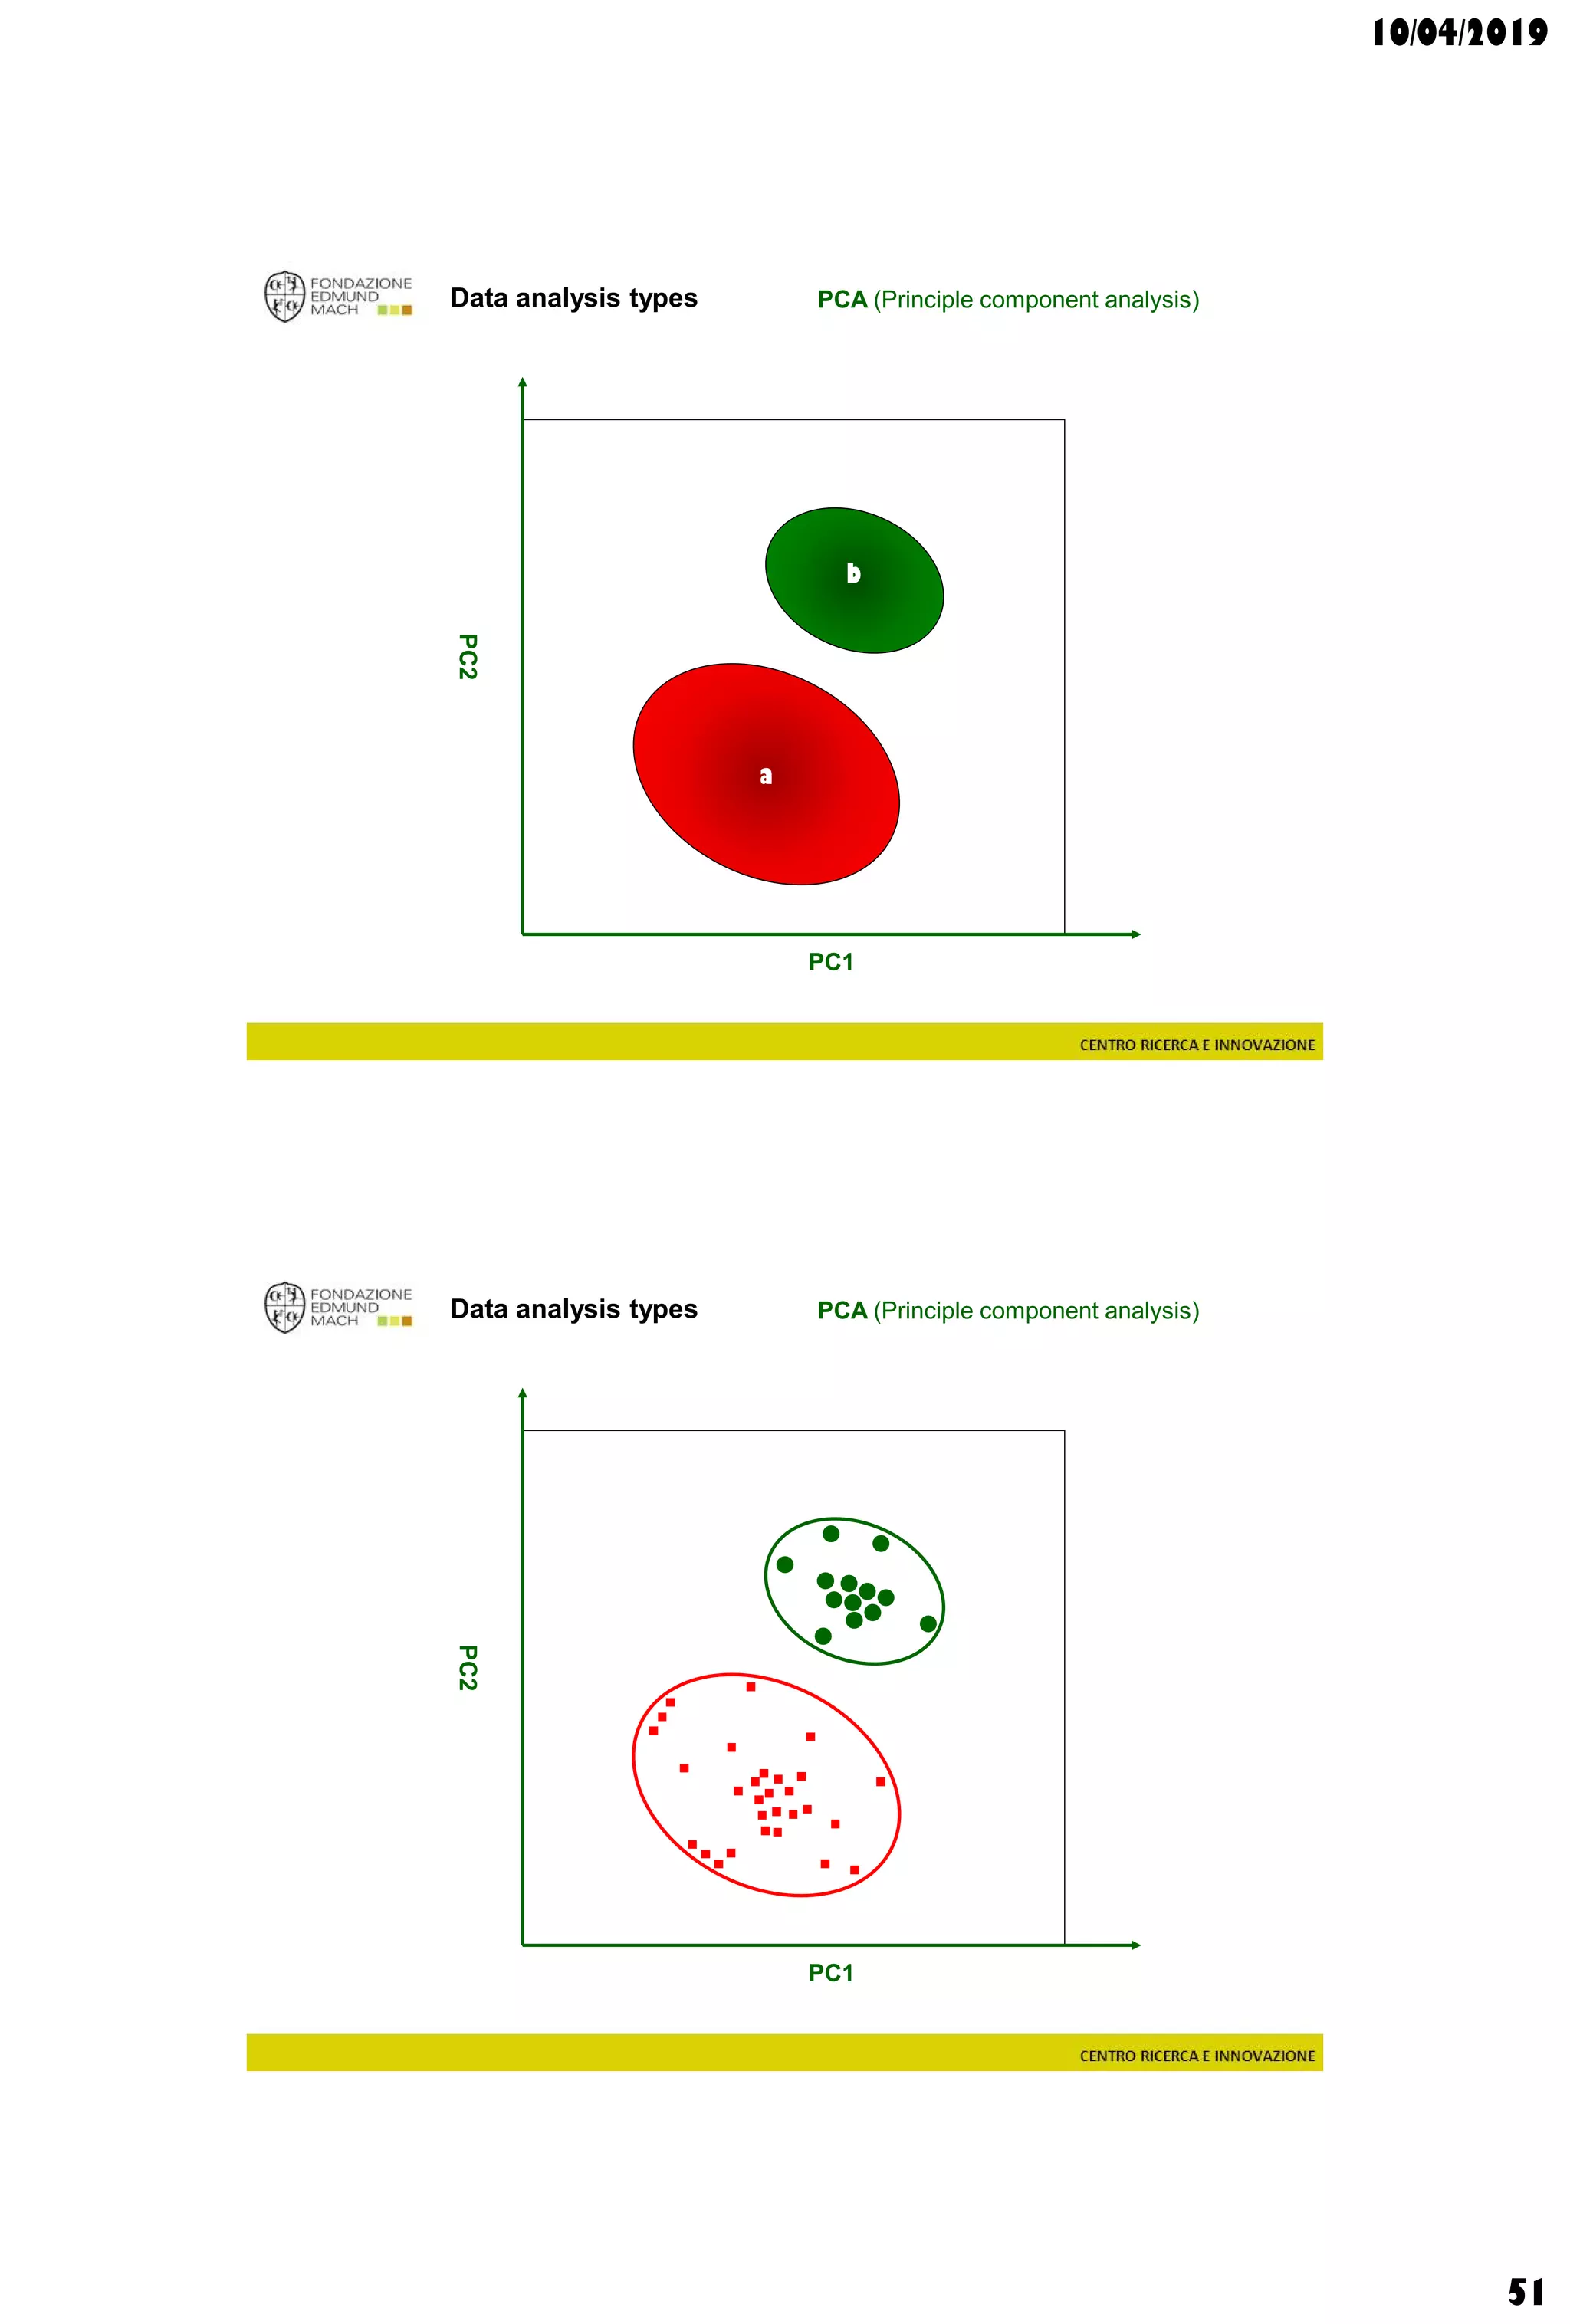
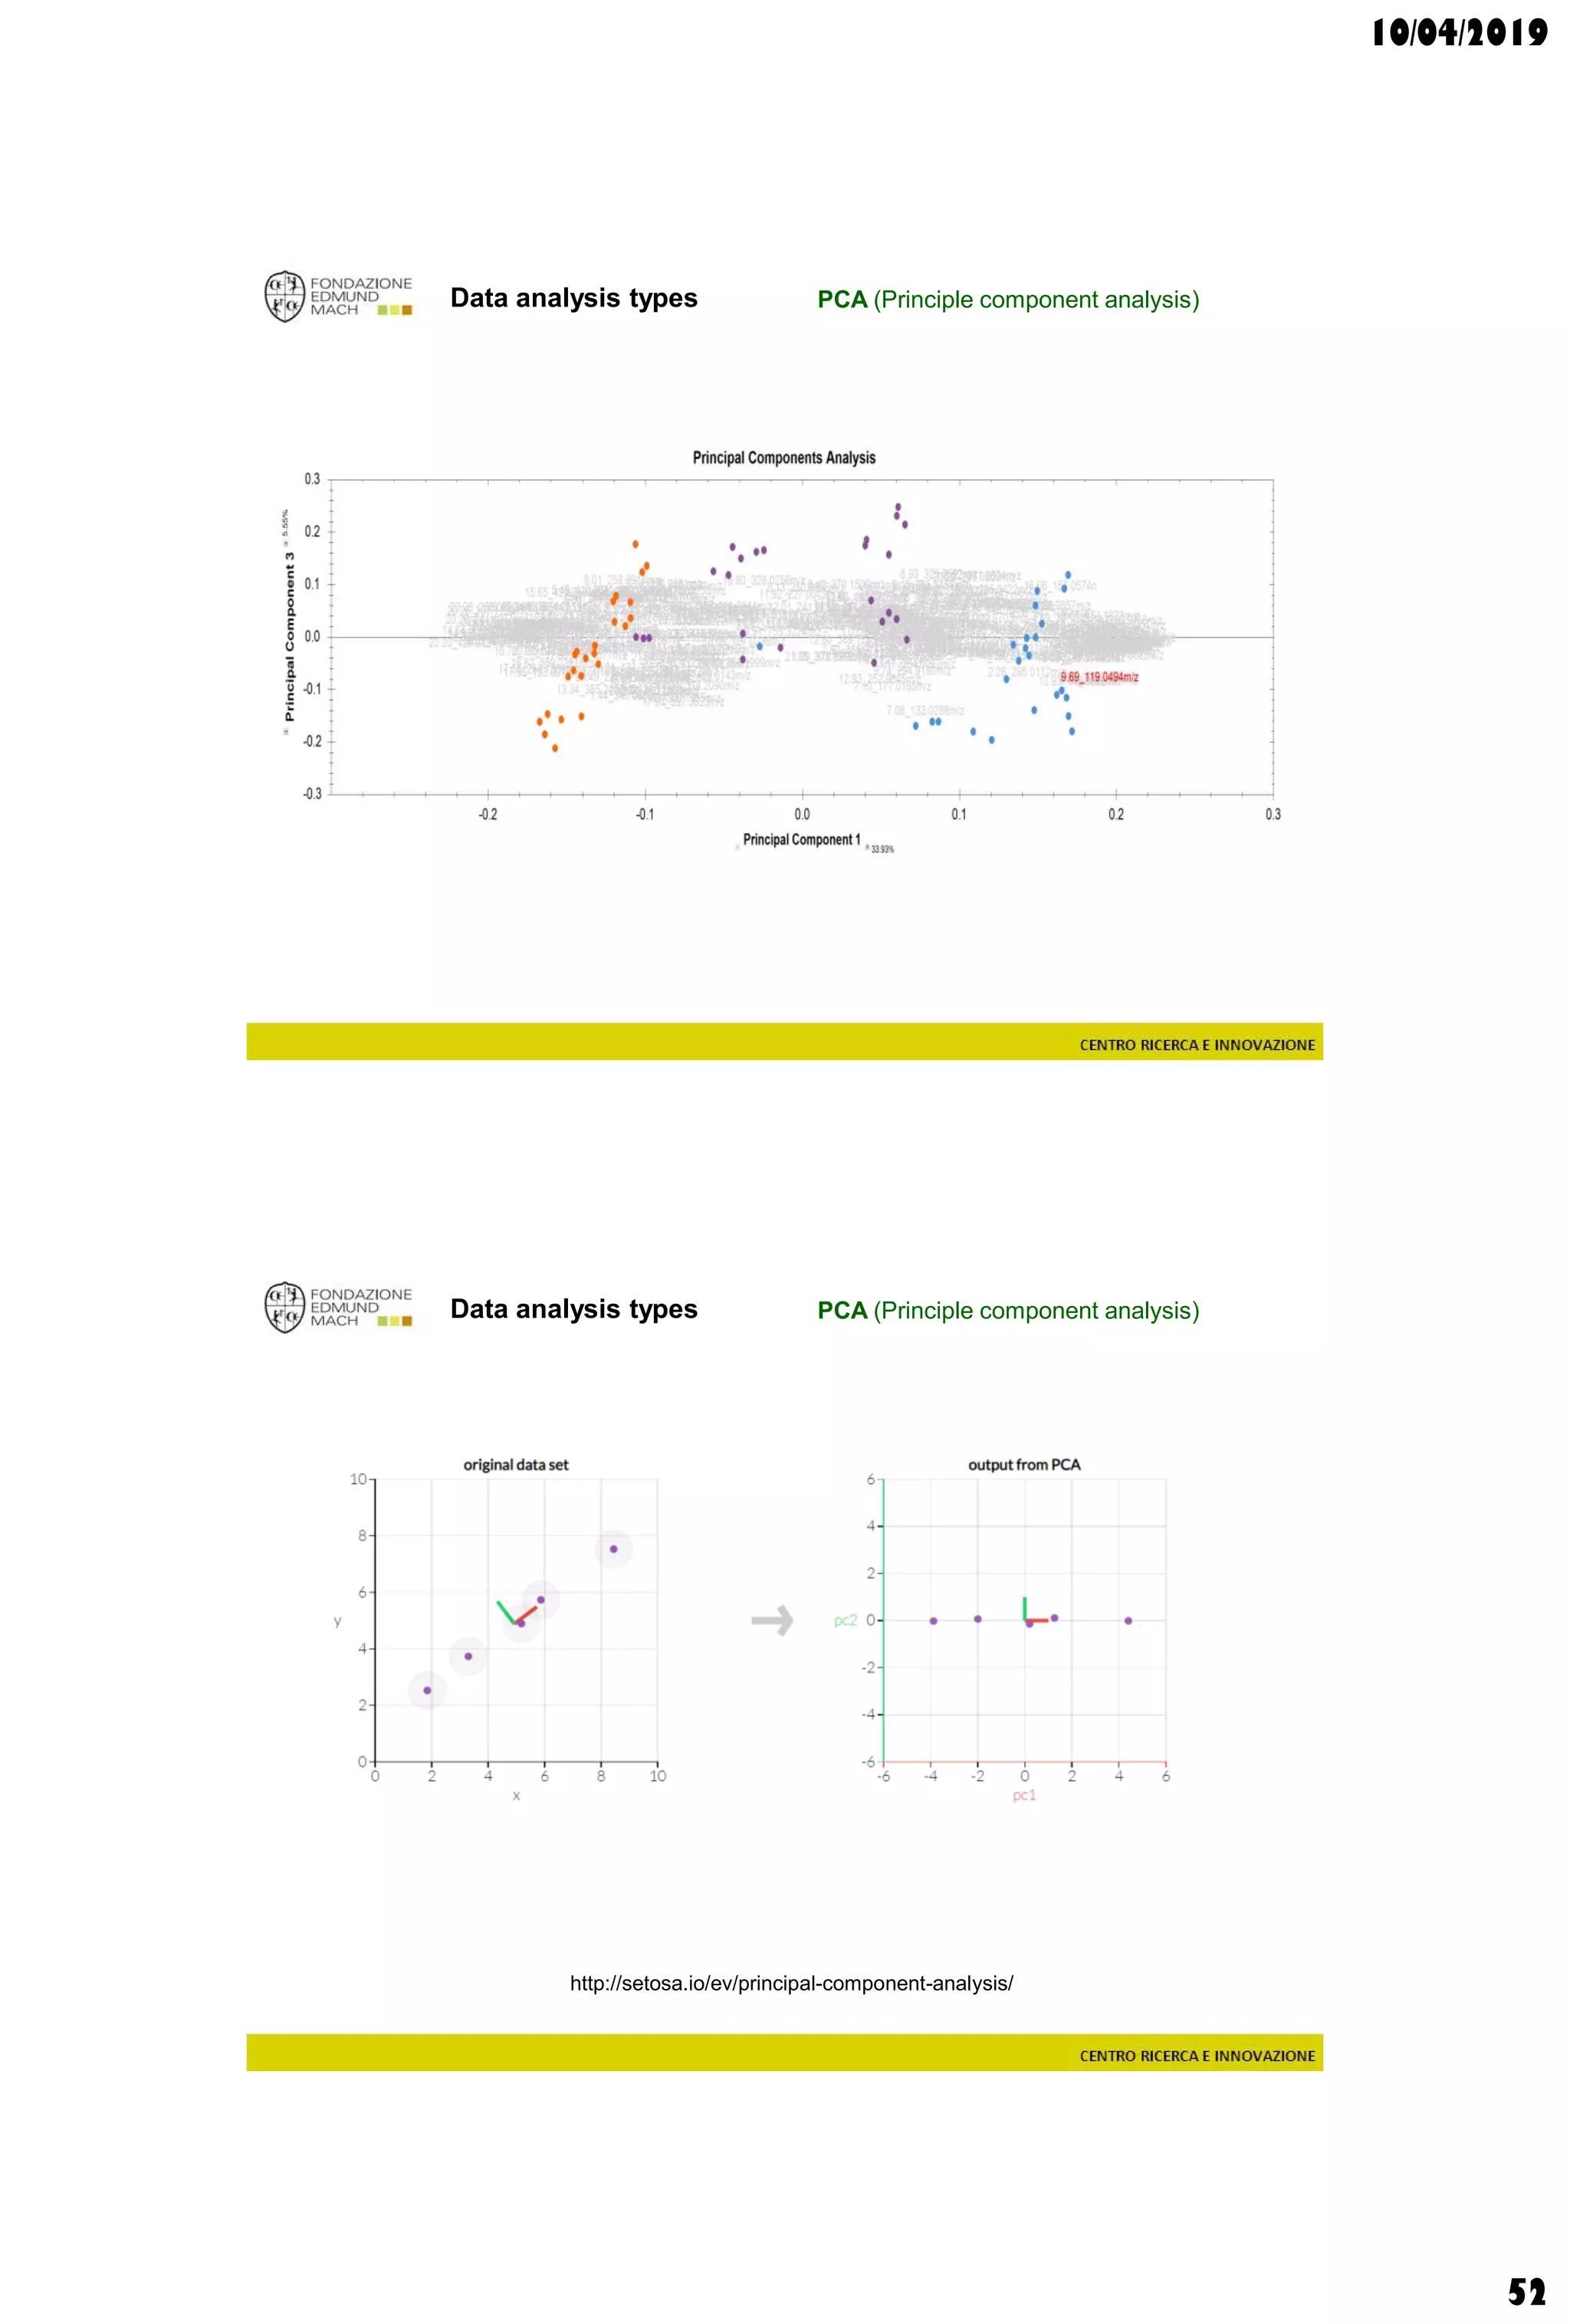
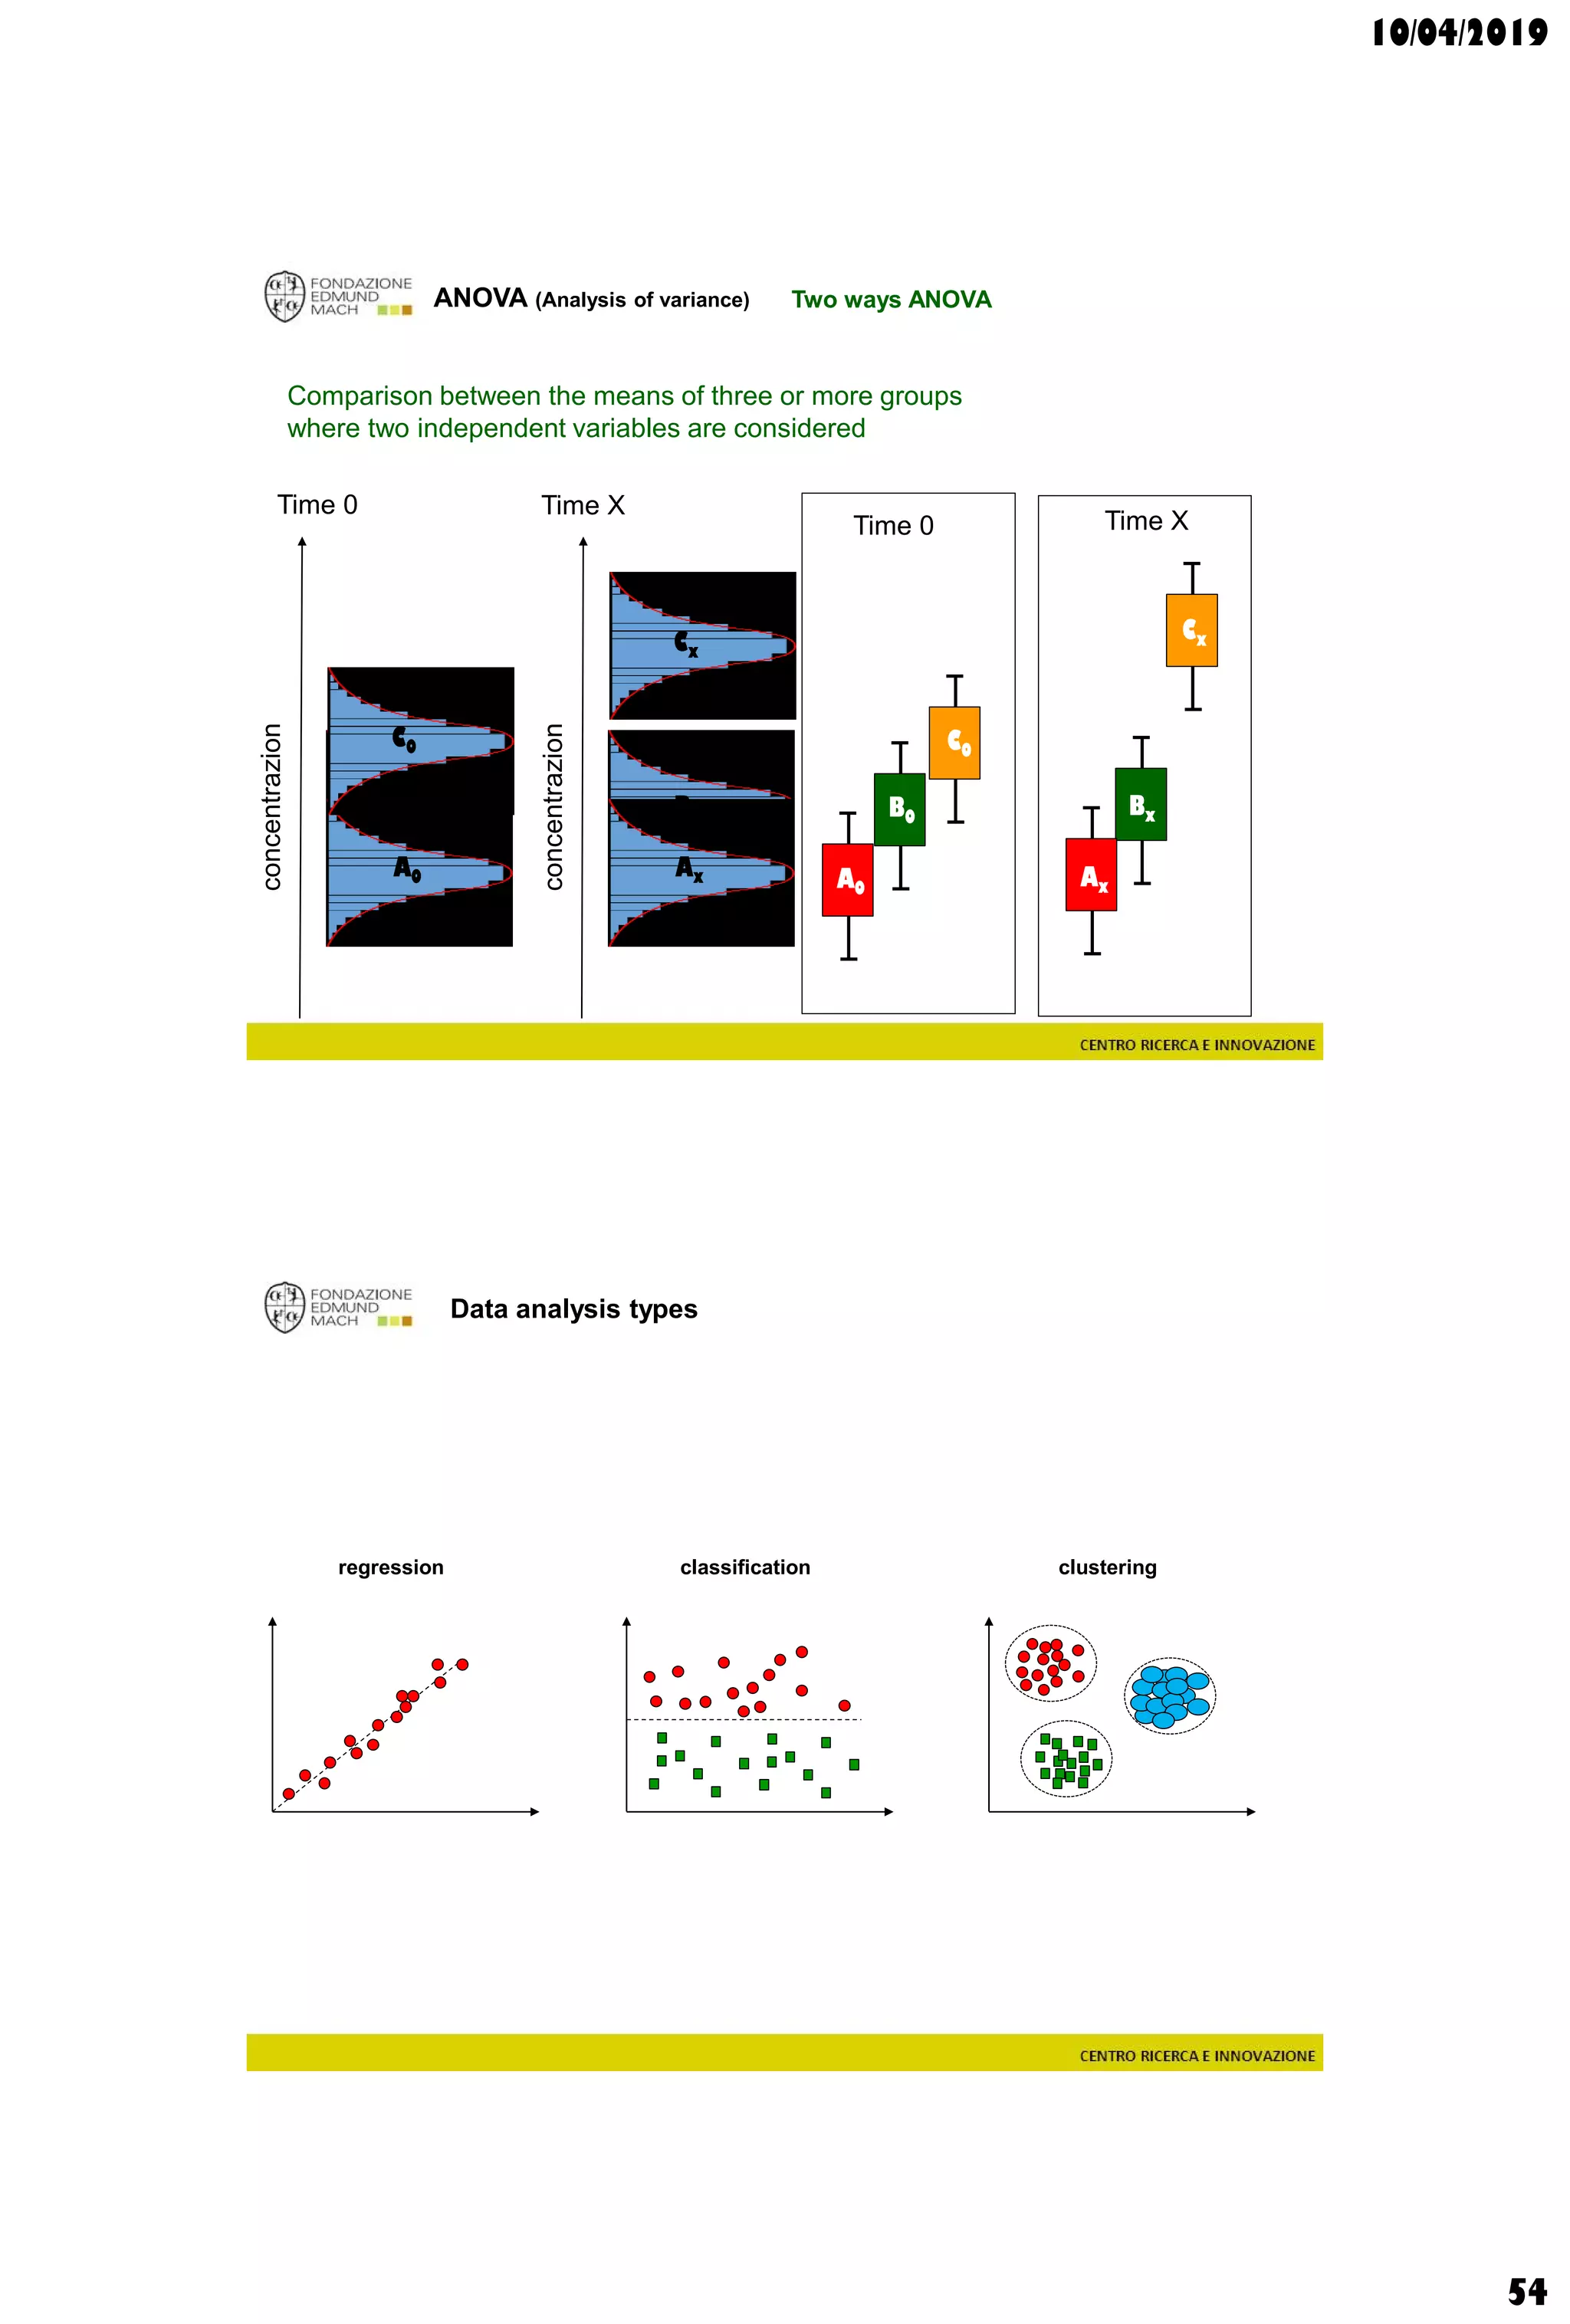
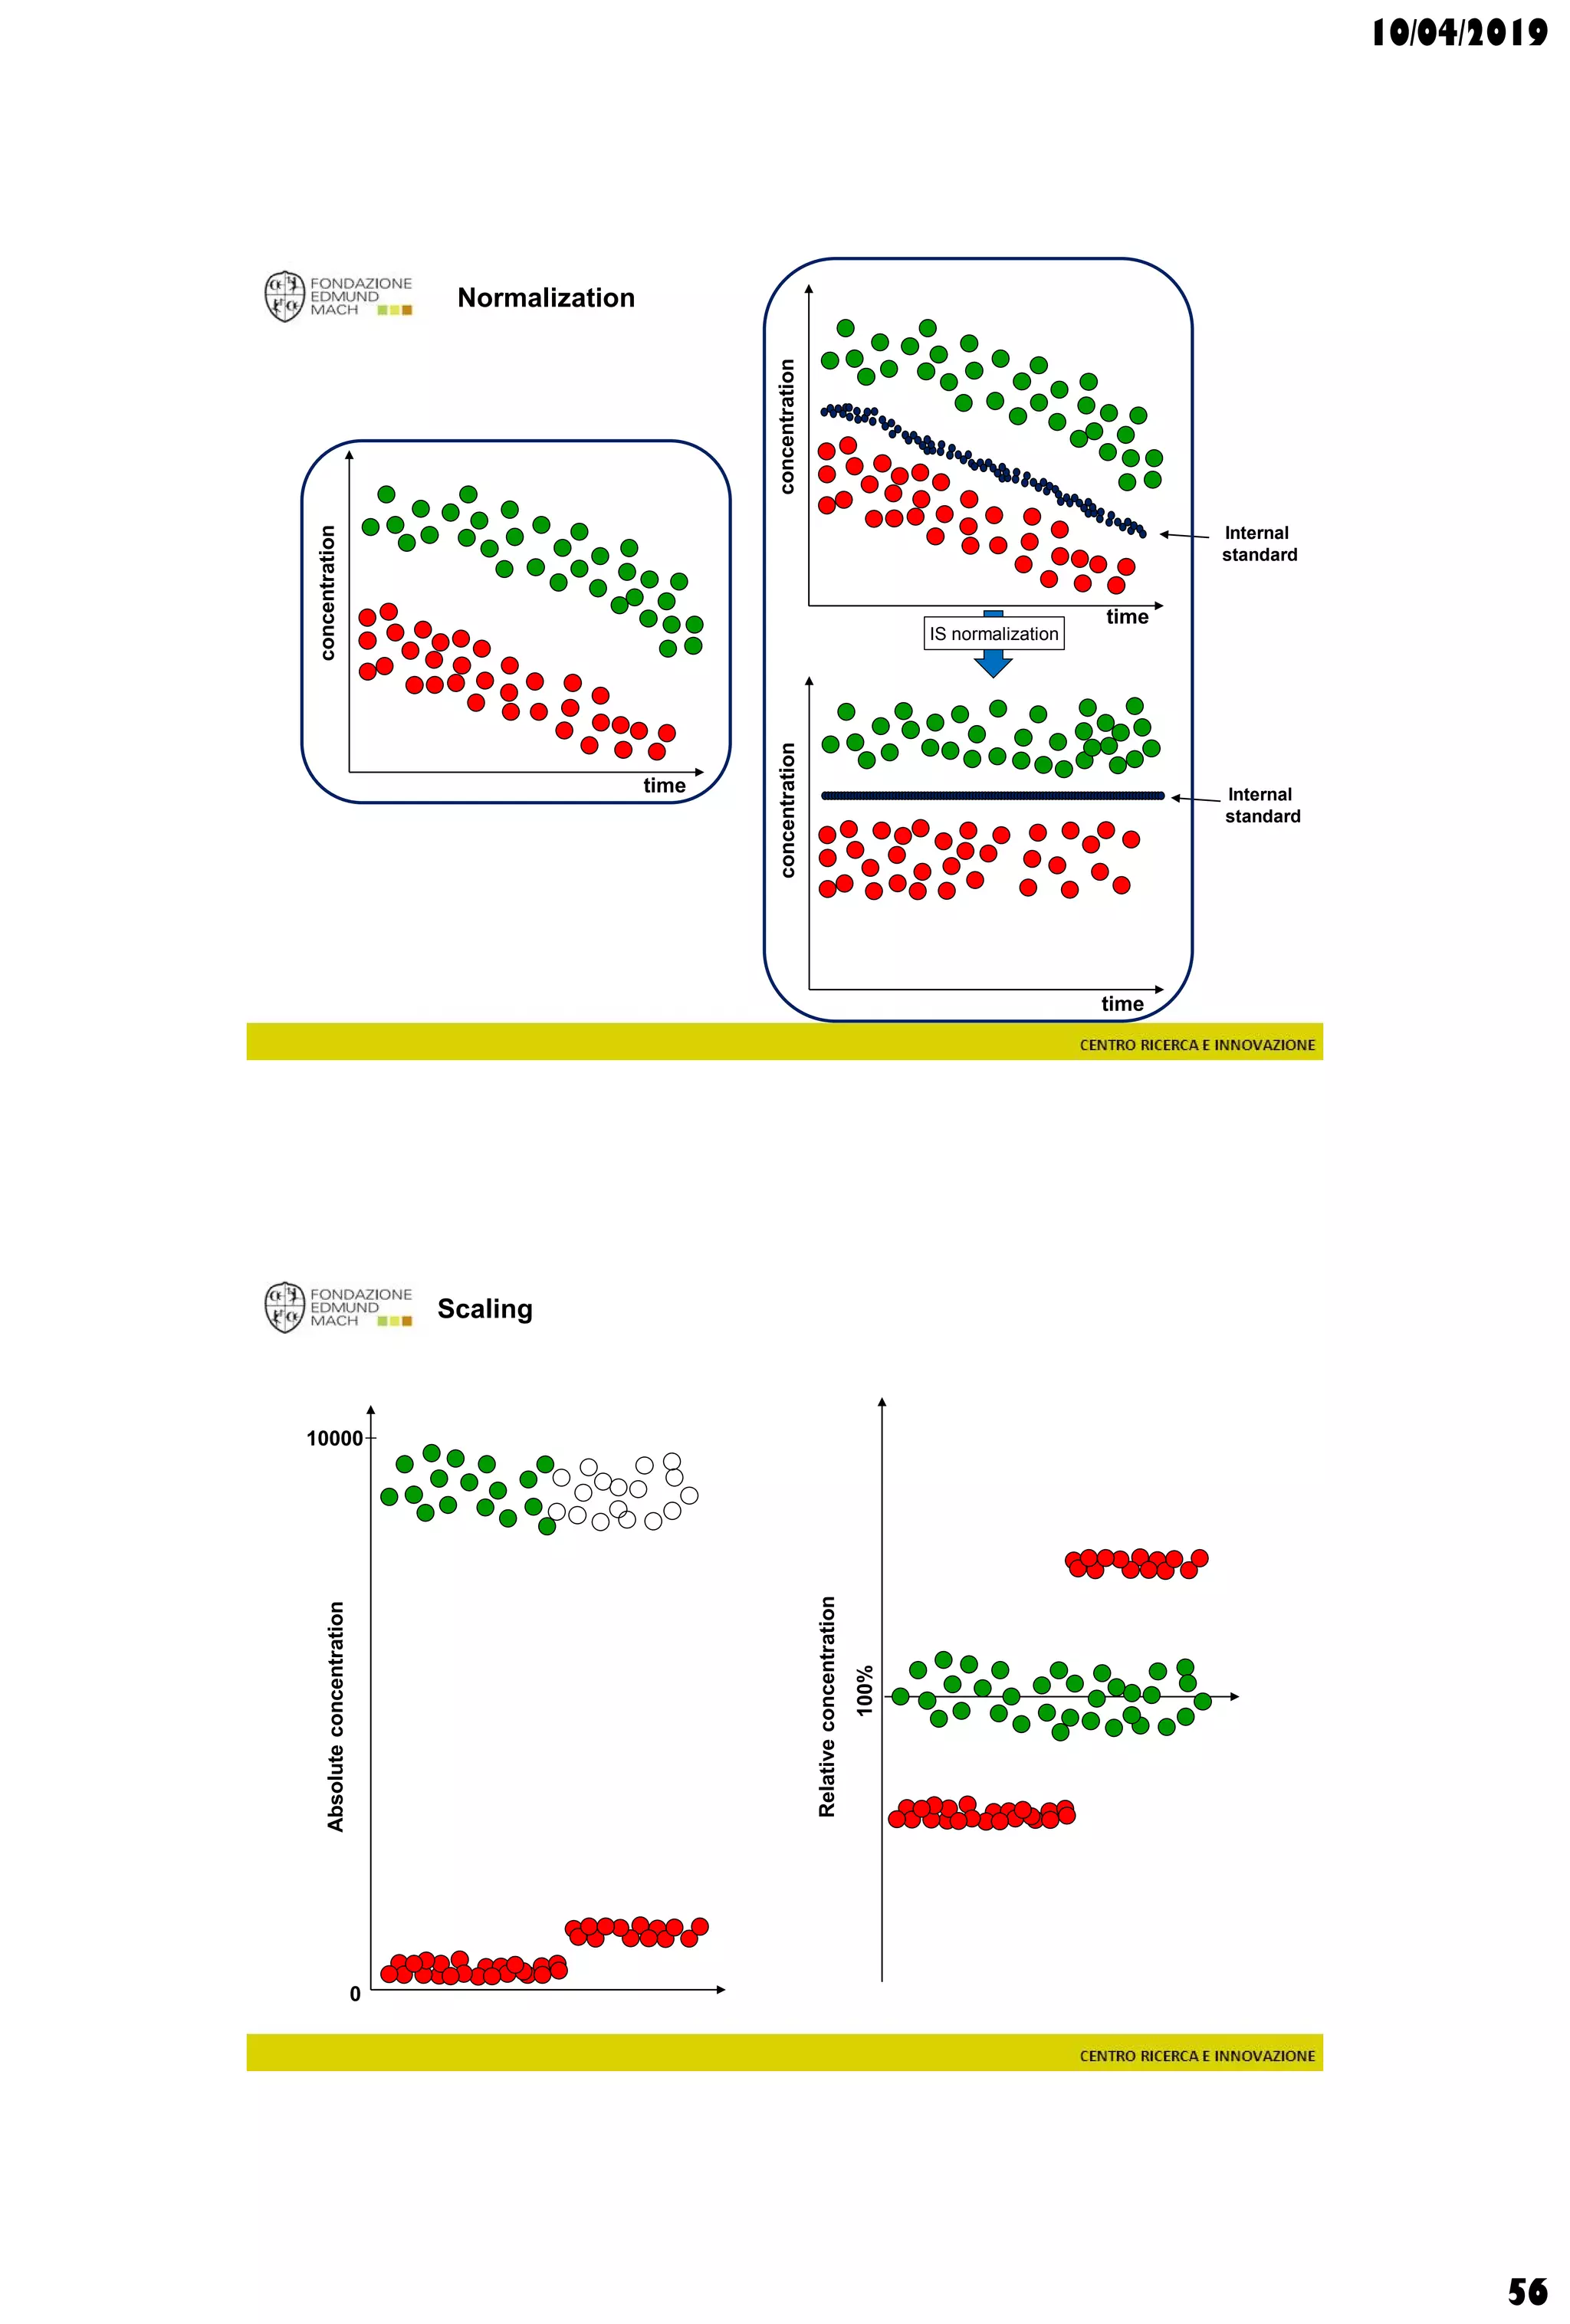
Data analysis types
supervisedunsupervised
-1200
-1100
-1000
-900
-800
-700
-600
-500
-400
-300
-200
-100
0
100
200
300
400
500
600
700
800
900
1000
1100
1200
-600 -500 -400 -300 -200 -100 0 100 200 300 400 500 600
t[1]
t[4]
Scores Comp[4] vs. Comp[1] colored by Variety
Chardonnay
Grillo
Inzolia
Muller
Pinot grigio
QC
Traminer
Hotelling’s T2 Ellipse (95%) = (559.1; 1139)
R2X[4] = 0.06998
R2X[1] = 0.2906
EZinf o 2 - nomacorc2_1QC (M3: PCA-X) - 2015-01-23 12:22:22 (UTC+1)
3 x Grillo
5 x Pinot gris
1 x Inzolia
1 x Muller Thurgau
1 x Chardonnay
1 x Traminer
QC](https://image.slidesharecdn.com/c3a2019-190410214616/75/Wine-and-grape-Metabolomics-Chapters-3-4-55-2048.jpg)


![GAS CHROMATOGRAPHY-MASS SPECTROSCOPY [GC-MS]](https://cdn.slidesharecdn.com/ss_thumbnails/42-191218144856-thumbnail.jpg?width=640&height=640&fit=bounds)


![Interfaces in chromatography [LC-MS, GC-MS, HPTLC, LC, GC]](https://cdn.slidesharecdn.com/ss_thumbnails/34-191218130611-thumbnail.jpg?width=640&height=640&fit=bounds)