


![Guideline Recommendations Are Becoming More Aggressive 2007 ADA standards 1 “ The A1C goal for patients in general is an A1C goal of <7%.” “ The A1C goal for the individual patient is an A1C as close to normal (<6%) as possible without significant hypoglycemia .” [boldface added] ADA=American Diabetes Association; EASD=European Association for the Study of Diabetes. 1. American Diabetes Association. Diabetes Care . 2007;30(suppl 1):S4–S41. 2. Nathan DM et al. Diabetes Care. 2006;29:1963–1972. ADA/EASD consensus statement 2 “ If lifestyle intervention and maximal tolerated dose of metformin fail to achieve or sustain glycemic goals, another medication should be added within 2–3 months of the initiation of therapy or at any time when A1C goal is not achieved.” [boldface added]](https://image.slidesharecdn.com/whats-new-in-diabetes-1197901659416561-4/75/Whats-New-in-Diabetes-10-2048.jpg)


![No Single Class of Oral Antihyperglycemic Monotherapy Targets All Key Pathophysiologies Major Pathophysiologies 1. Glyset [package insert]. New York, NY: Pfizer Inc; 2004. 2. Precose [package insert]. West Haven, Conn: Bayer; 2004. 3. Prandin [package insert]. Princeton, NJ: Novo Nordisk; 2006. 4. Diabeta [package insert]. Bridgewater, NJ: Sanofi-Aventis; 2007. 5. Glucotrol [package insert]. New York, NY: Pfizer Inc; 2006. 6. Actos [package insert]. Lincolnshire, Ill: Takeda Pharmaceuticals; 2004. 7. Avandia [package insert]. Research Triangle Park, NC: GlaxoSmithKline; 2005. 8. Glucophage [package insert]. Princeton, NJ: Bristol-Myers Squibb; 2004. Excess hepatic glucose output Meglitinides 3 Insulin resistance Insulin deficiency DPP-4 Inhibitors Metformin 8 TZDs 6,7 SUs 4,5 Alpha-Glucosidase Inhibitors 1,2 Intestinal glucose absorption](https://image.slidesharecdn.com/whats-new-in-diabetes-1197901659416561-4/75/Whats-New-in-Diabetes-59-2048.jpg)


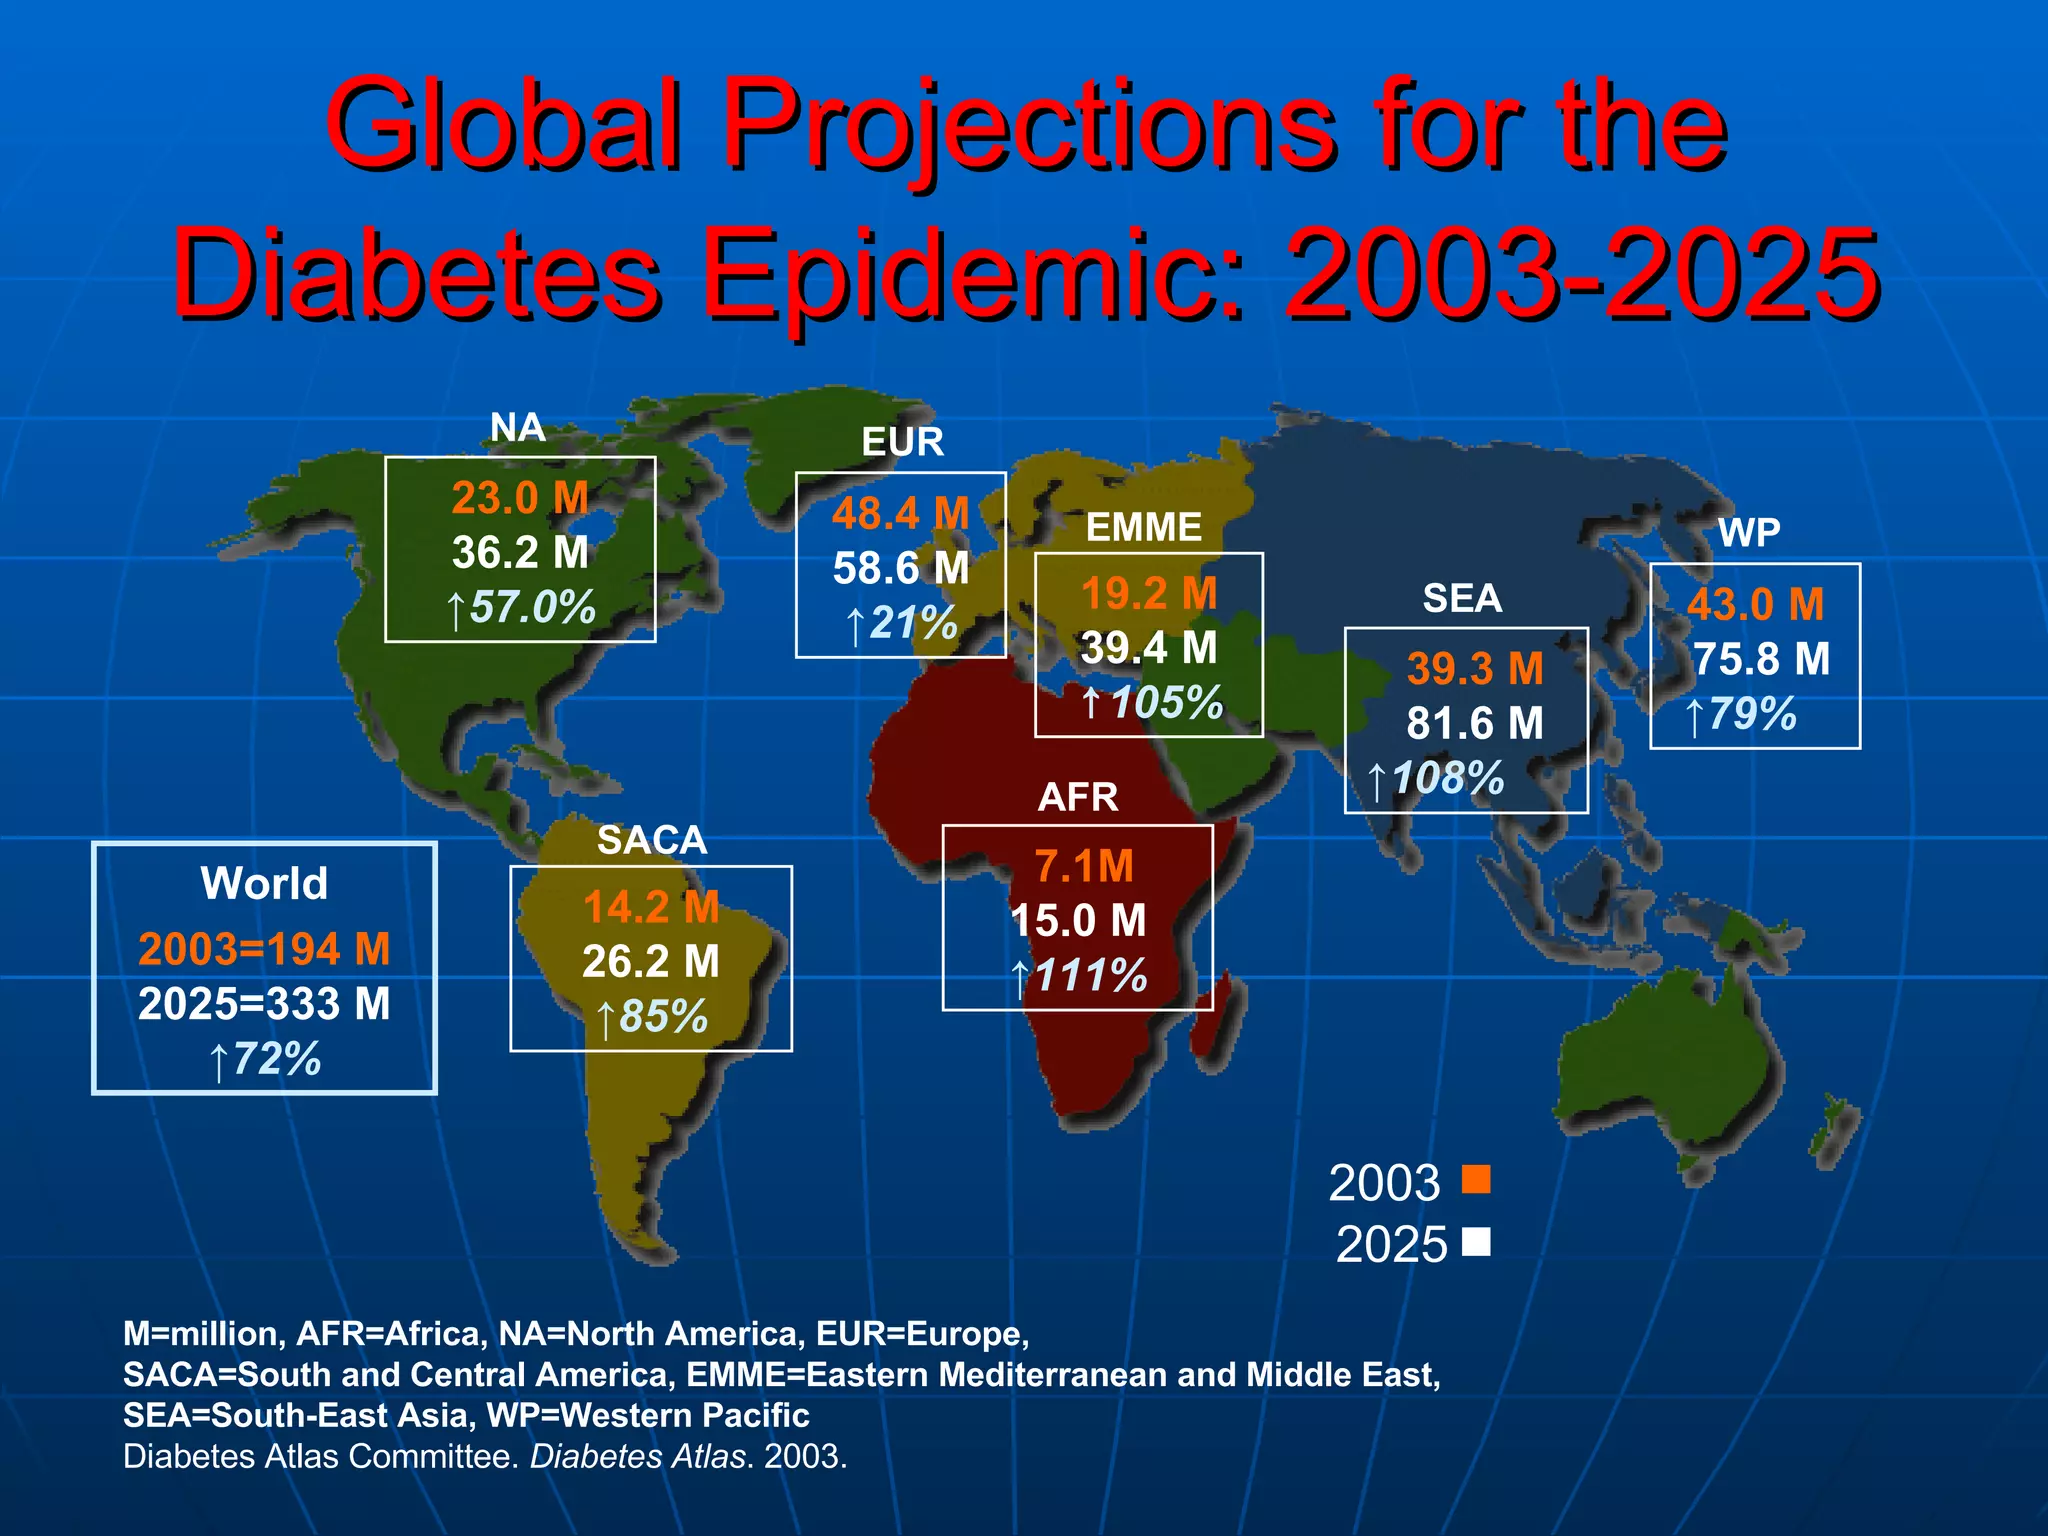
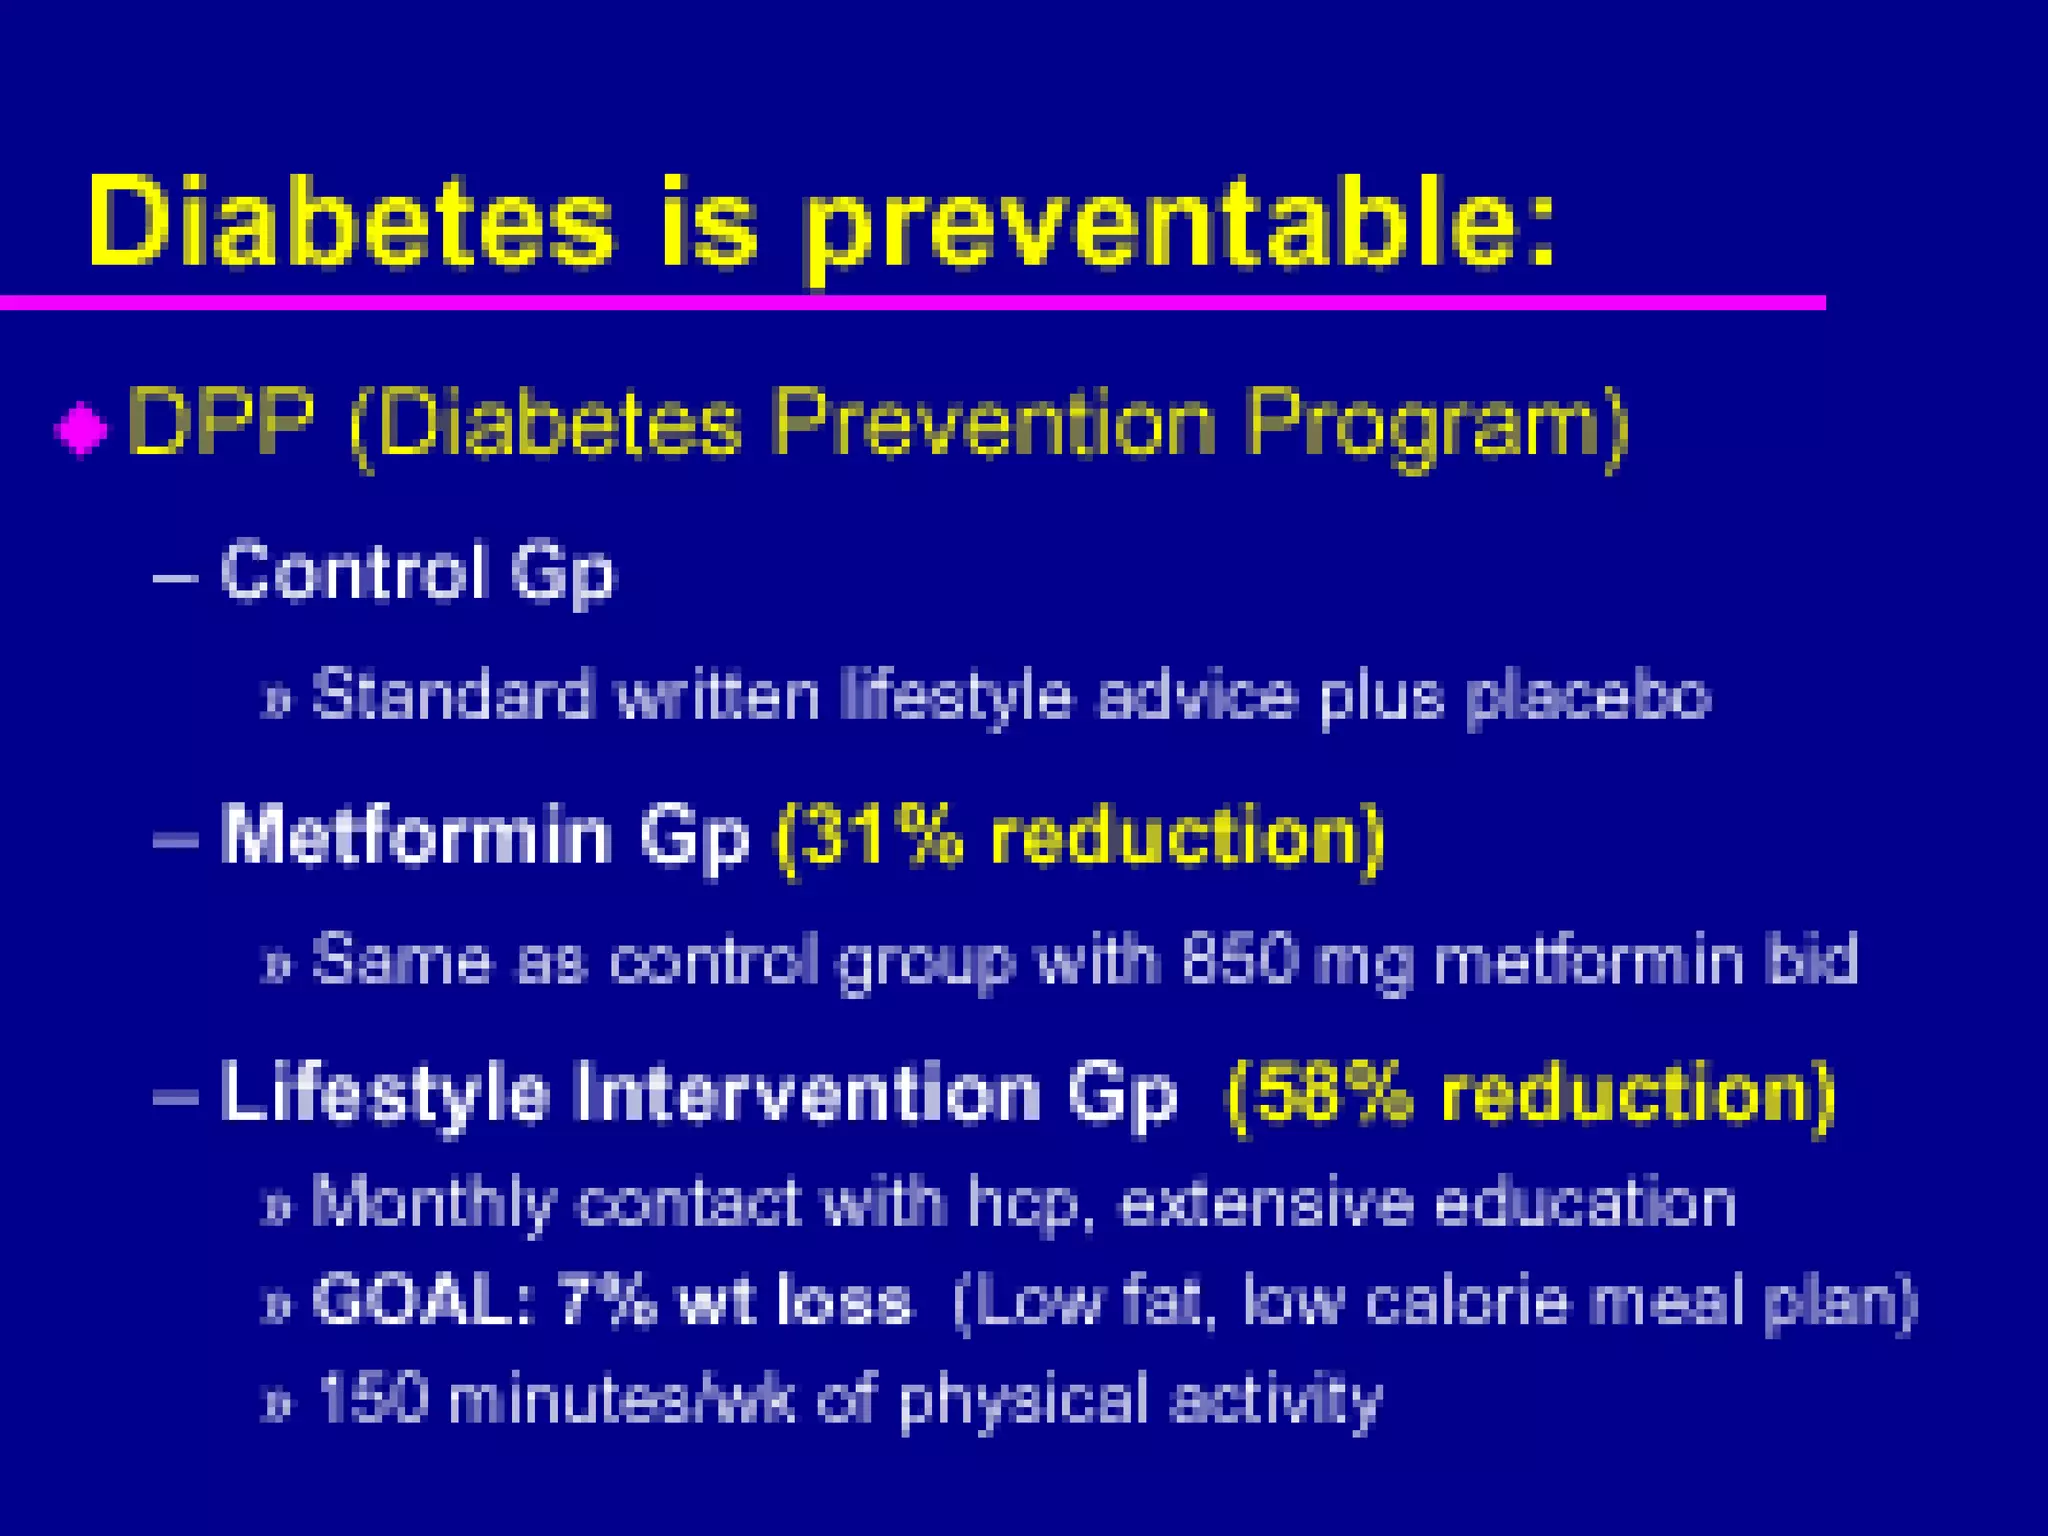
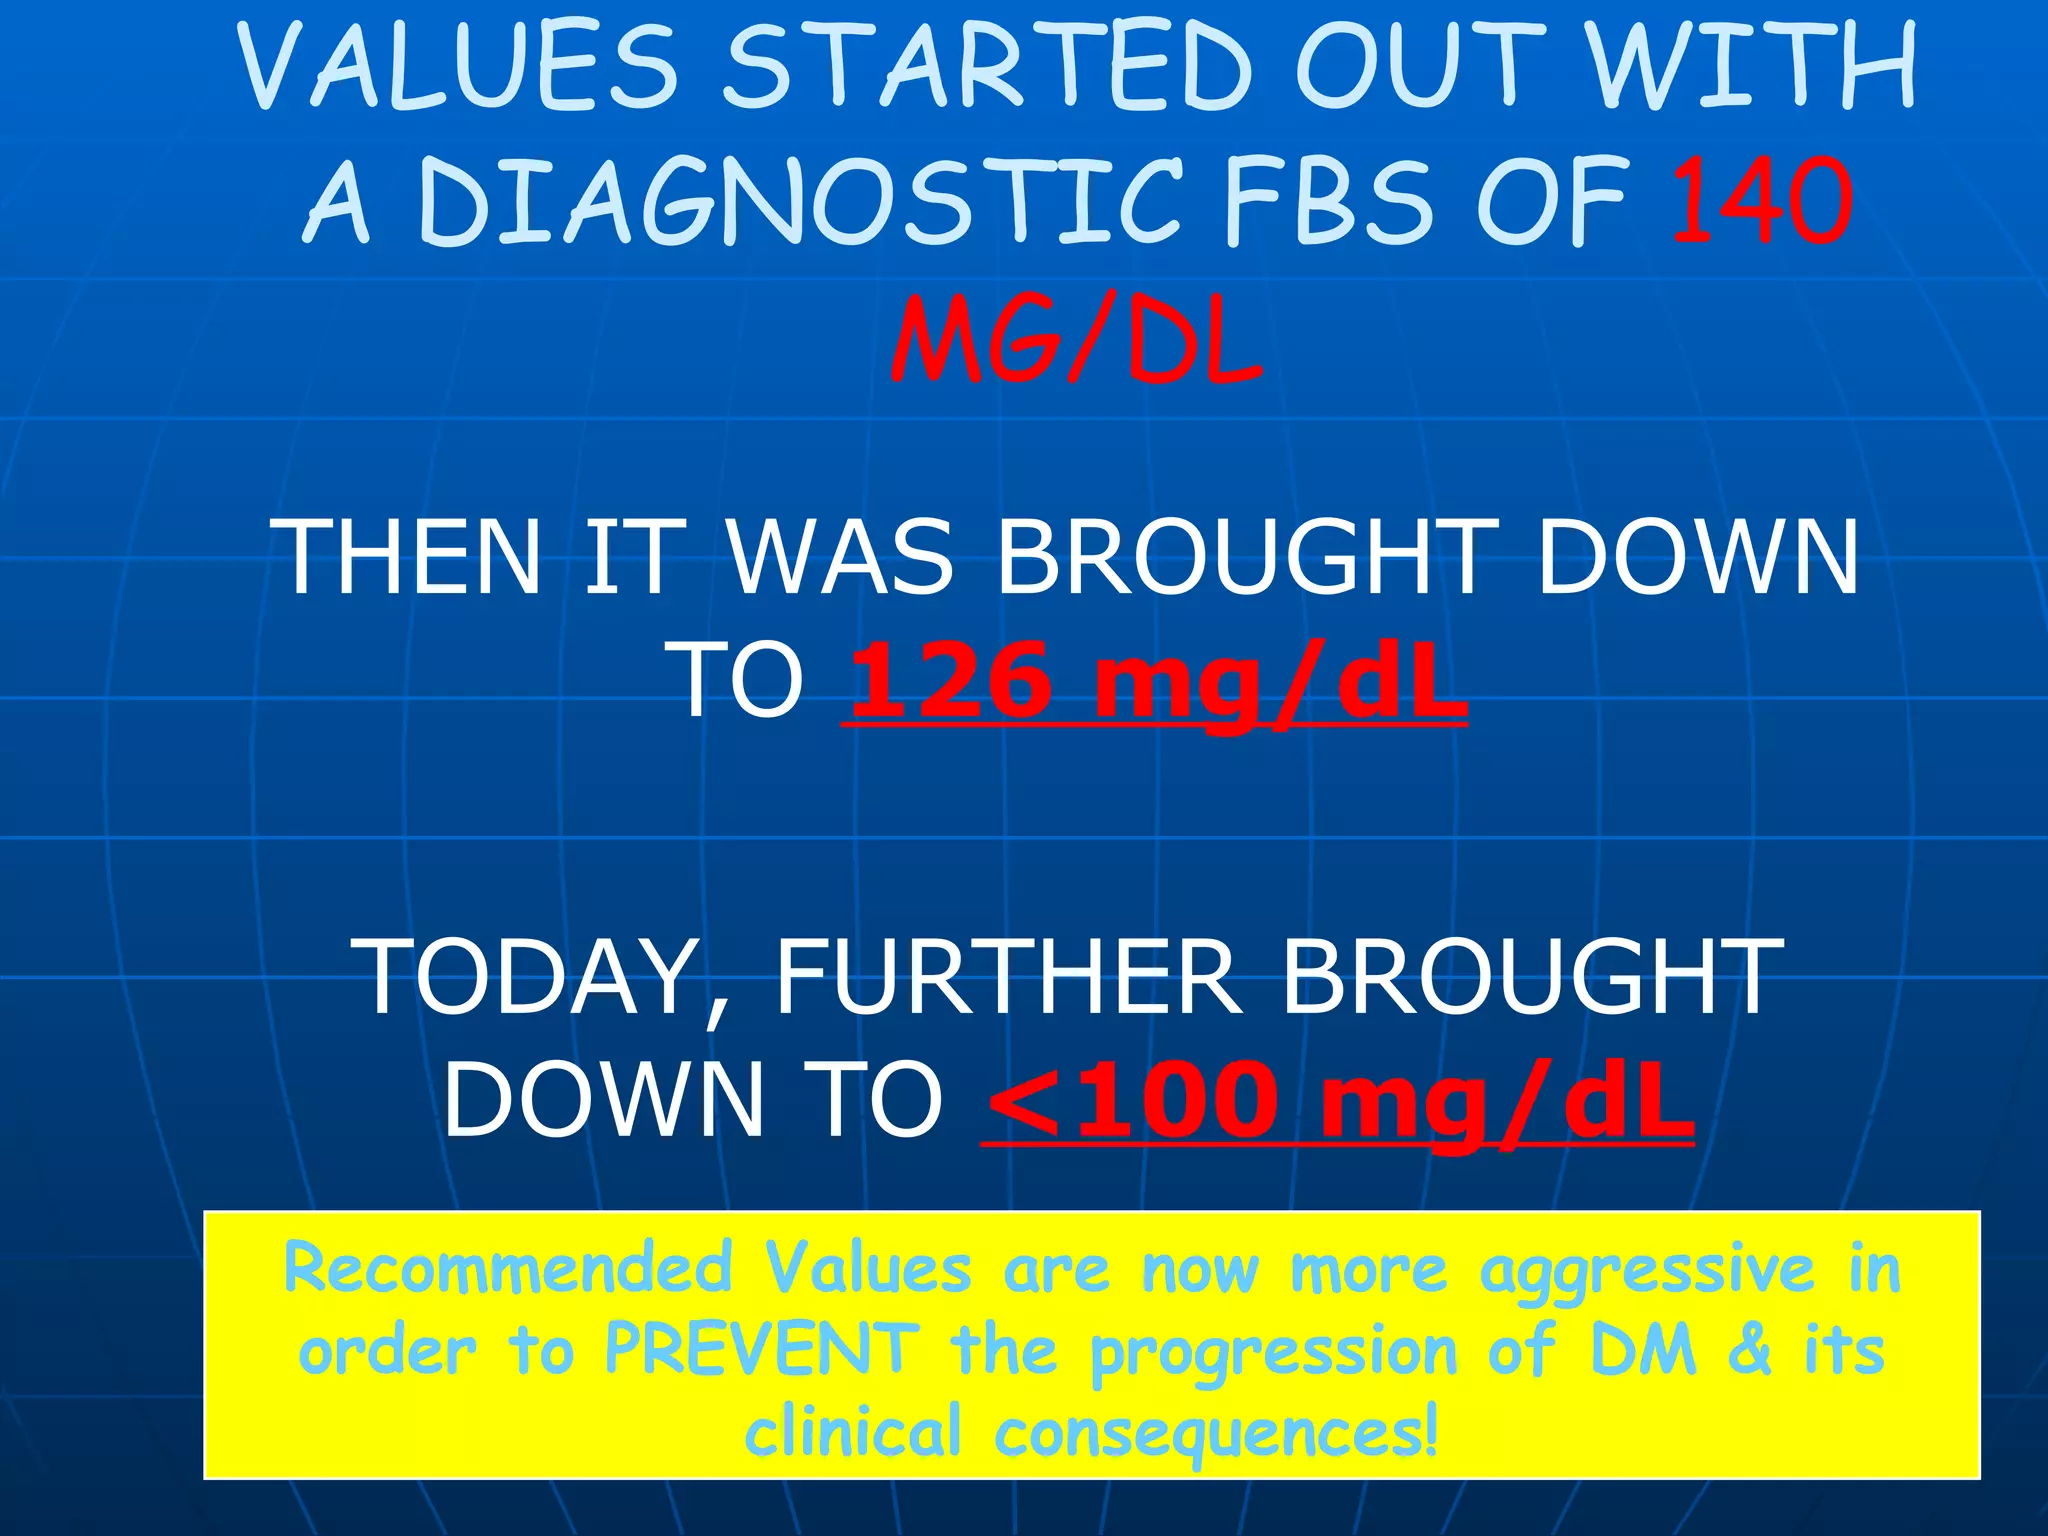
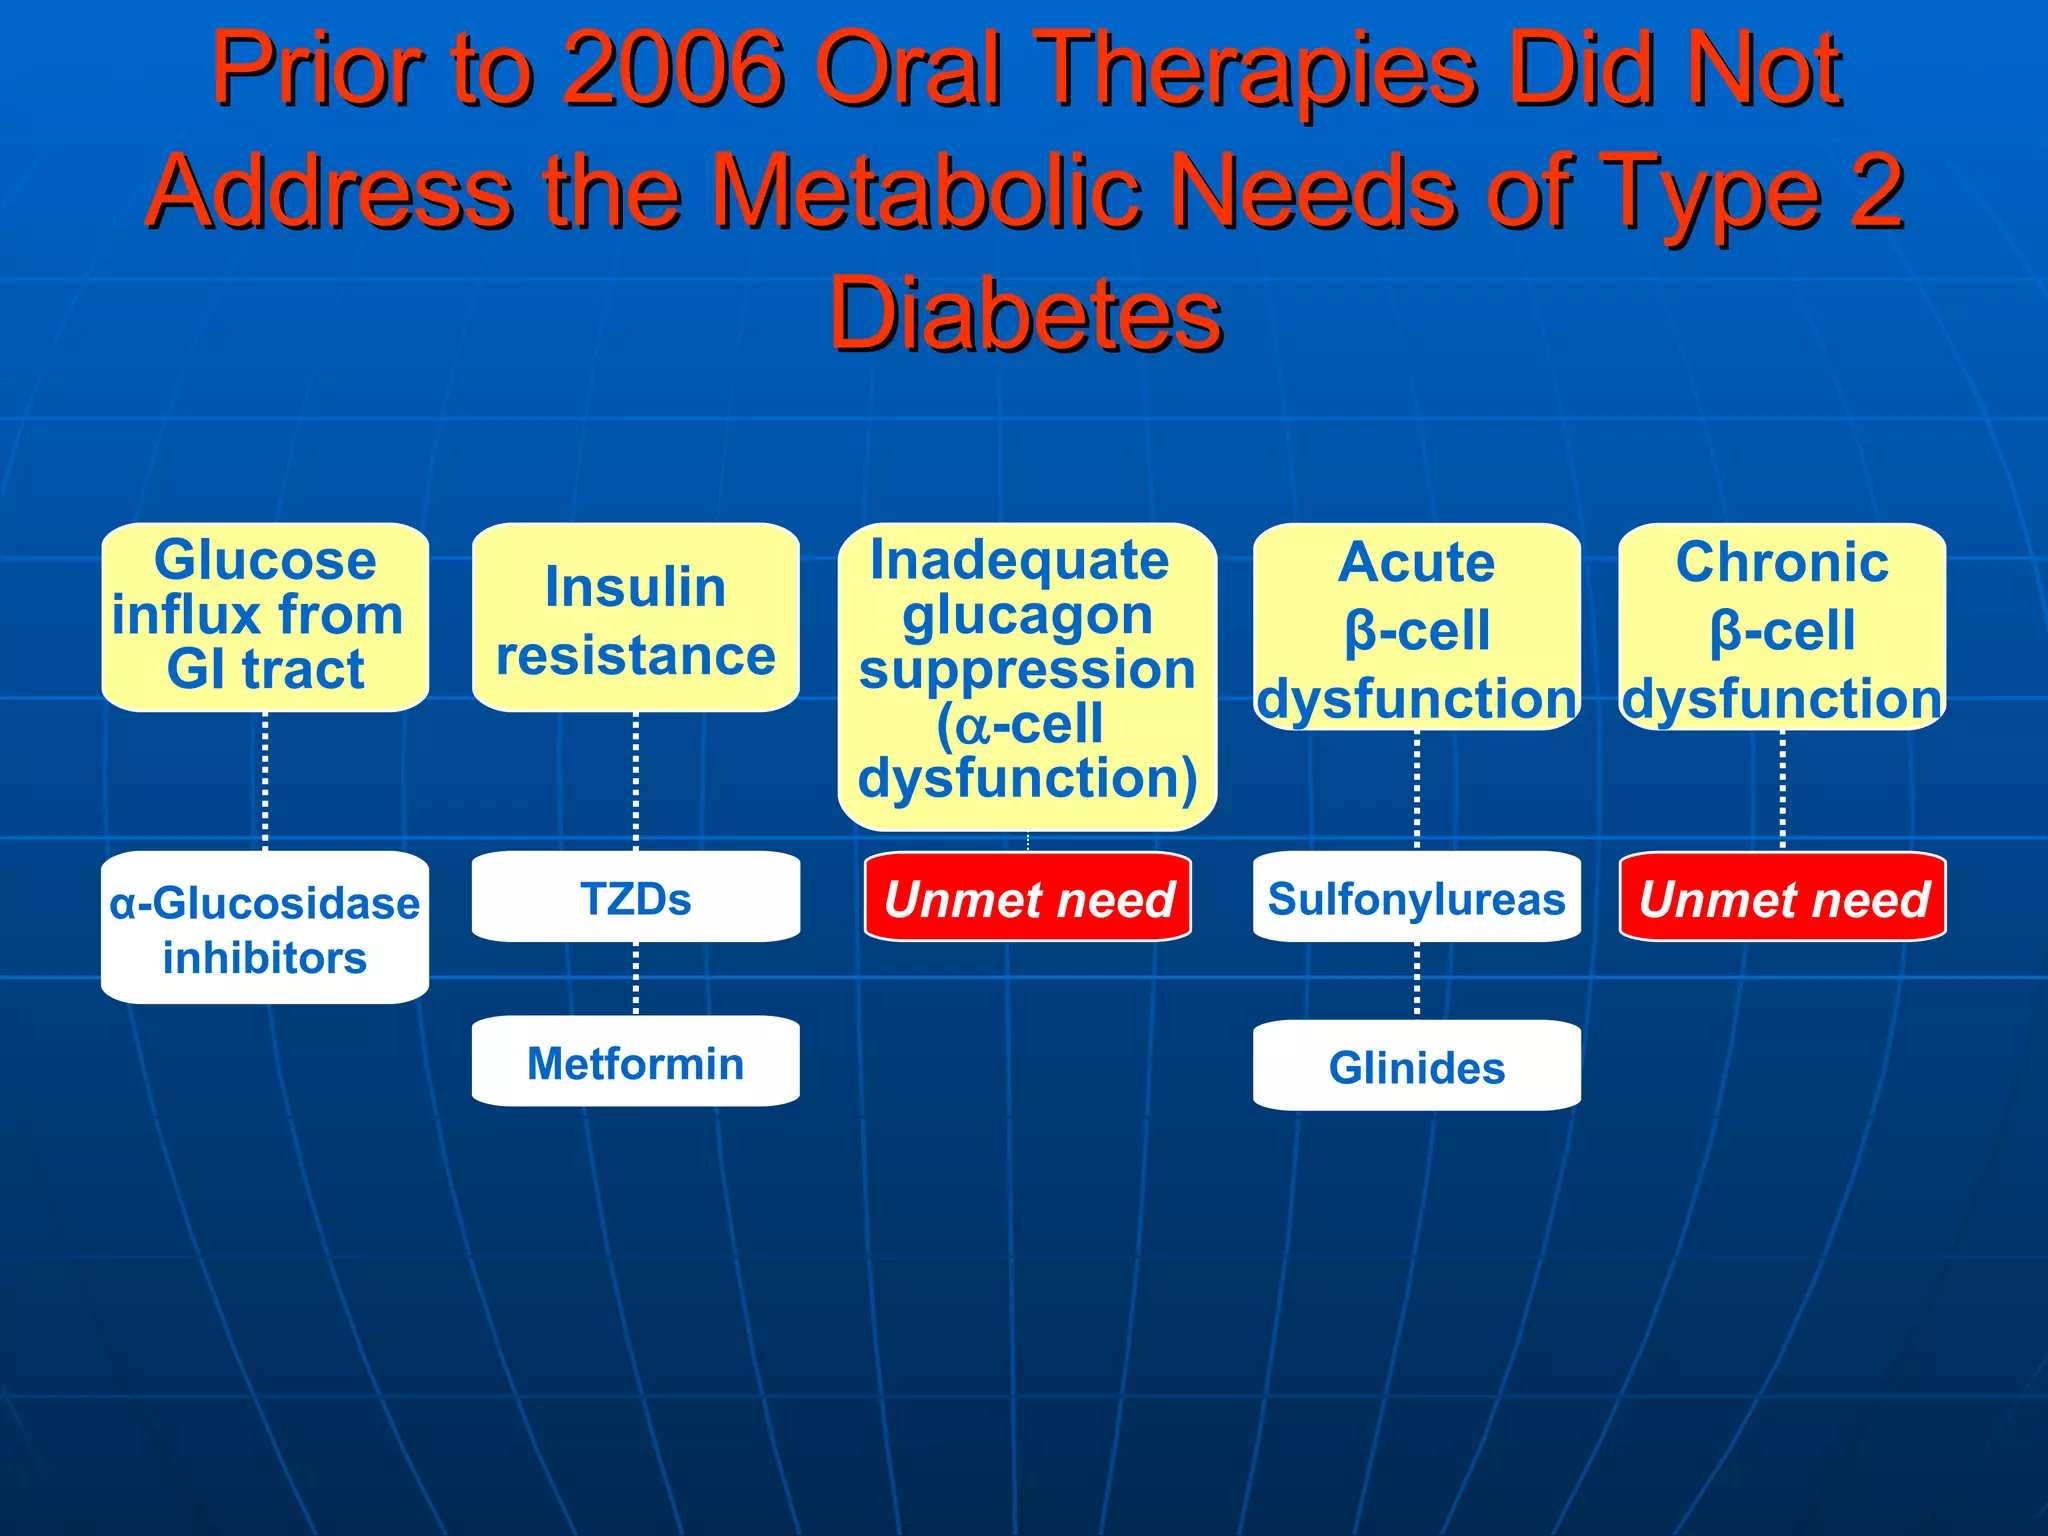
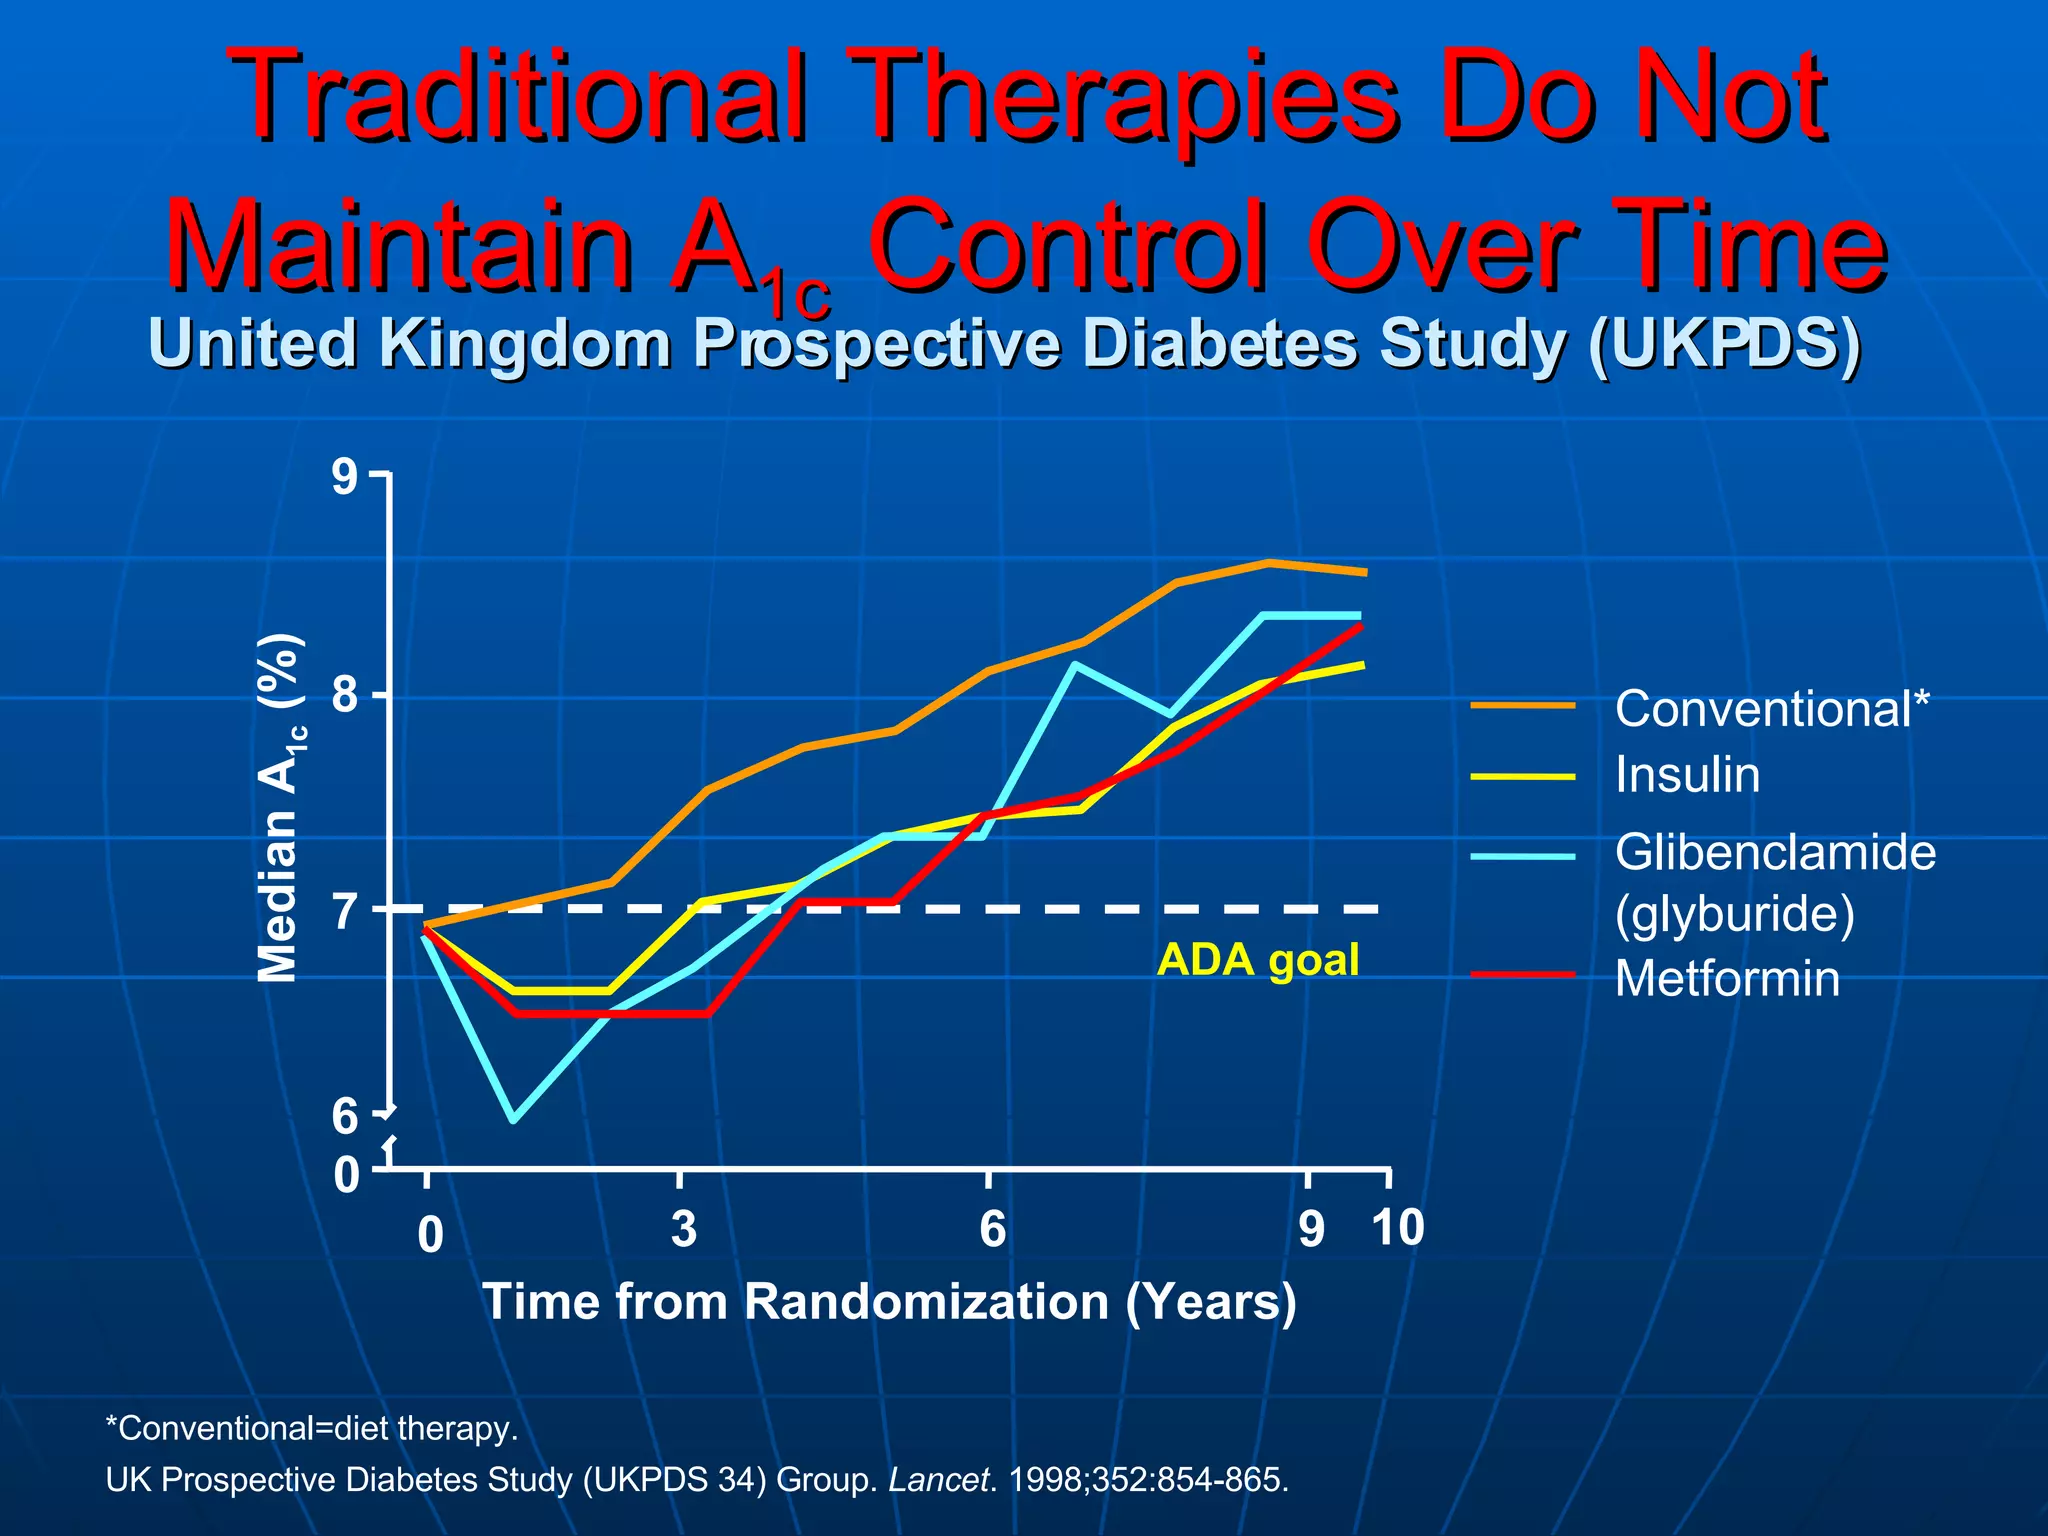
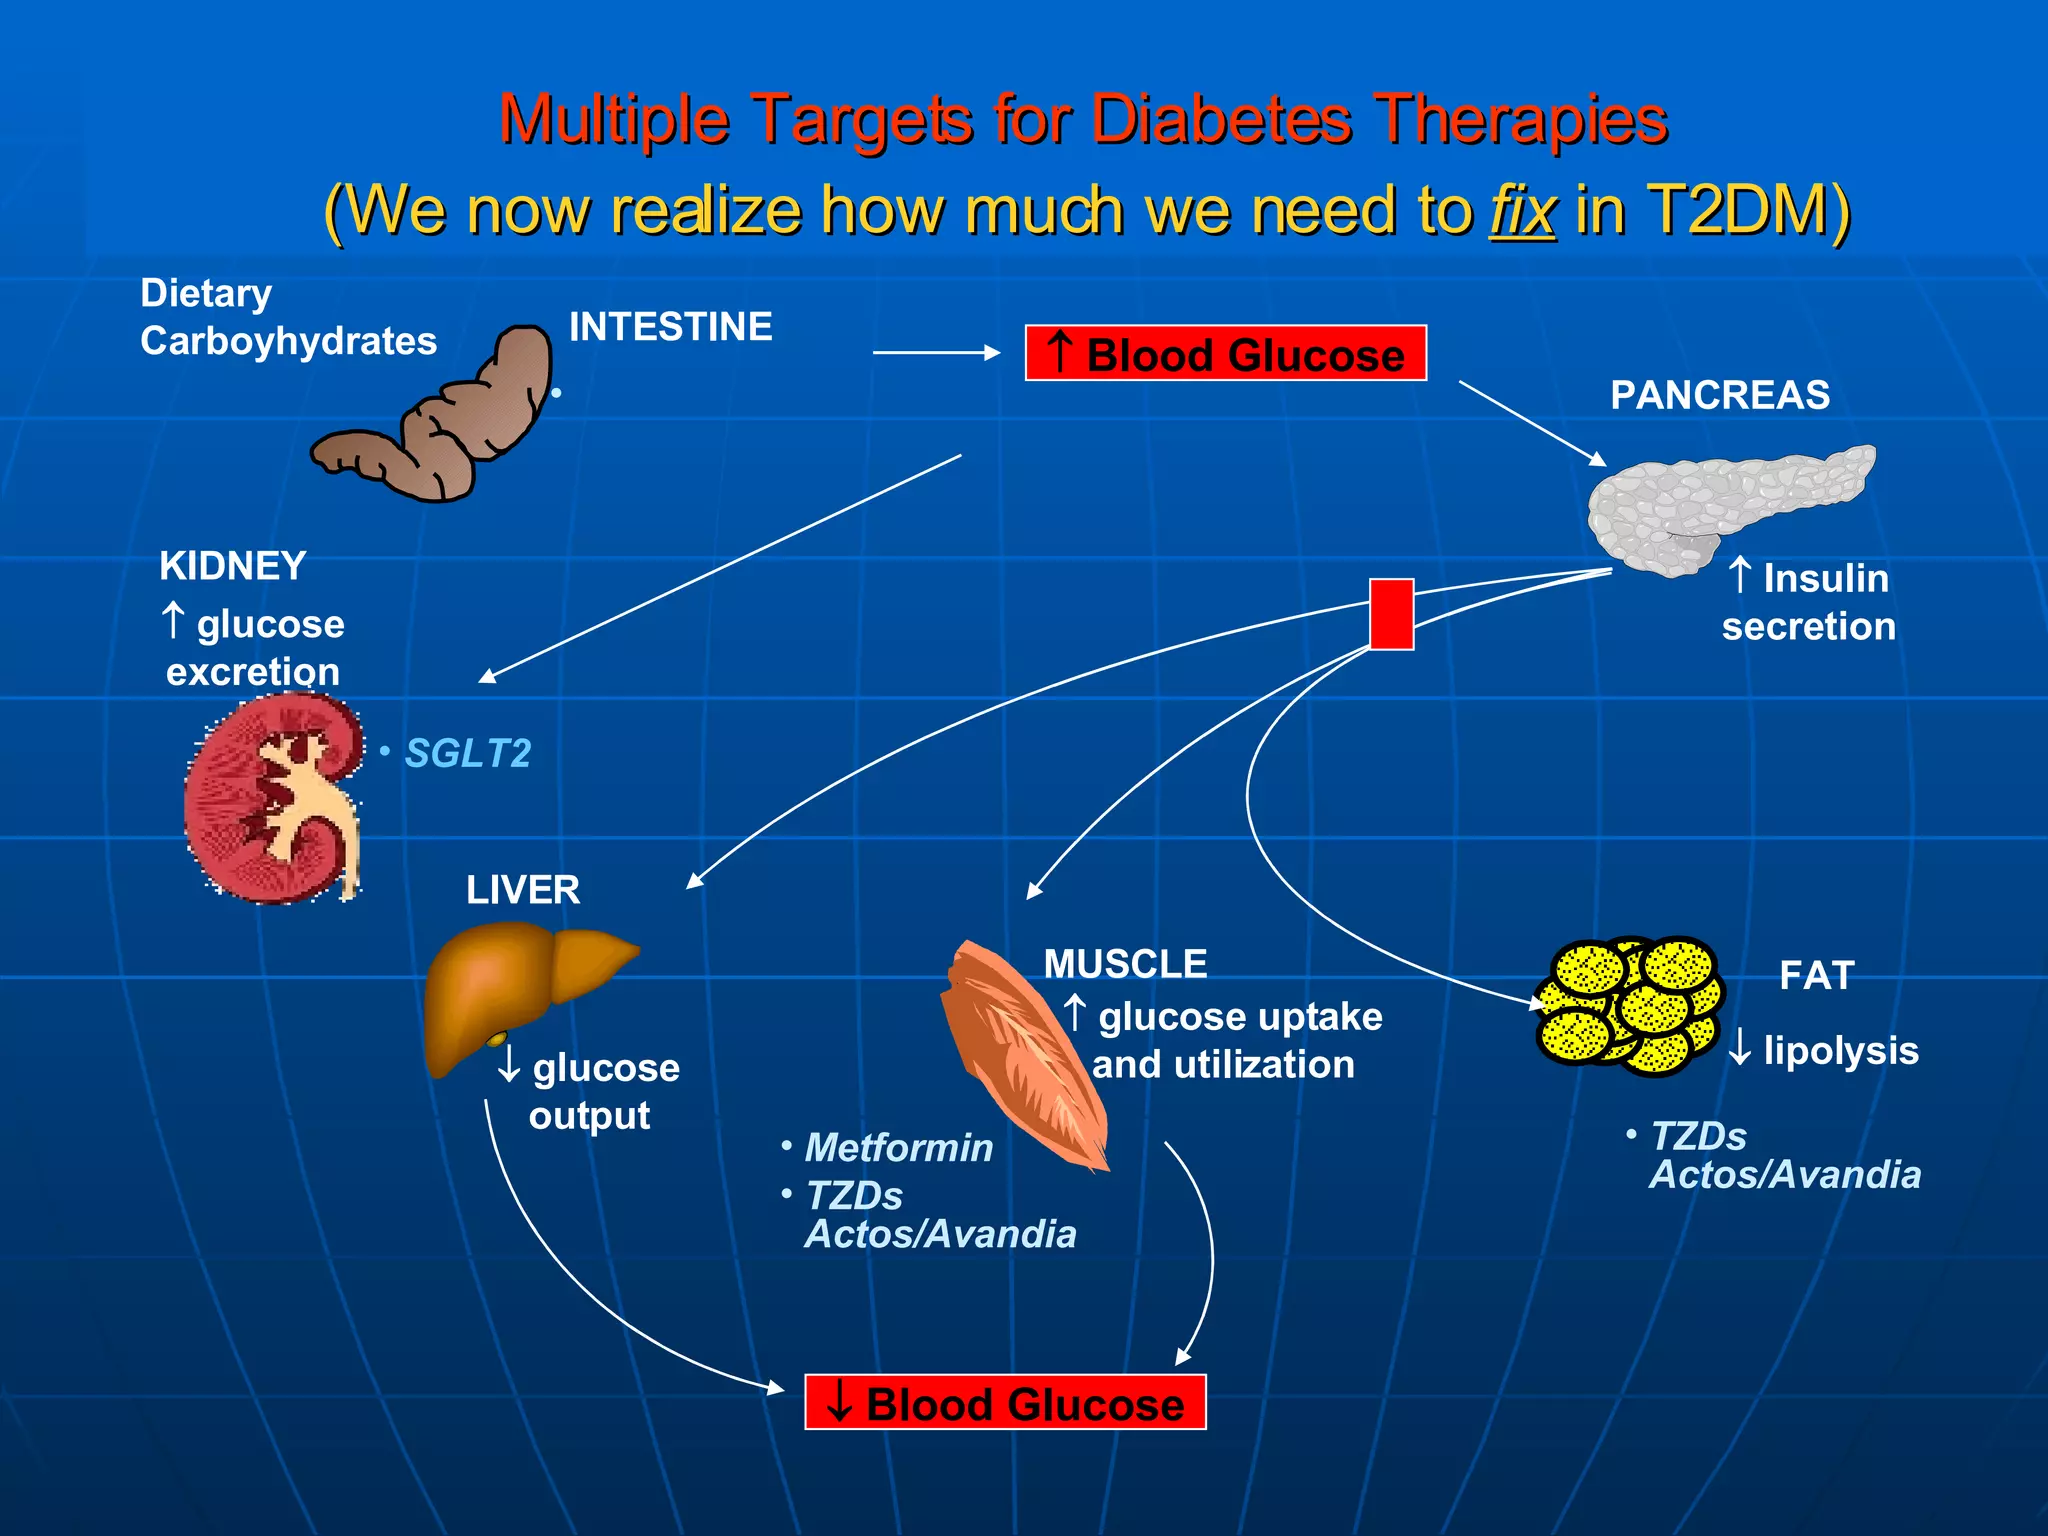
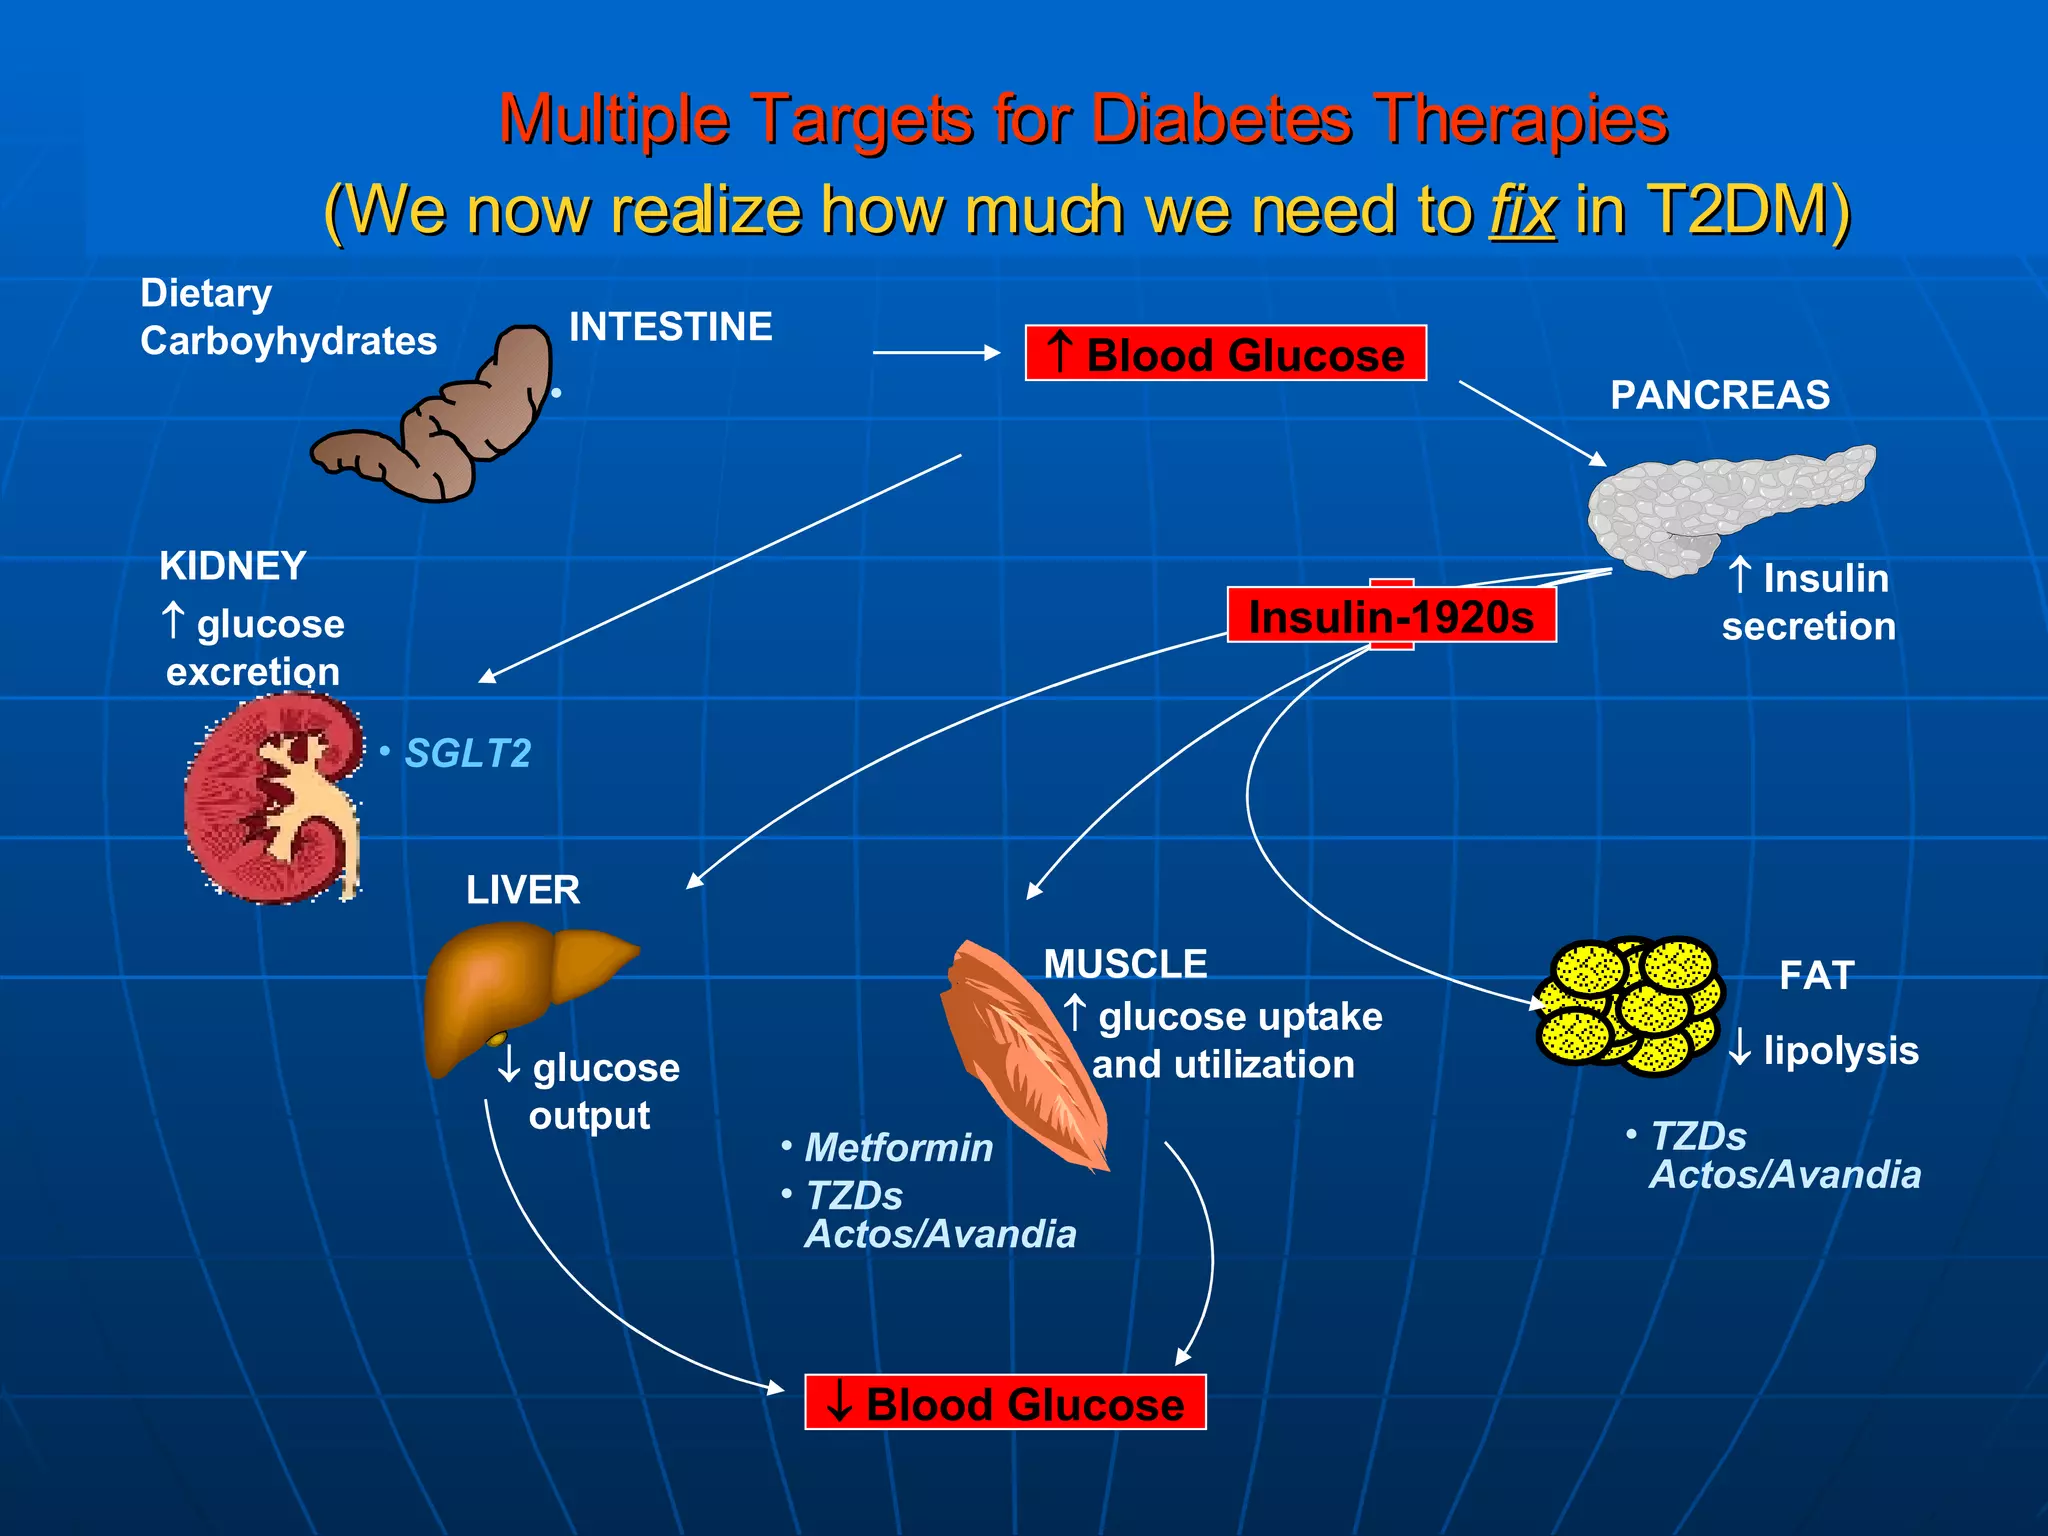
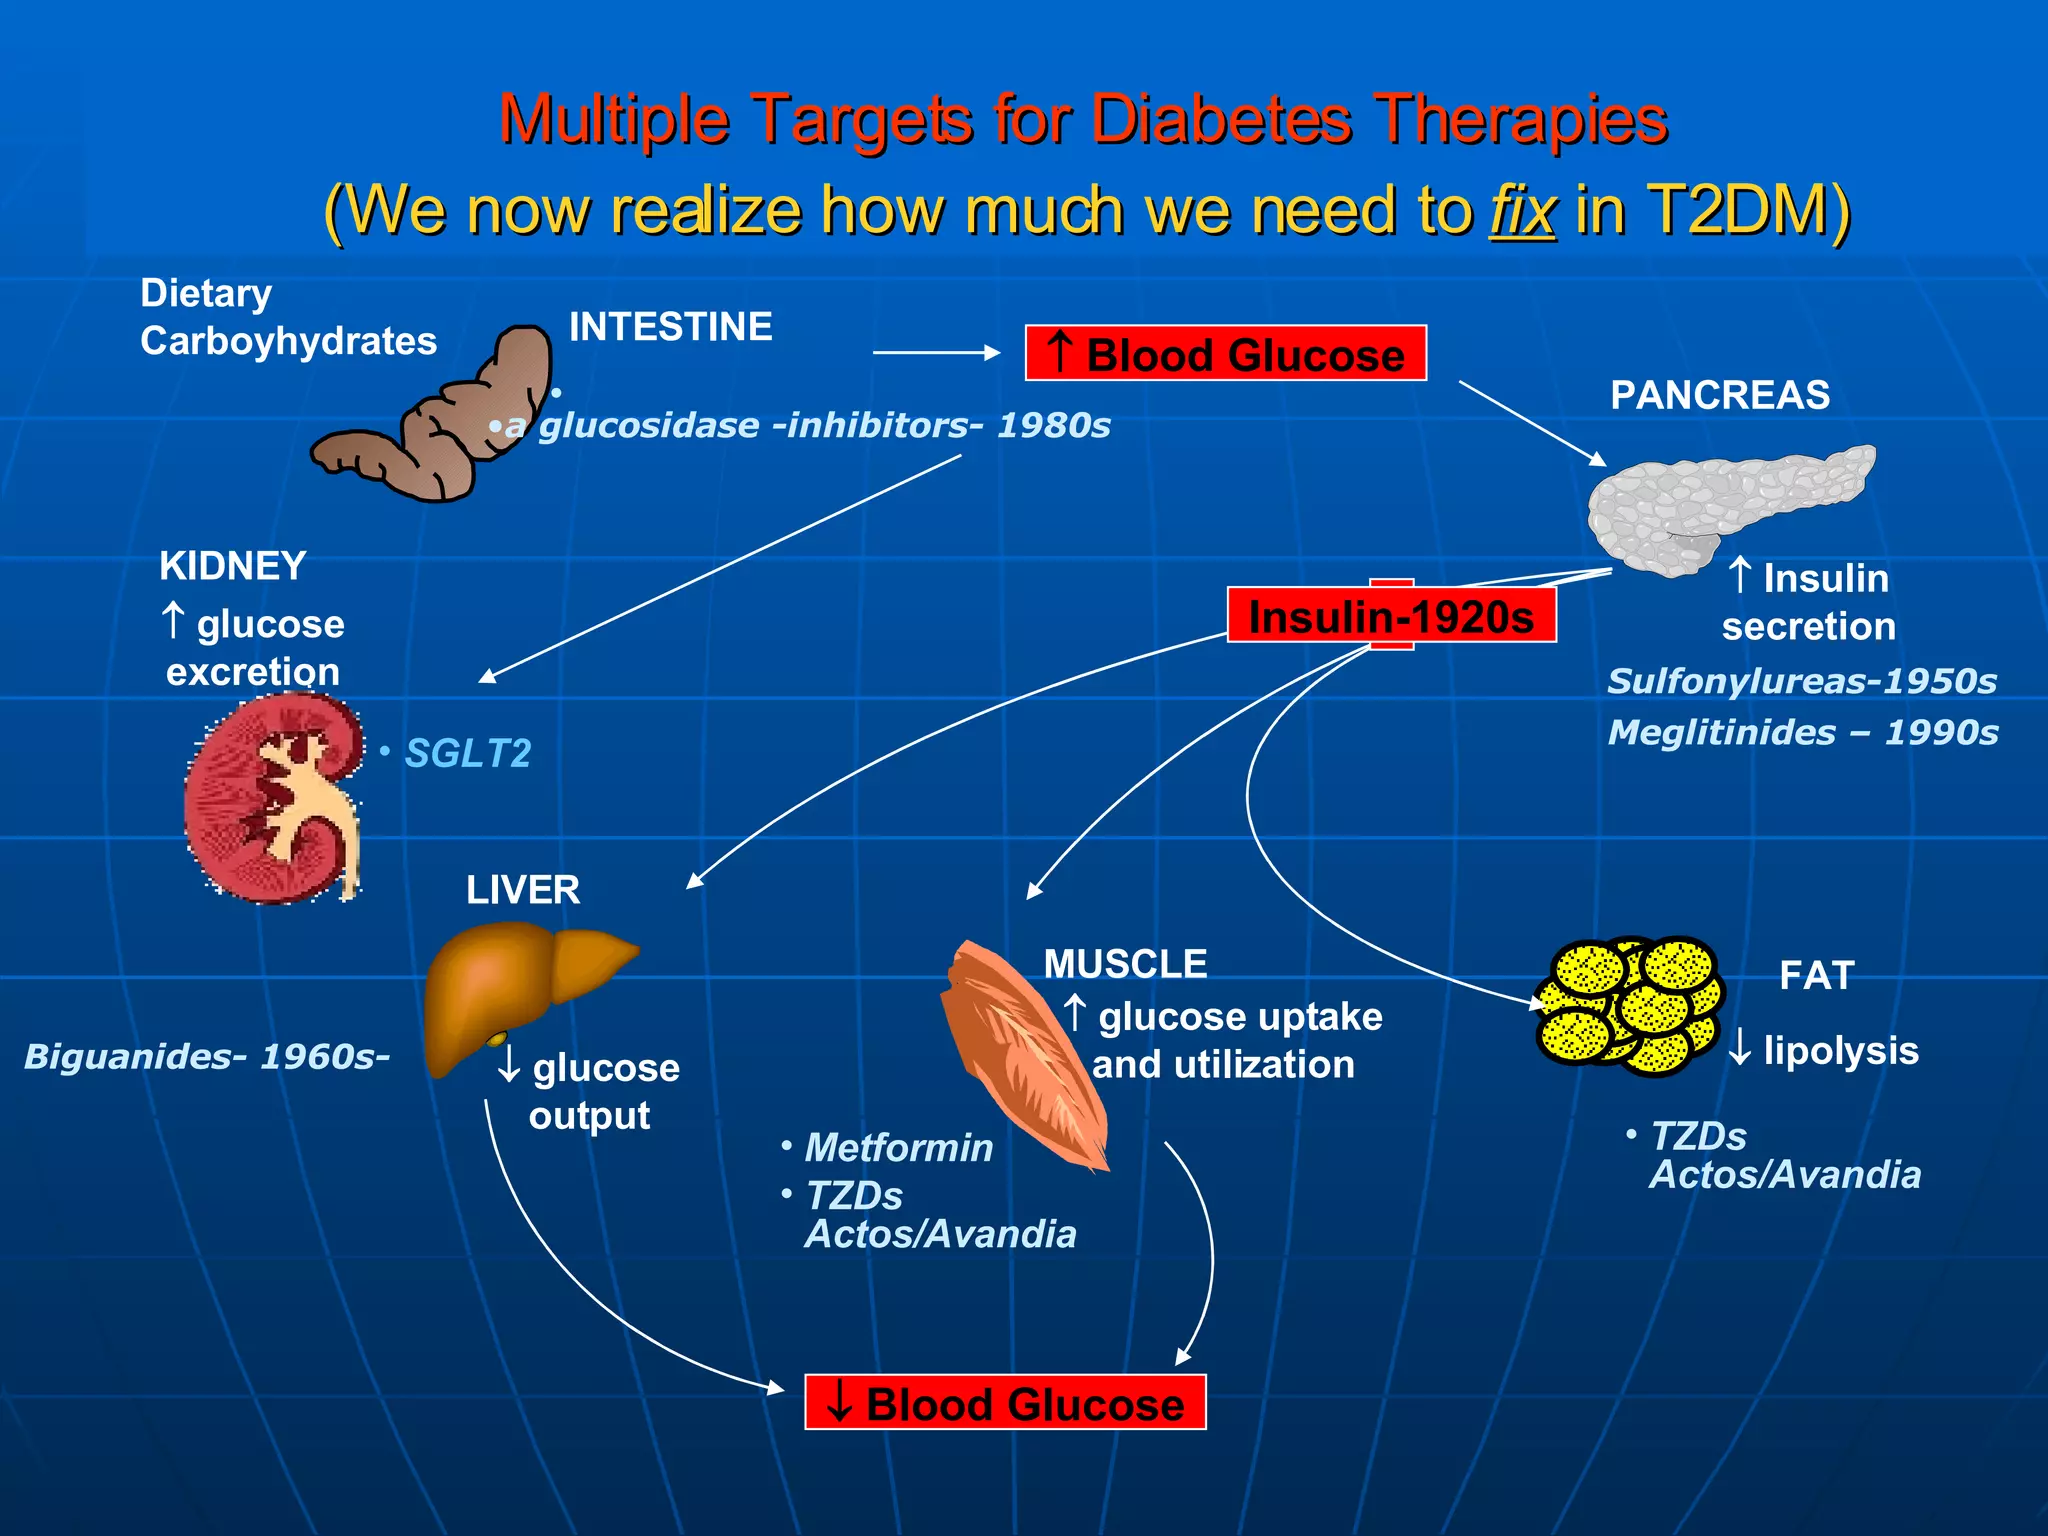
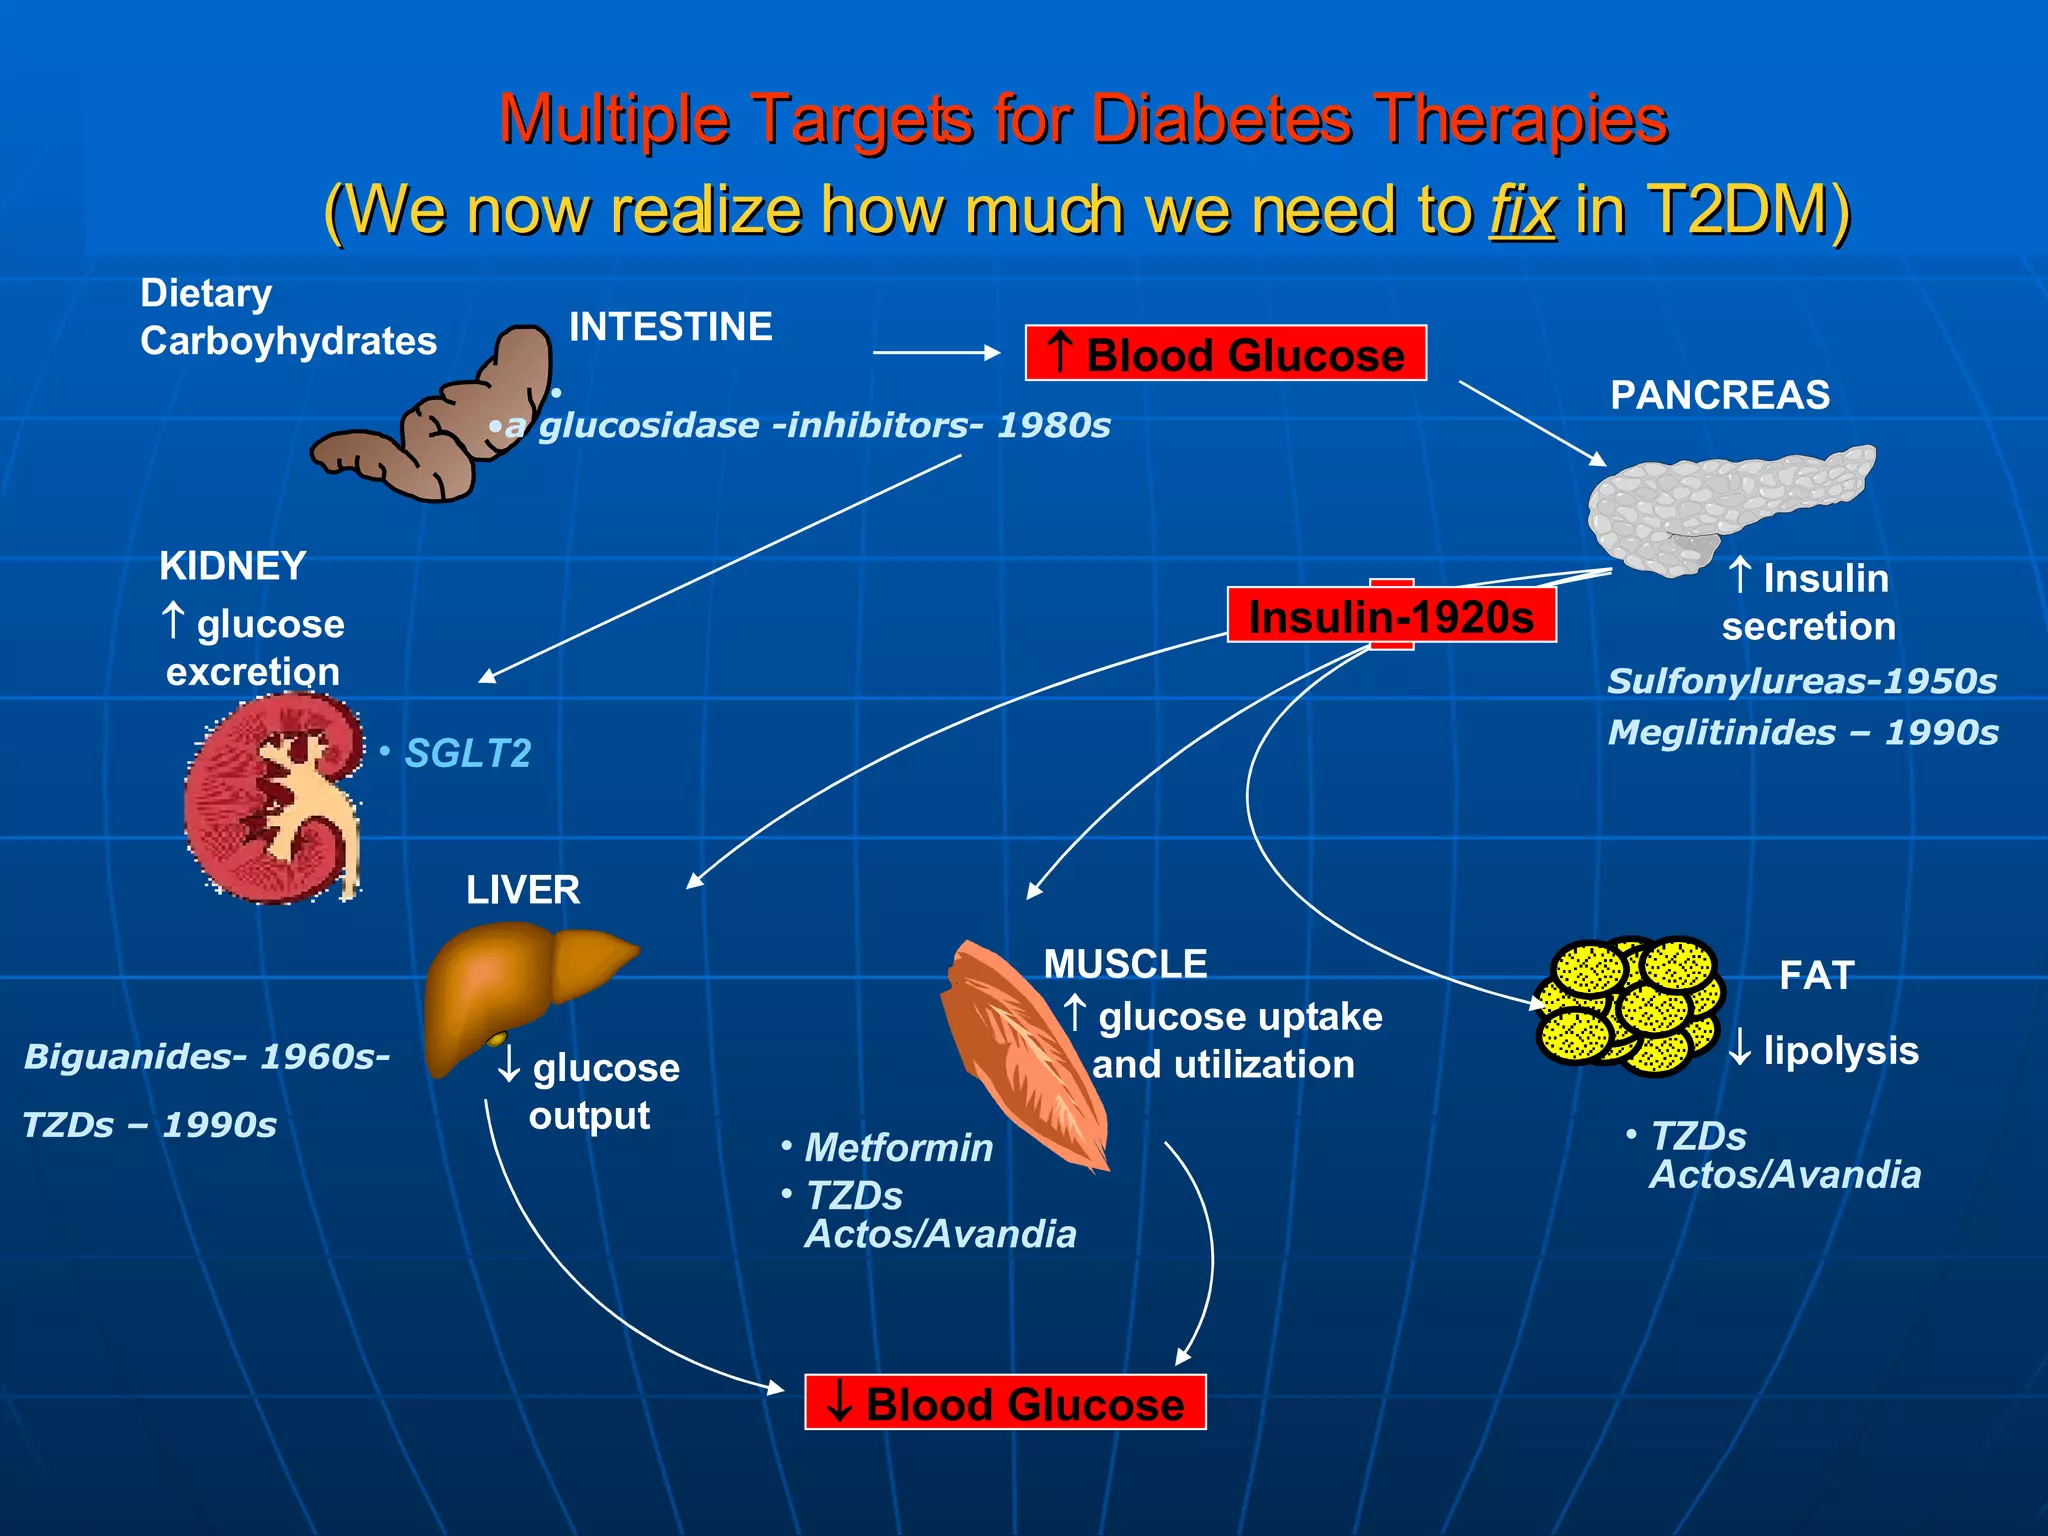
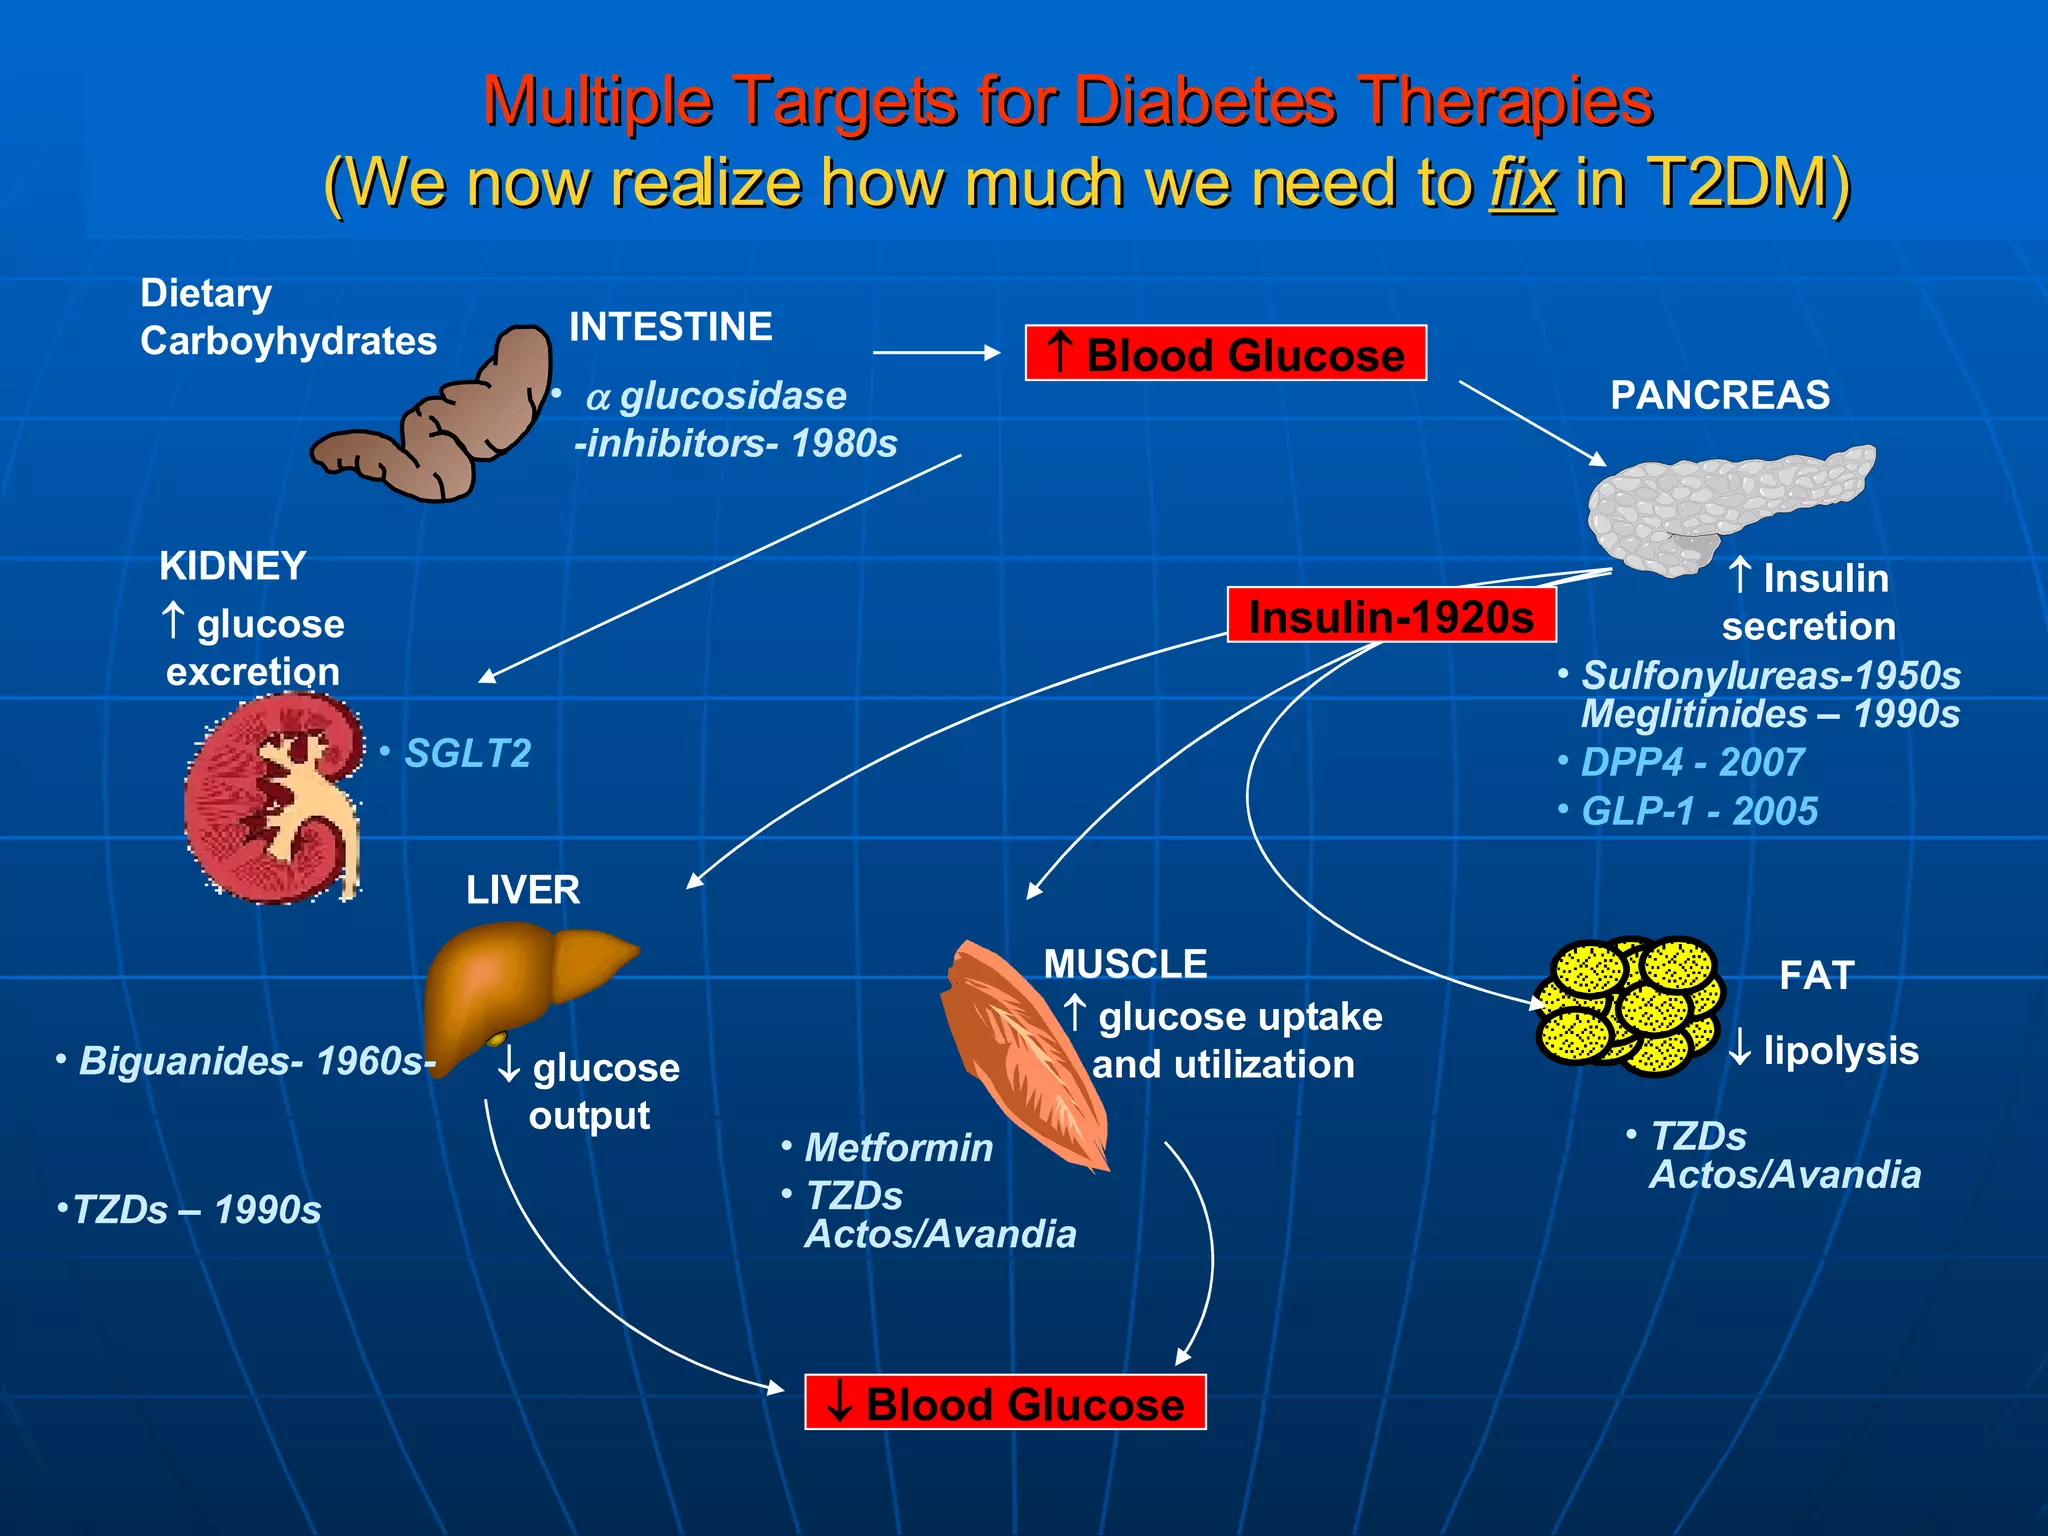
The document discusses changes and improvements in diabetes care over time. It notes that guidelines now recommend more aggressive treatment targets to better prevent diabetes complications. It outlines how the understanding of diabetes pathophysiology has expanded to incorporate multiple treatment targets beyond just insulin and highlights newer drug classes that address different disease aspects.


