Downloaded 360 times

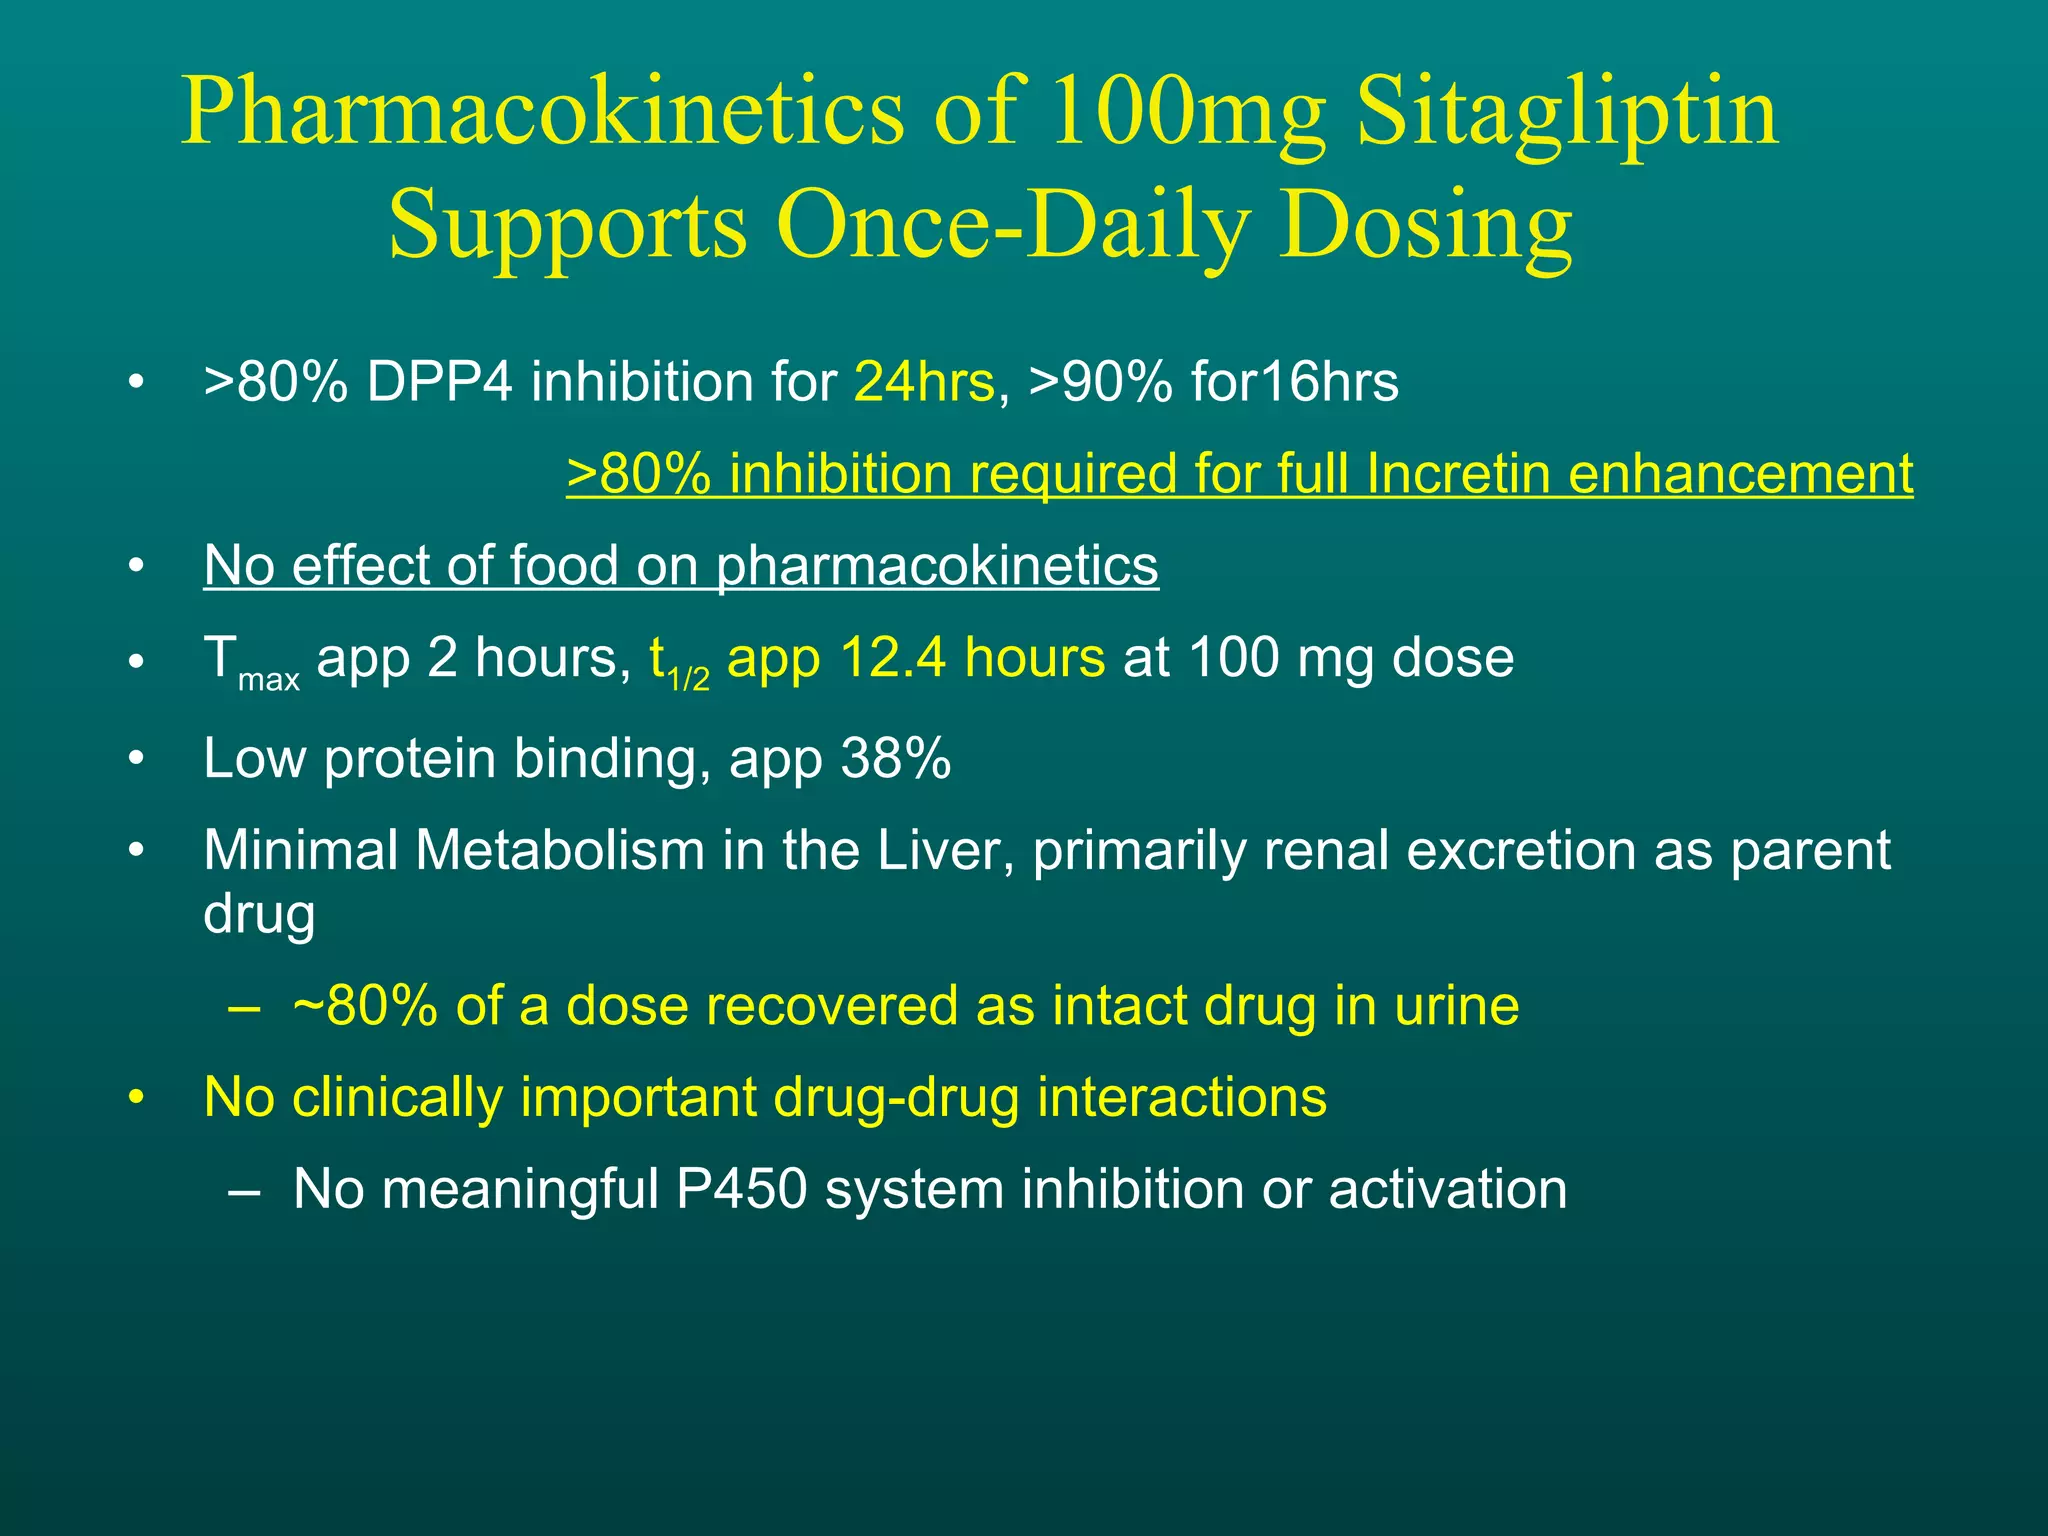


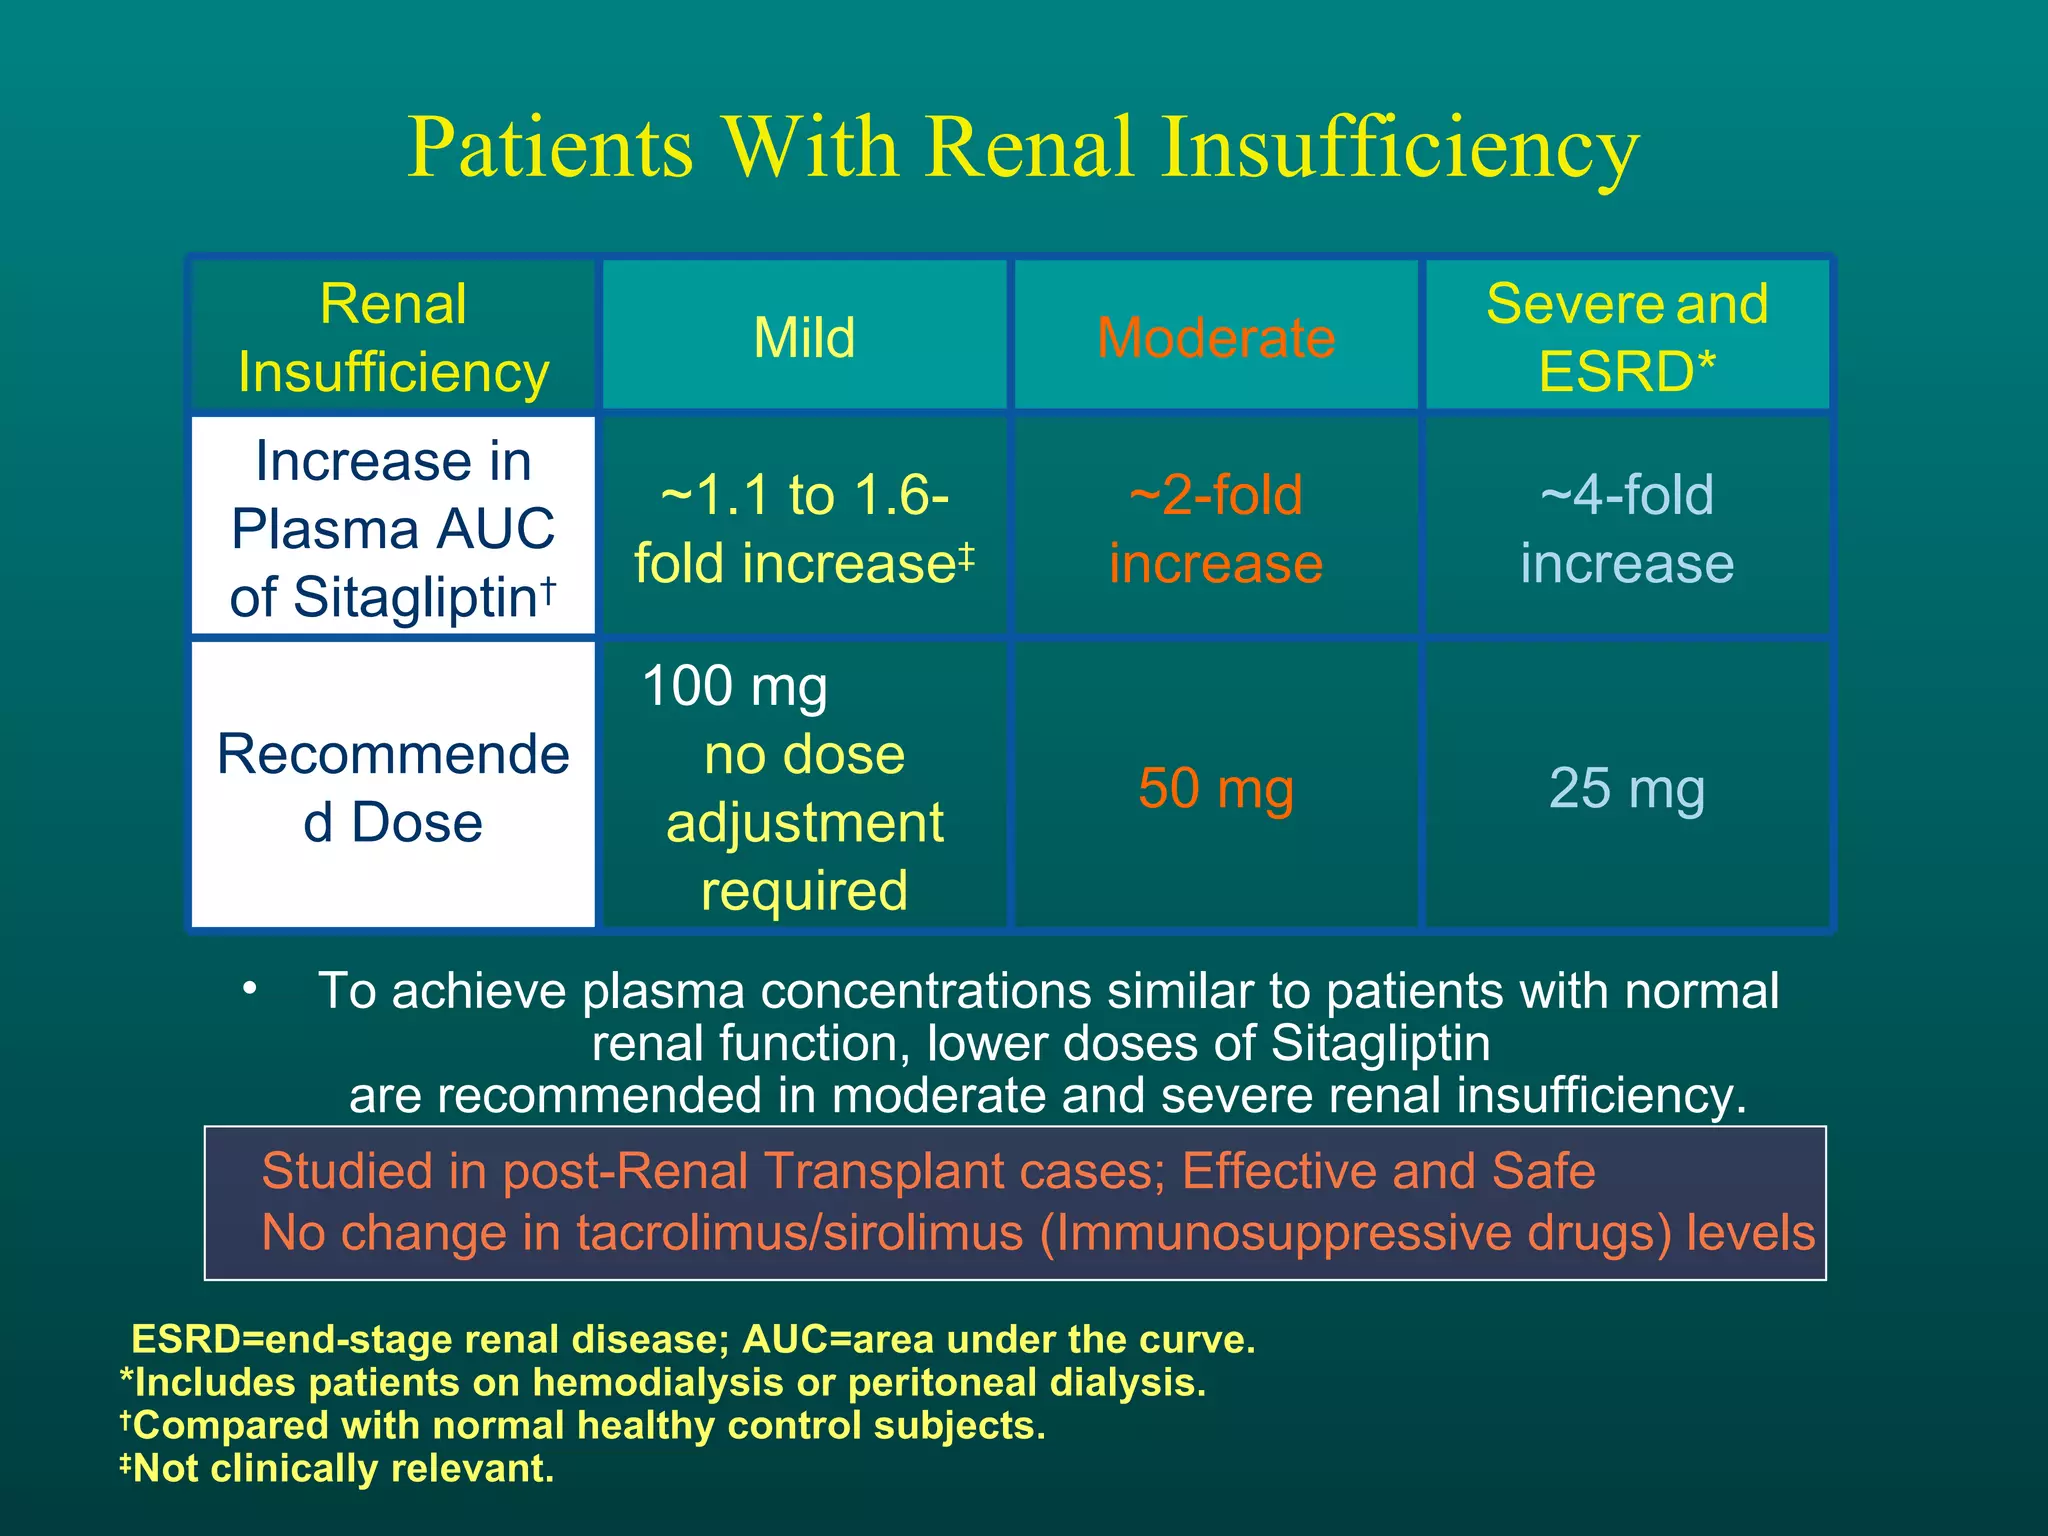

![Dosage and Administration Usual Dosing for JANUVIA™ (sitagliptin phosphate)* Patients With Renal Insufficiency* ,† *JANUVIA can be taken with or without food. † Patients with mild renal insufficiency—100 mg once daily. ‡ ESRD = end-stage renal disease requiring hemodialysis or peritoneal dialysis. CrCl <30 mL/min (~Serum Cr levels [mg/dL] Men: >3.0; Women: >2.5) CrCl 30 to <50 mL/min (~Serum Cr levels [mg/dL] Men: >1.7–≤3.0; Women: >1.5–≤2.5) Severe and ESRD ‡ Moderate 25 mg once daily 50 mg once daily The recommended dose of JANUVIA is 100 mg once daily as monotherapy or as combination therapy with metformin or a PPAR agonist.](https://image.slidesharecdn.com/apicon-12669976459979-phpapp02/75/Dr-KA-Apicon-Master-Slide-Presentation-58-2048.jpg)


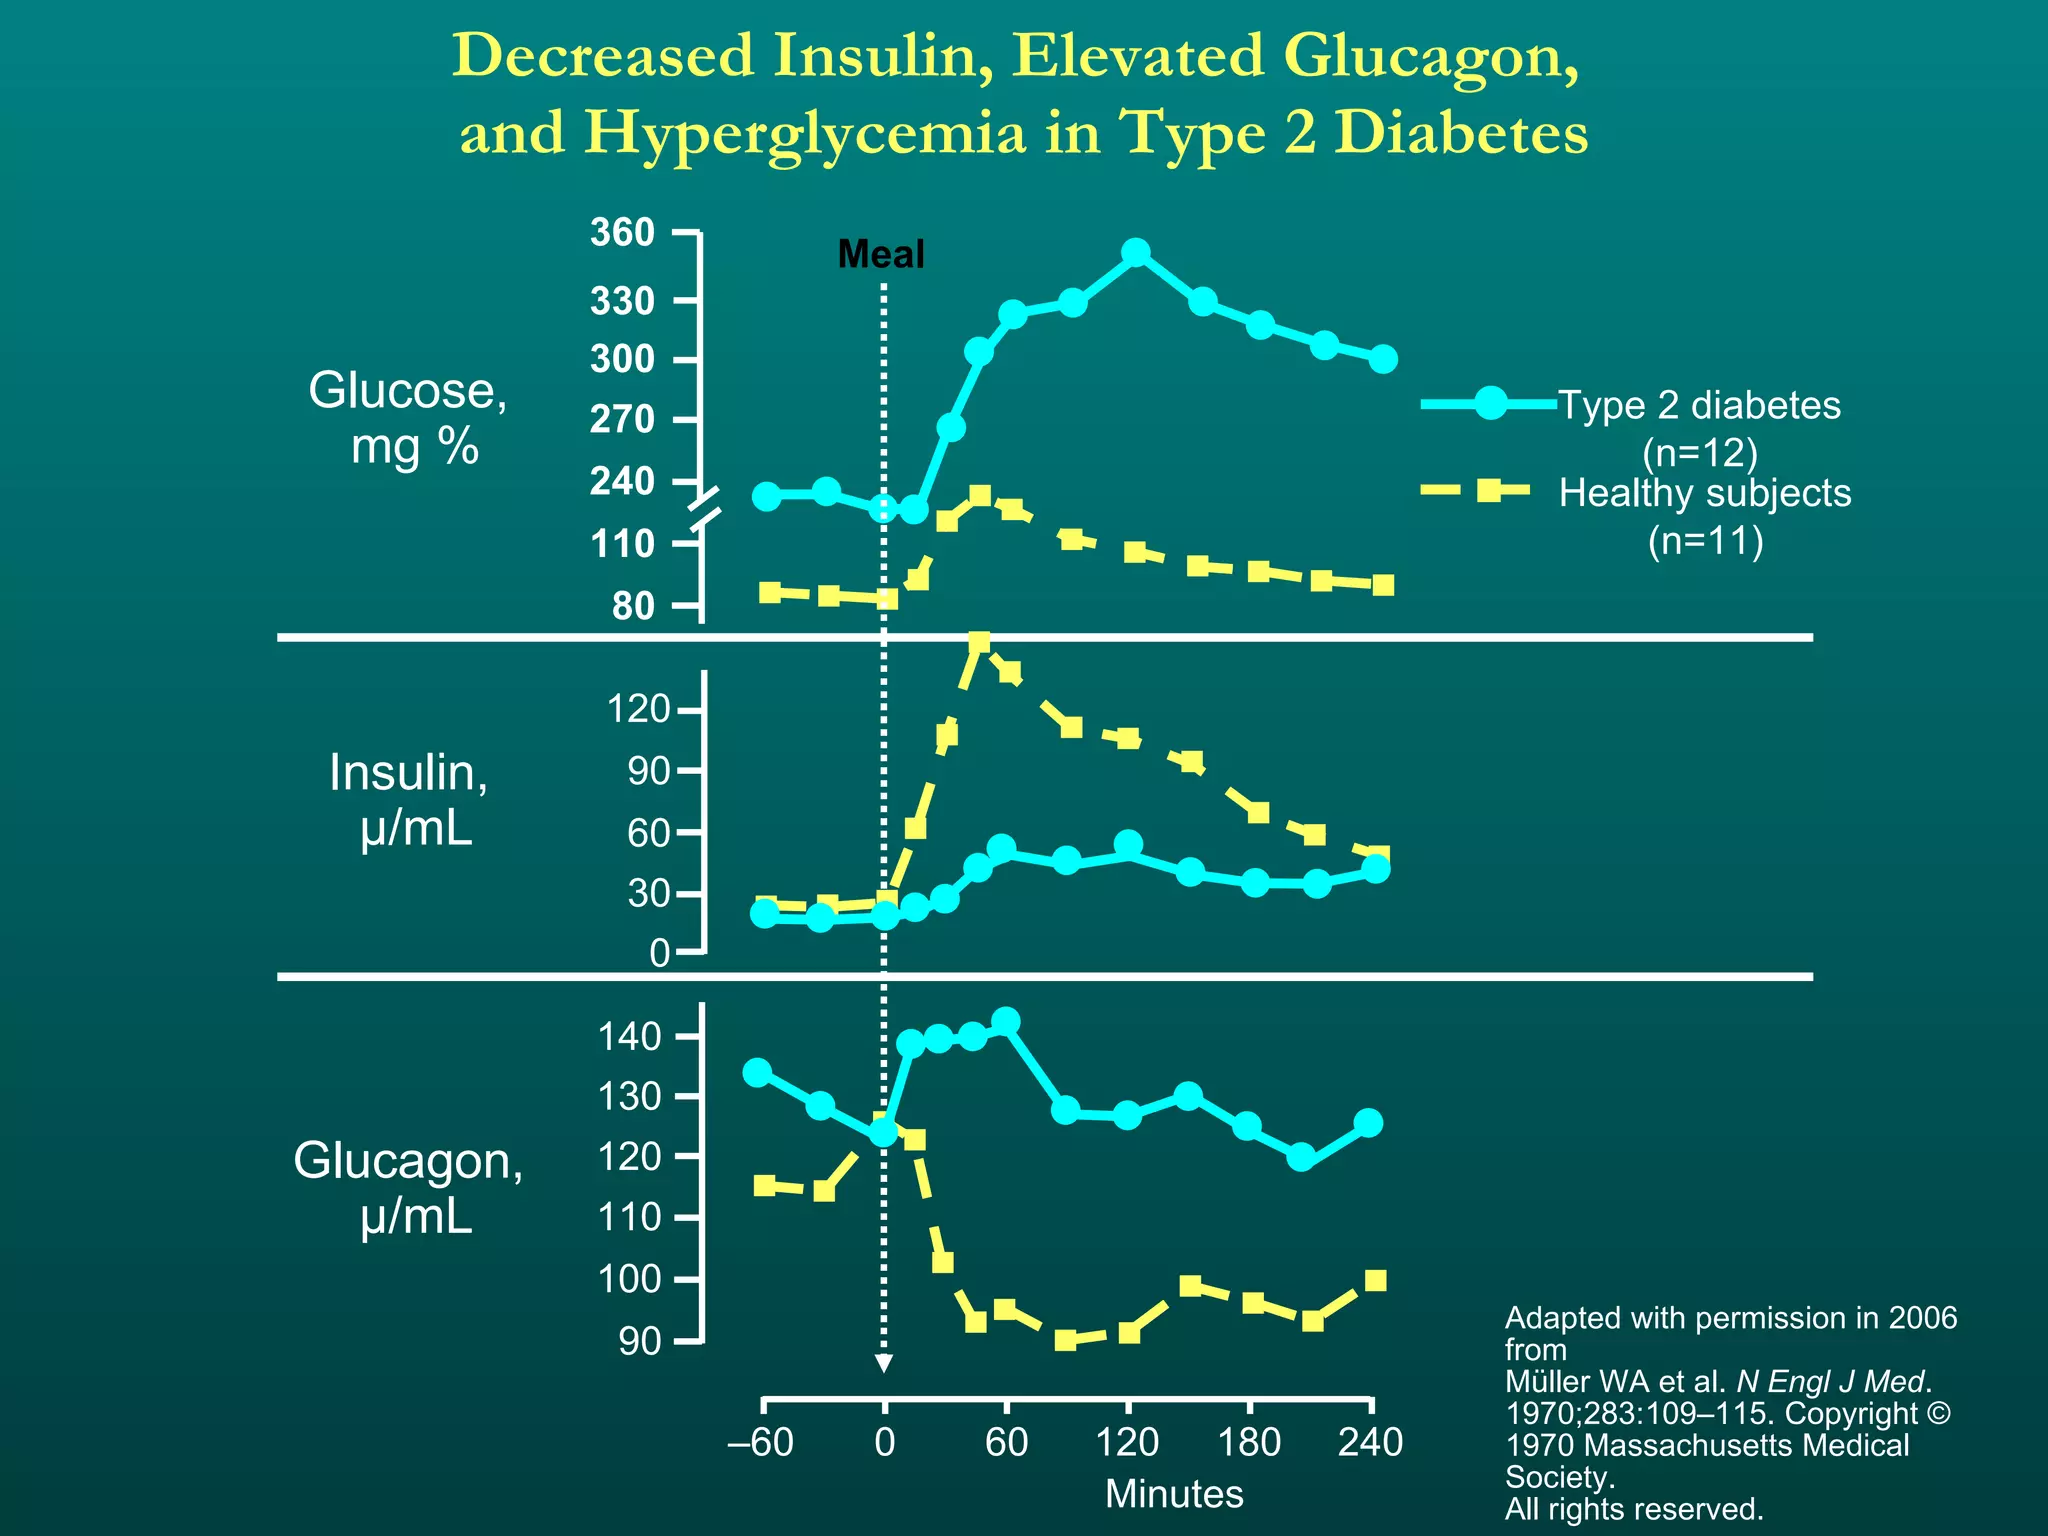
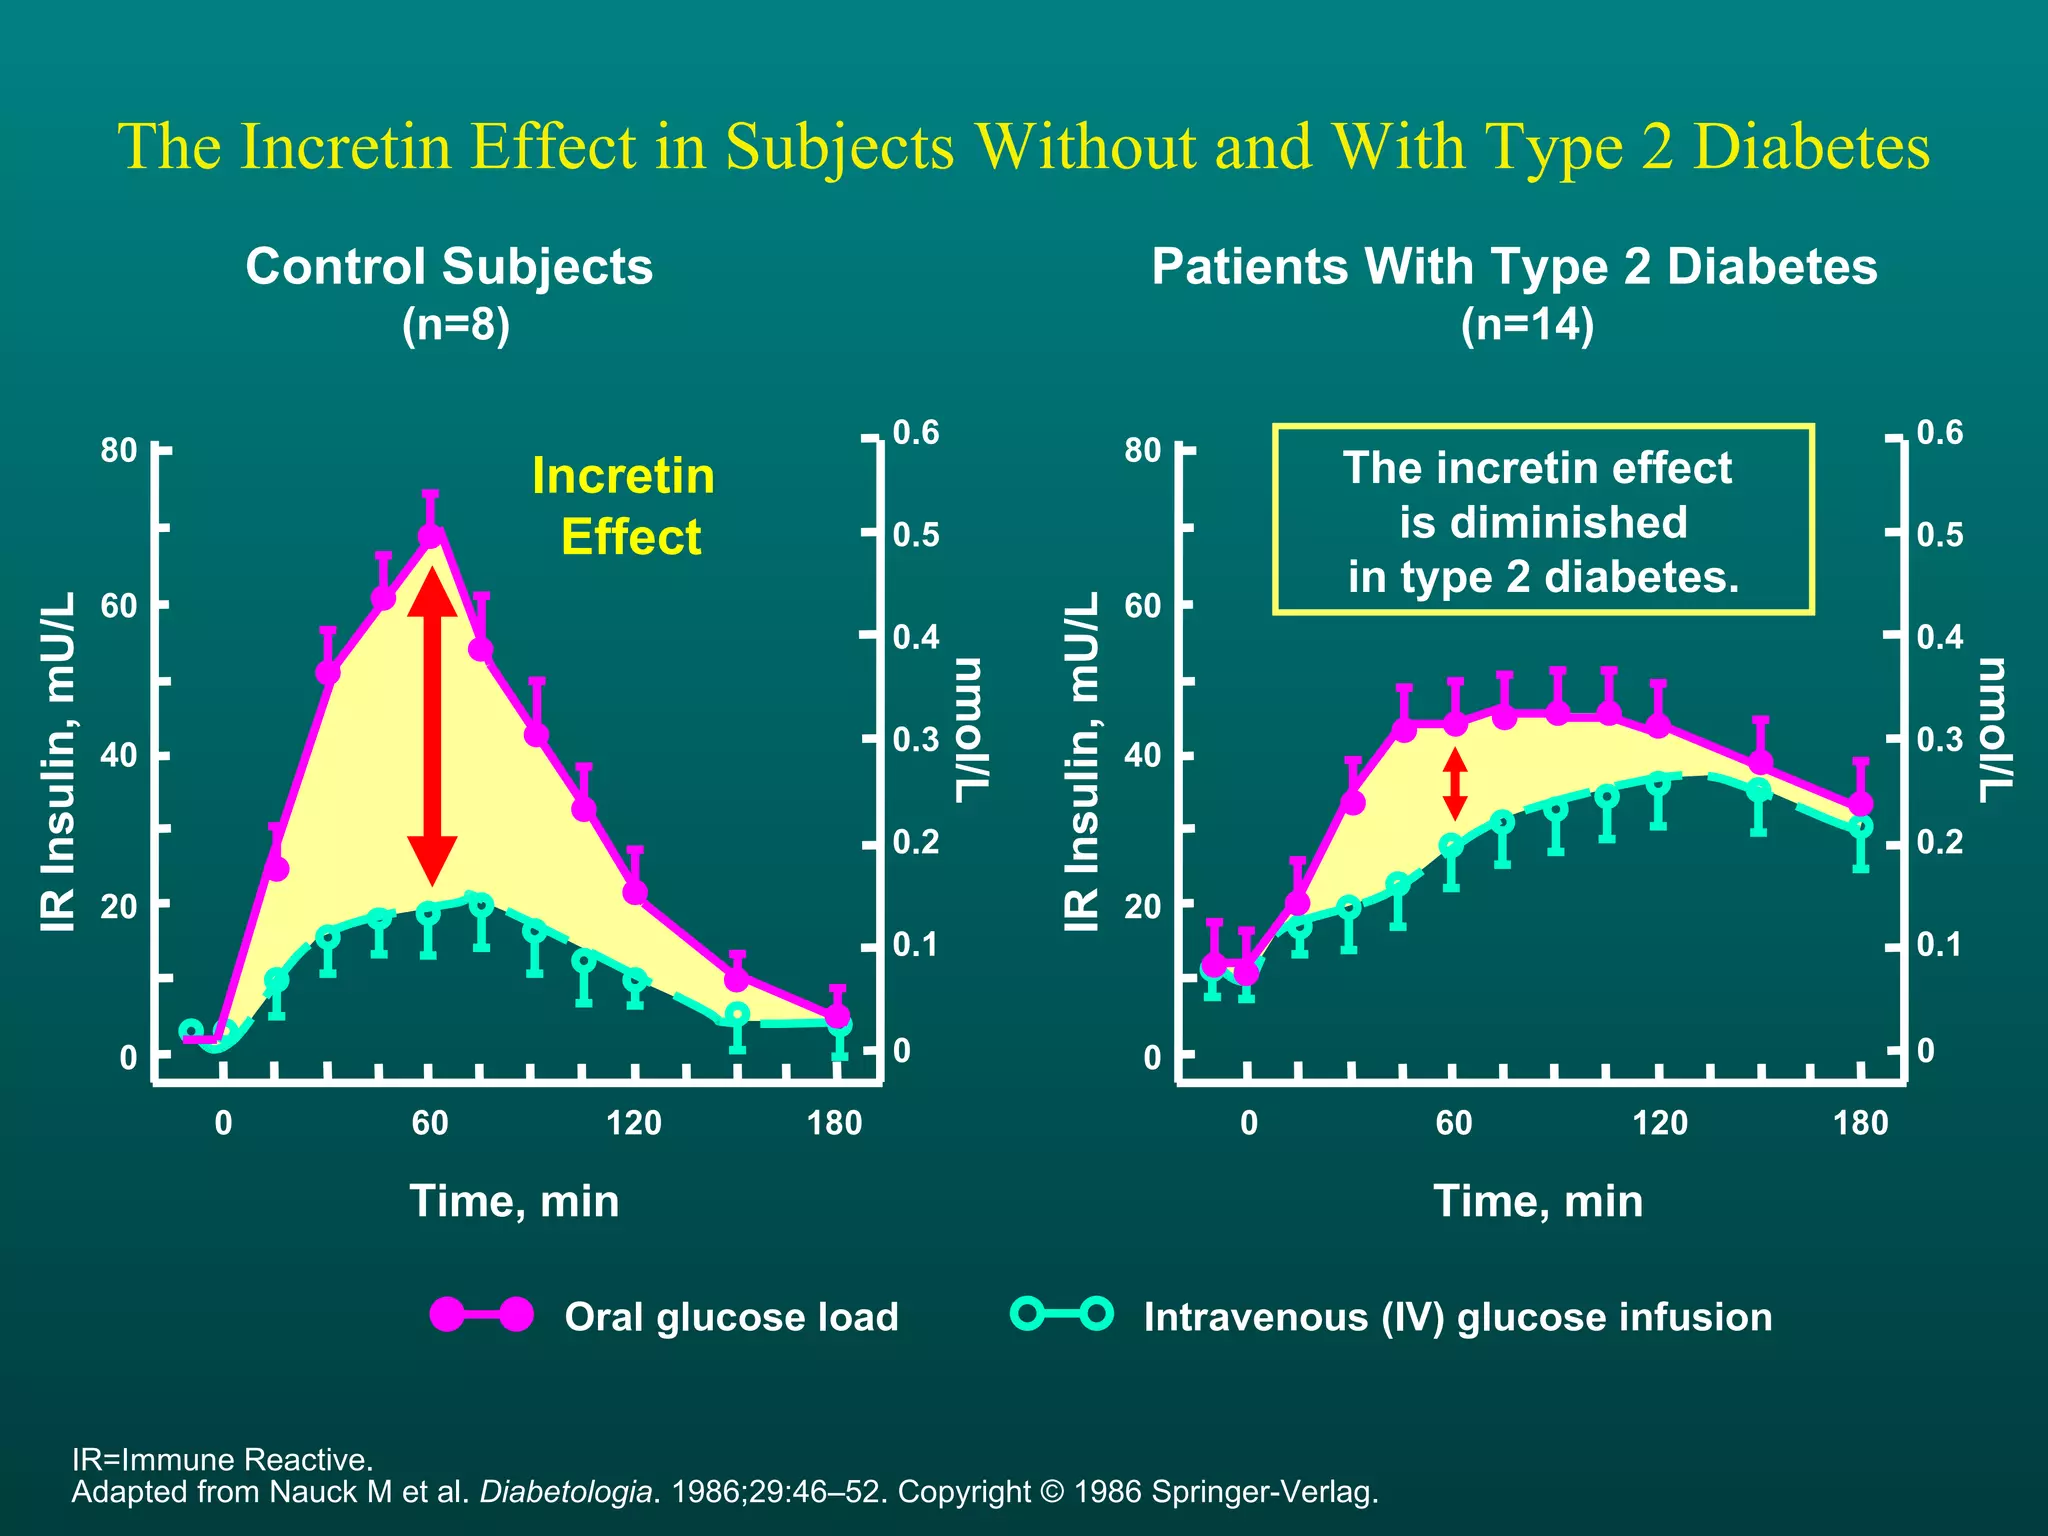
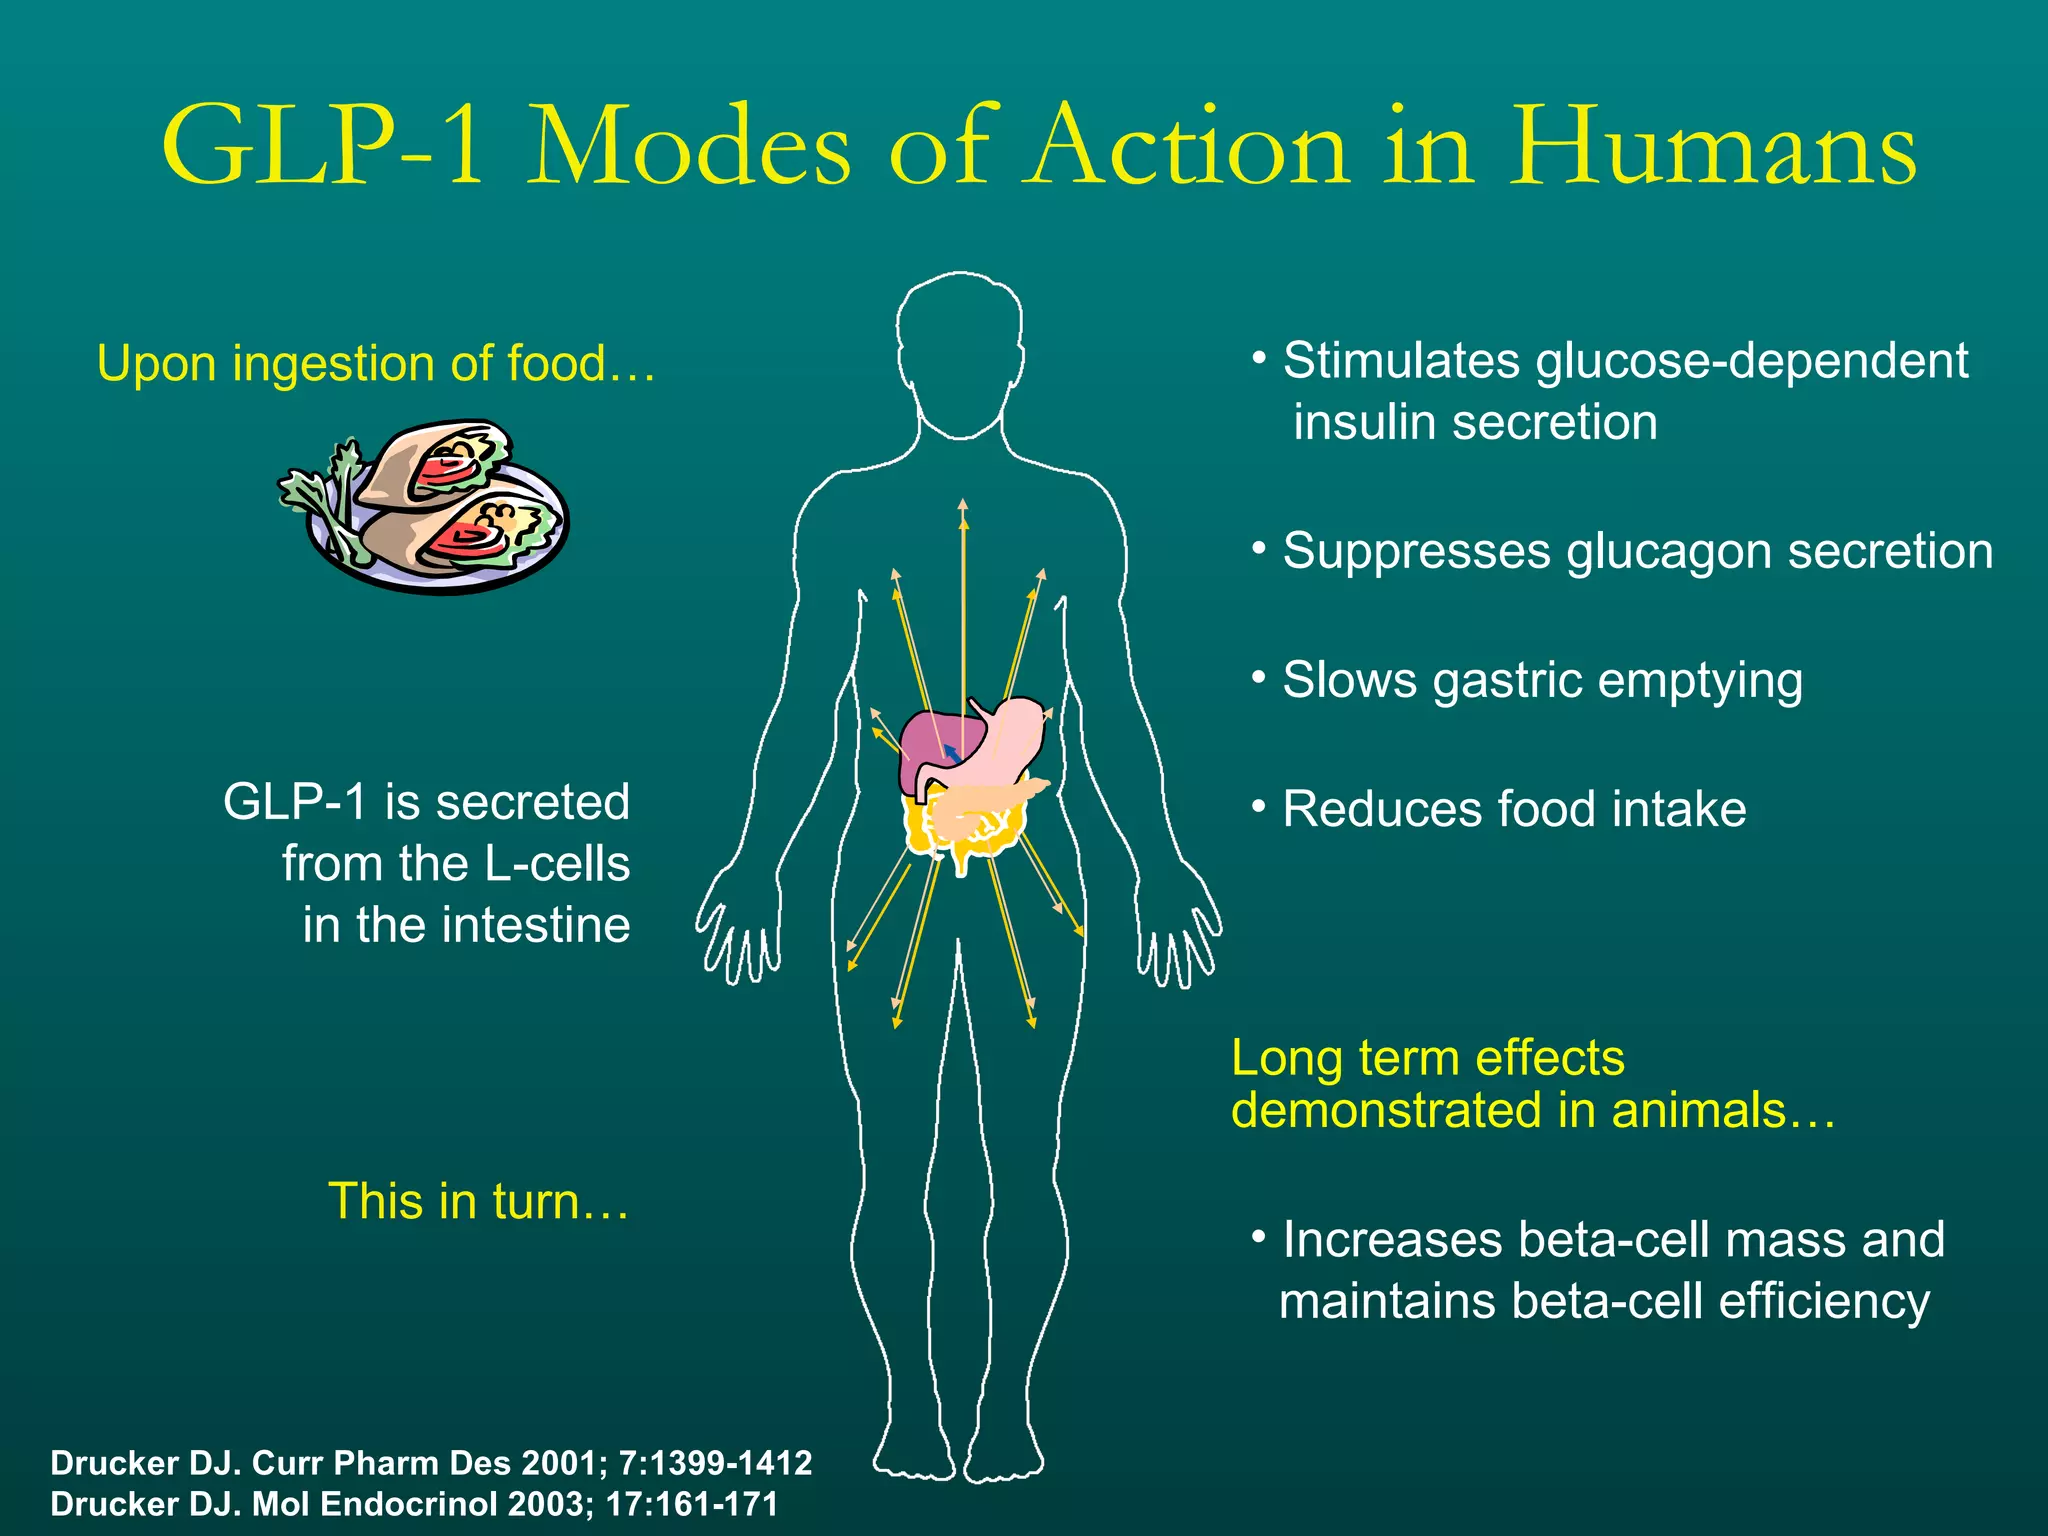
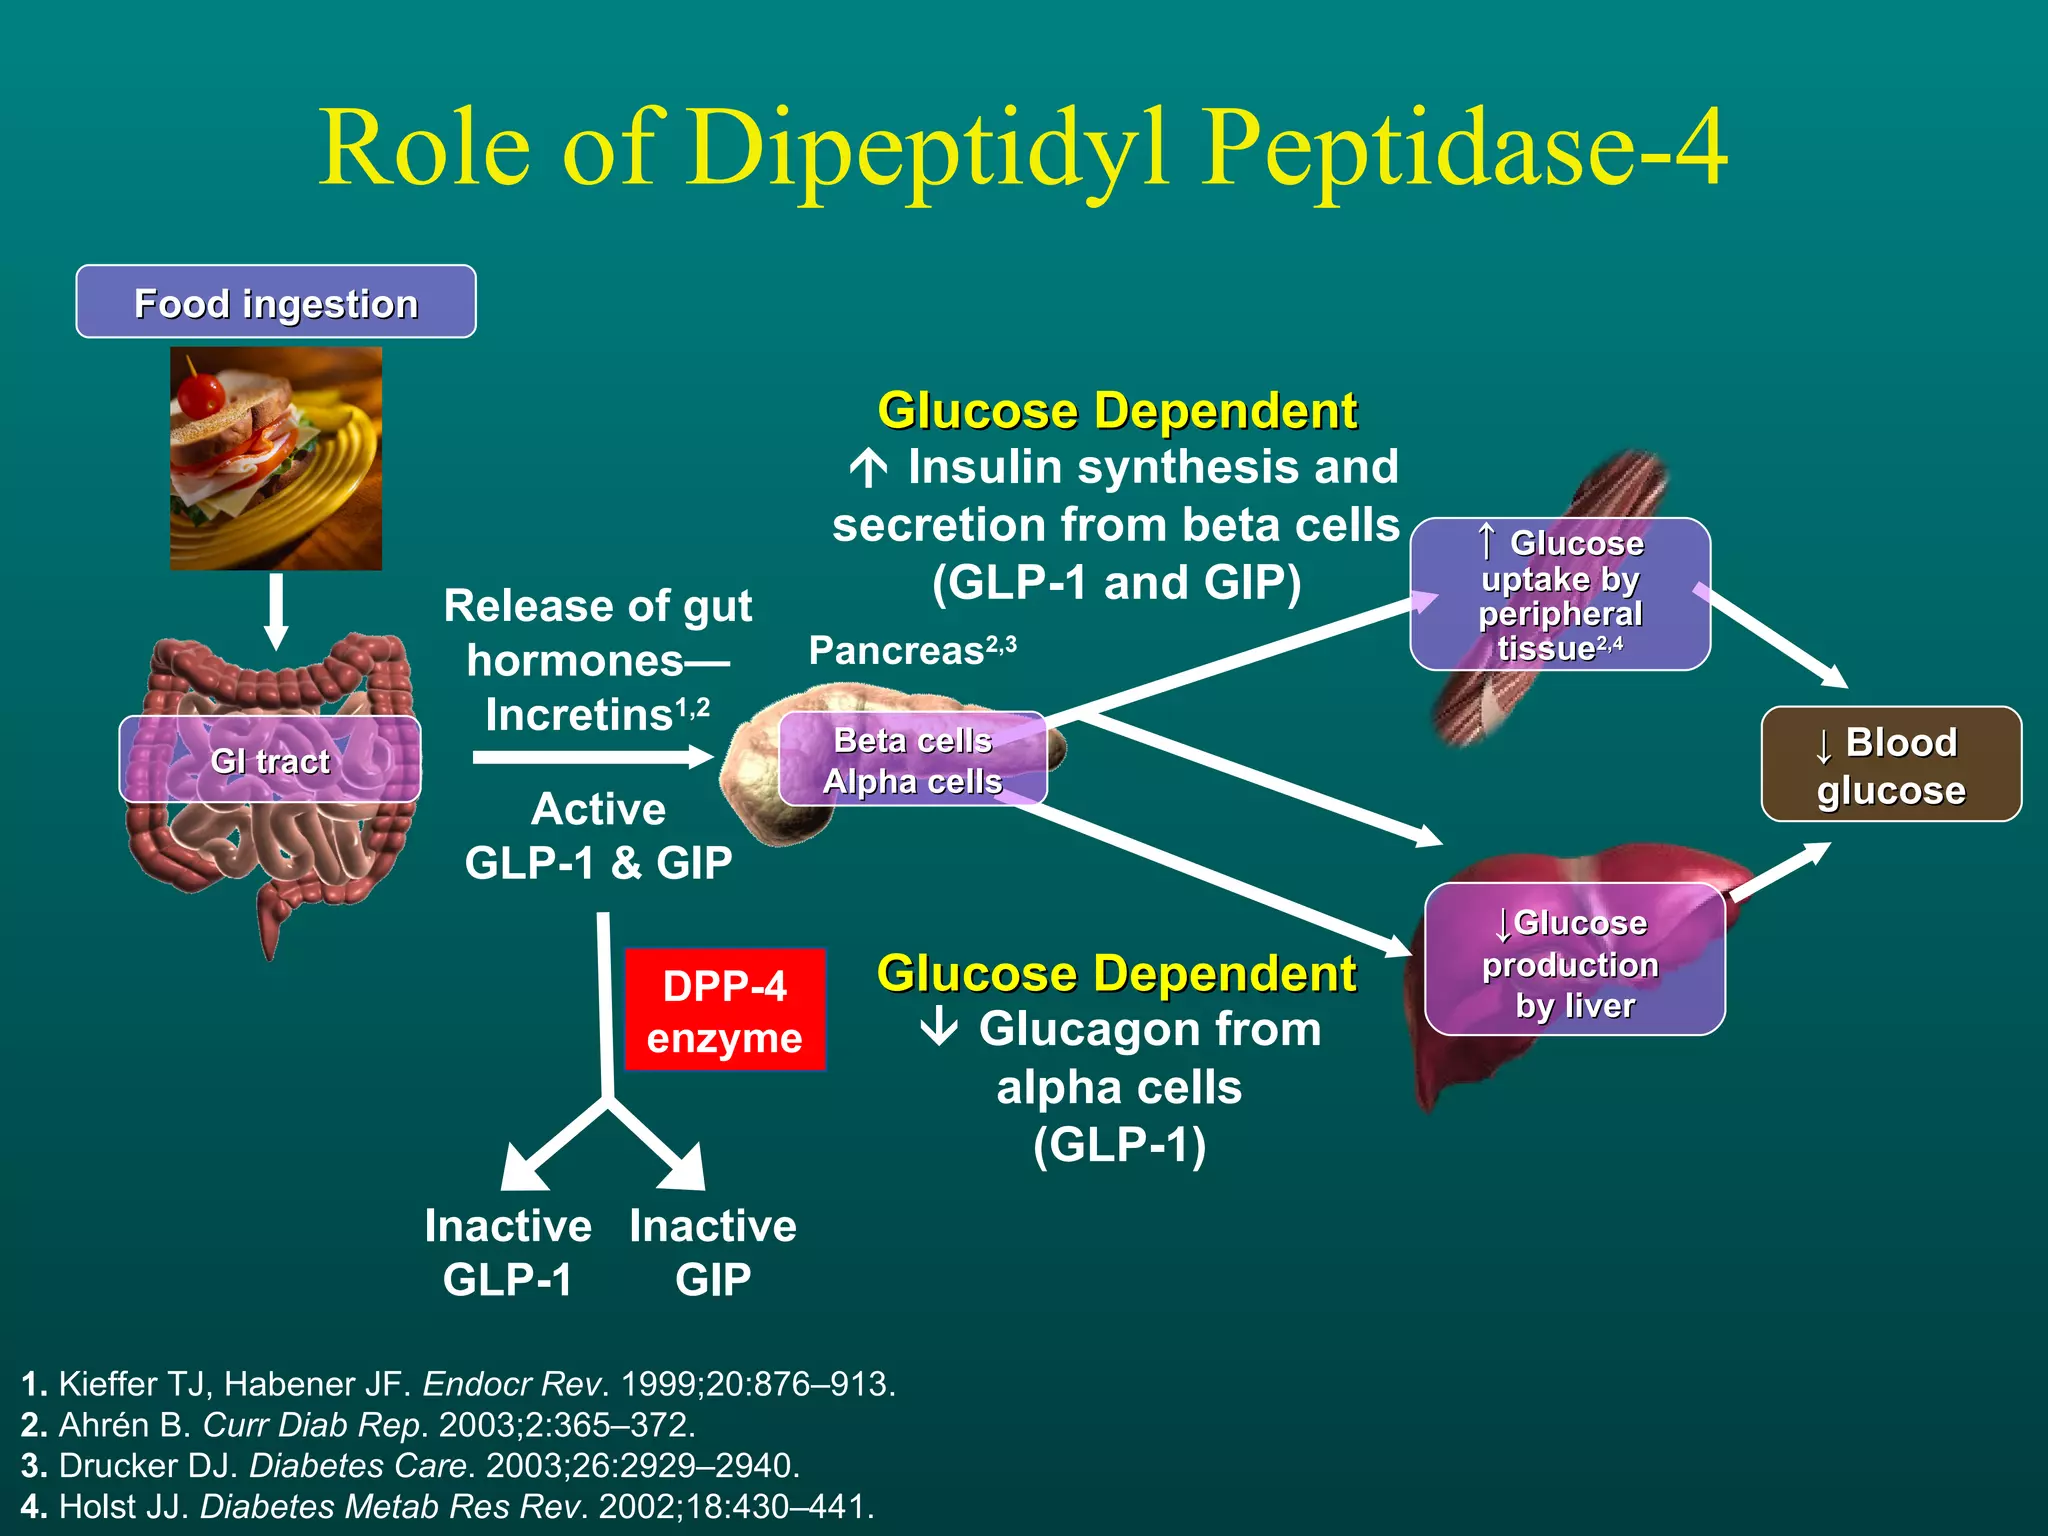
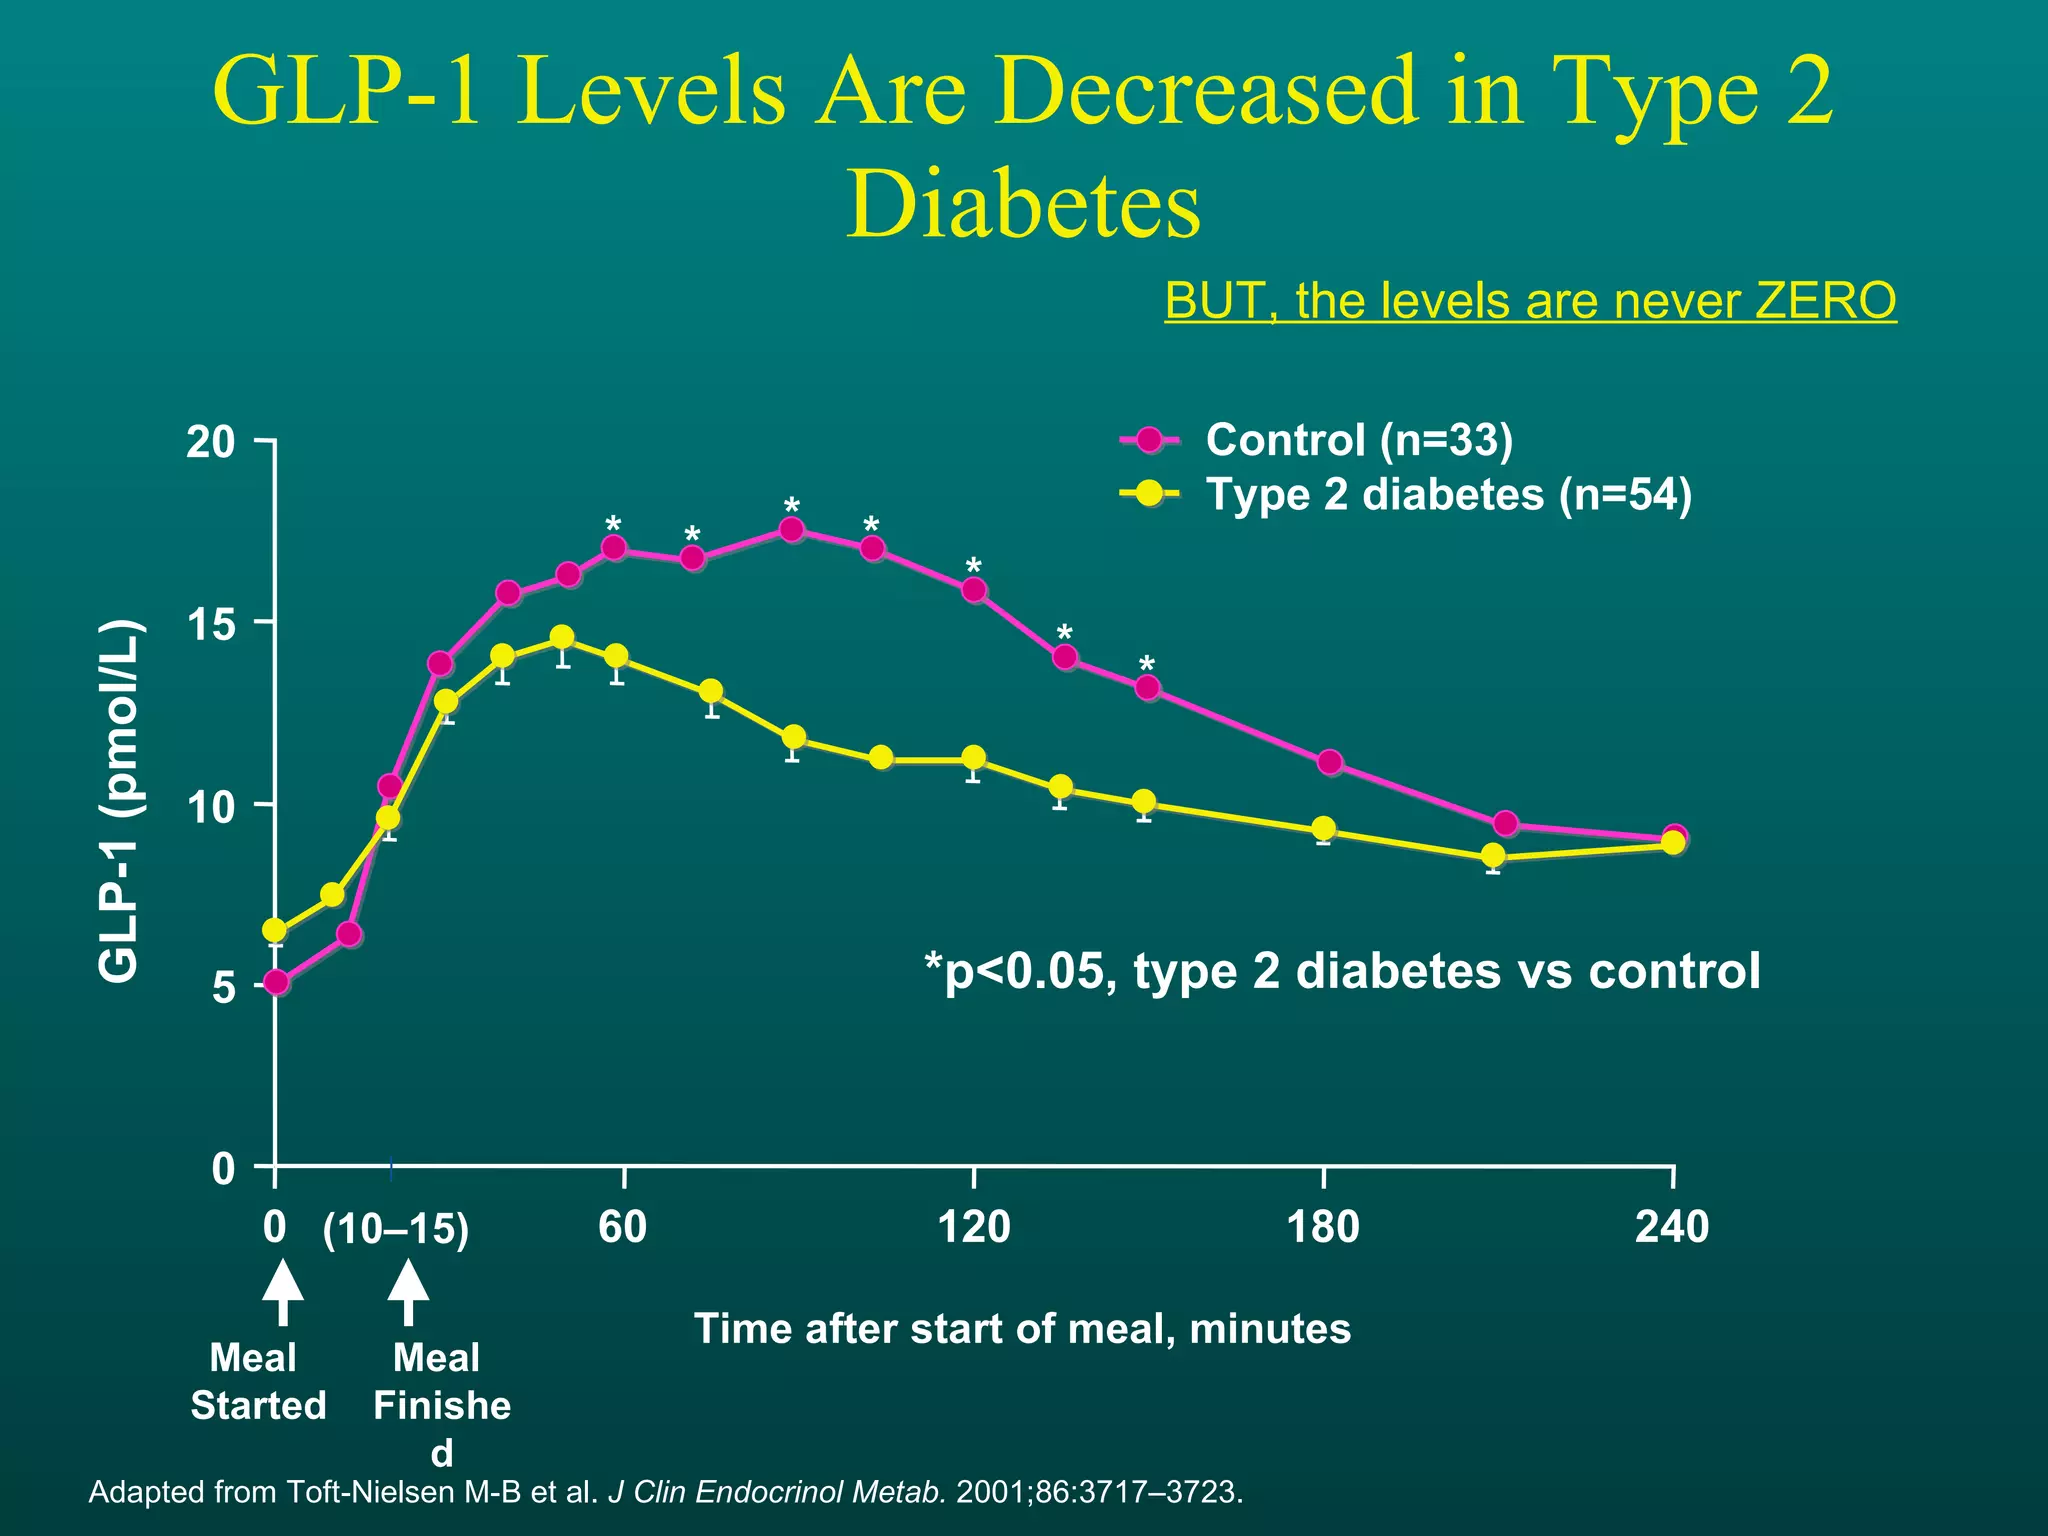
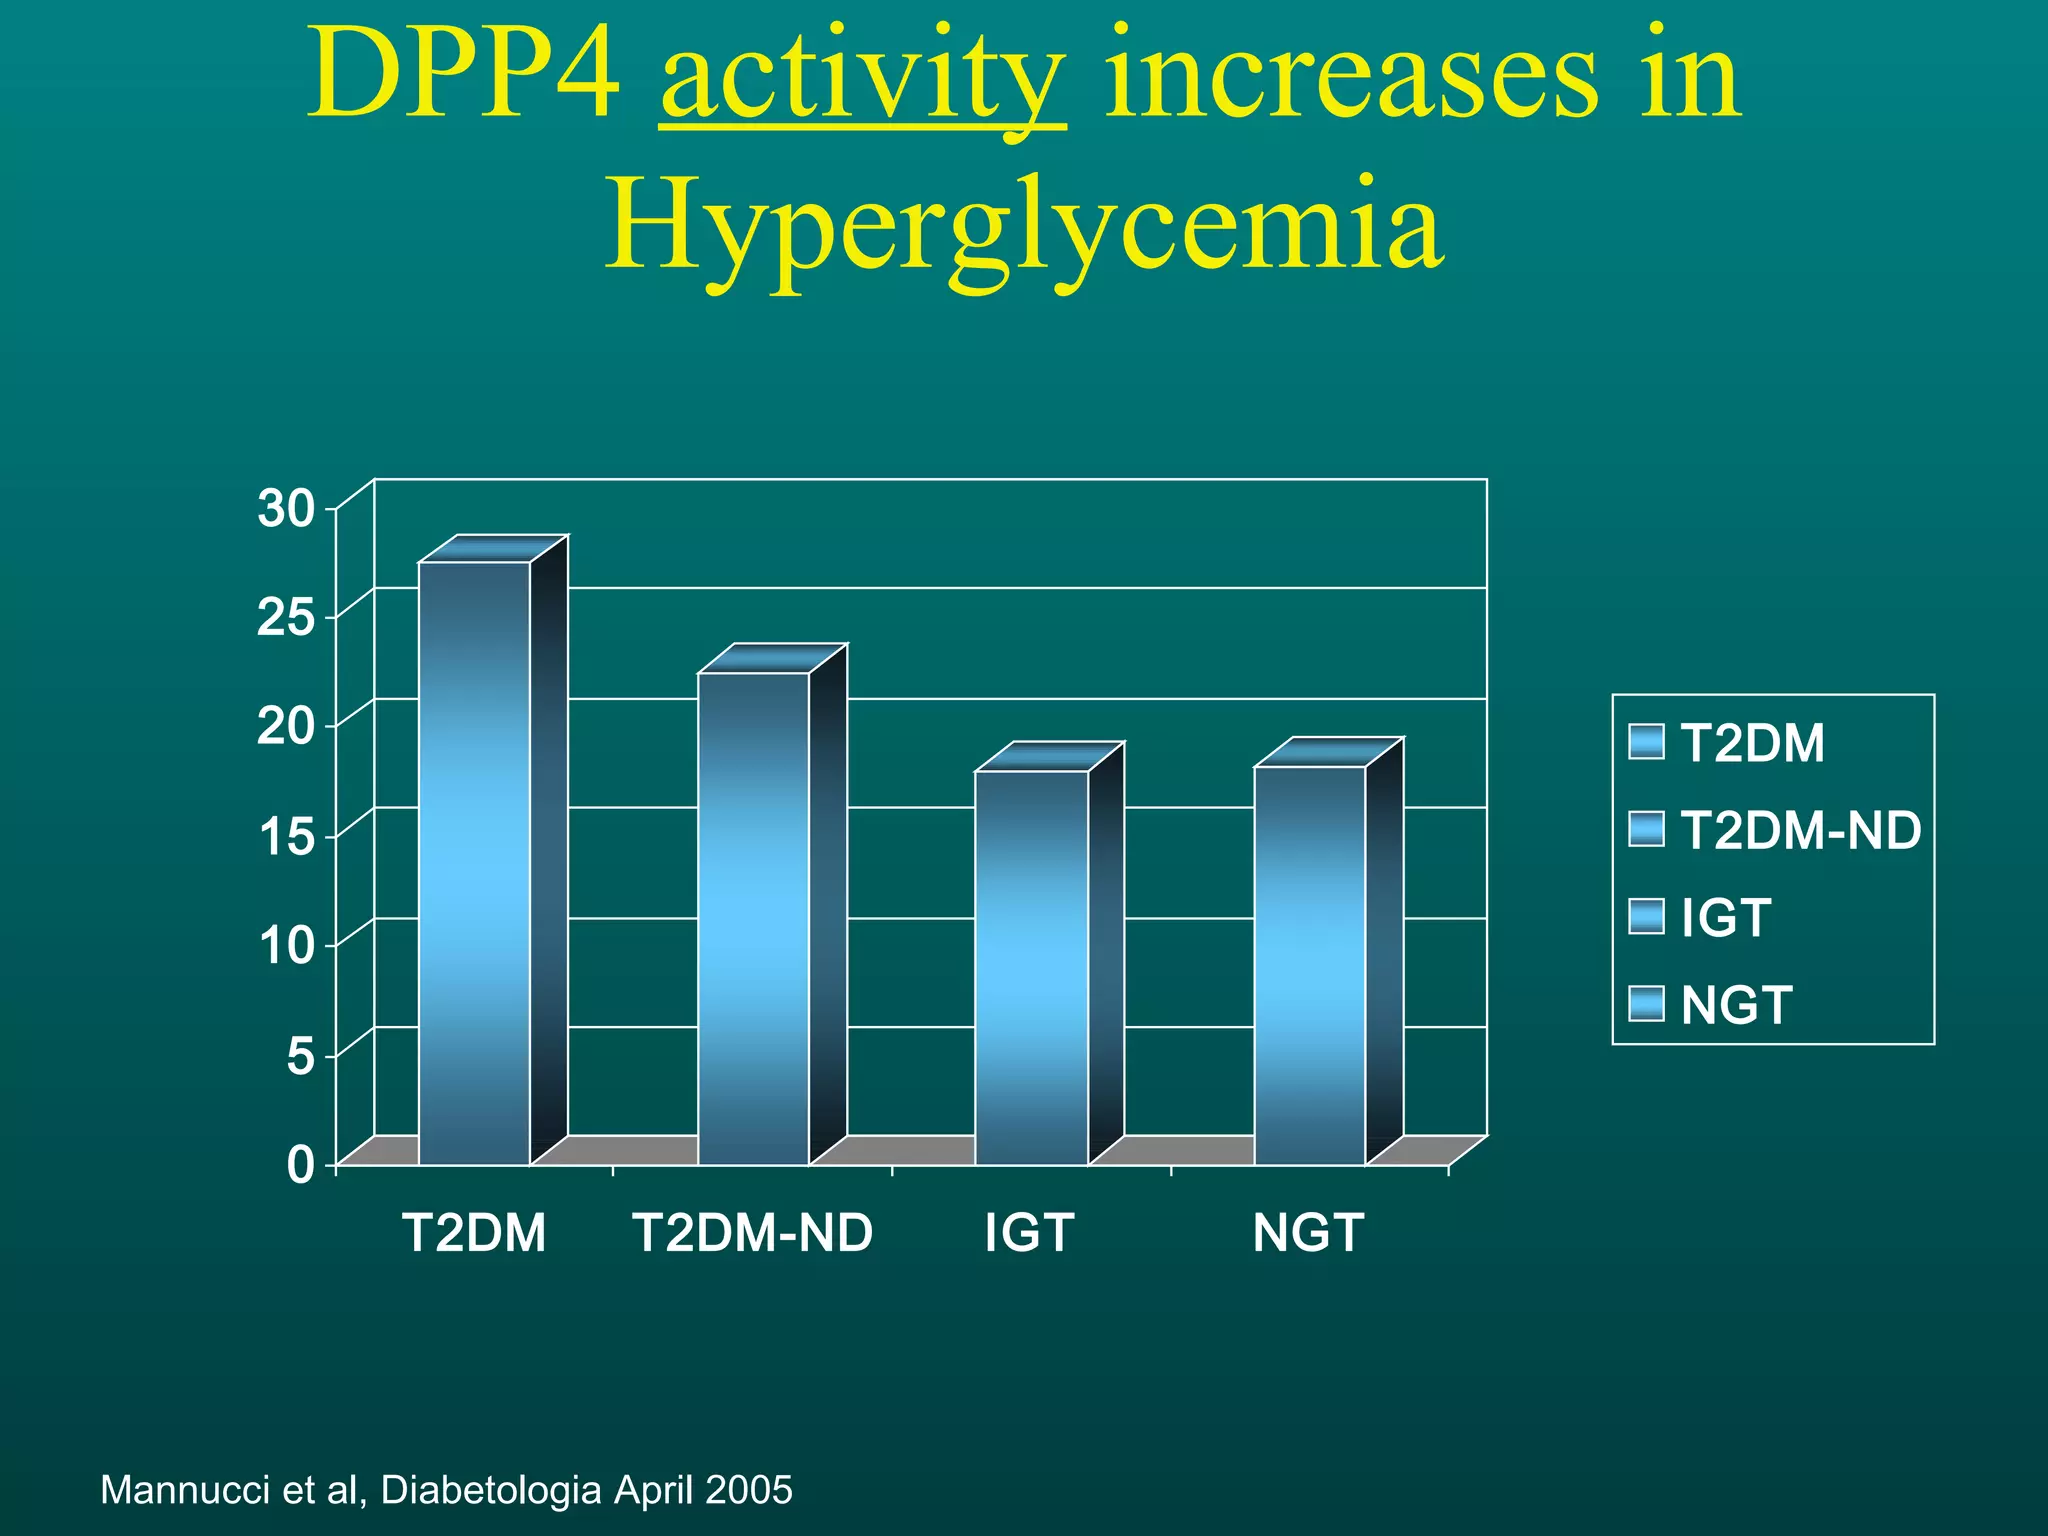
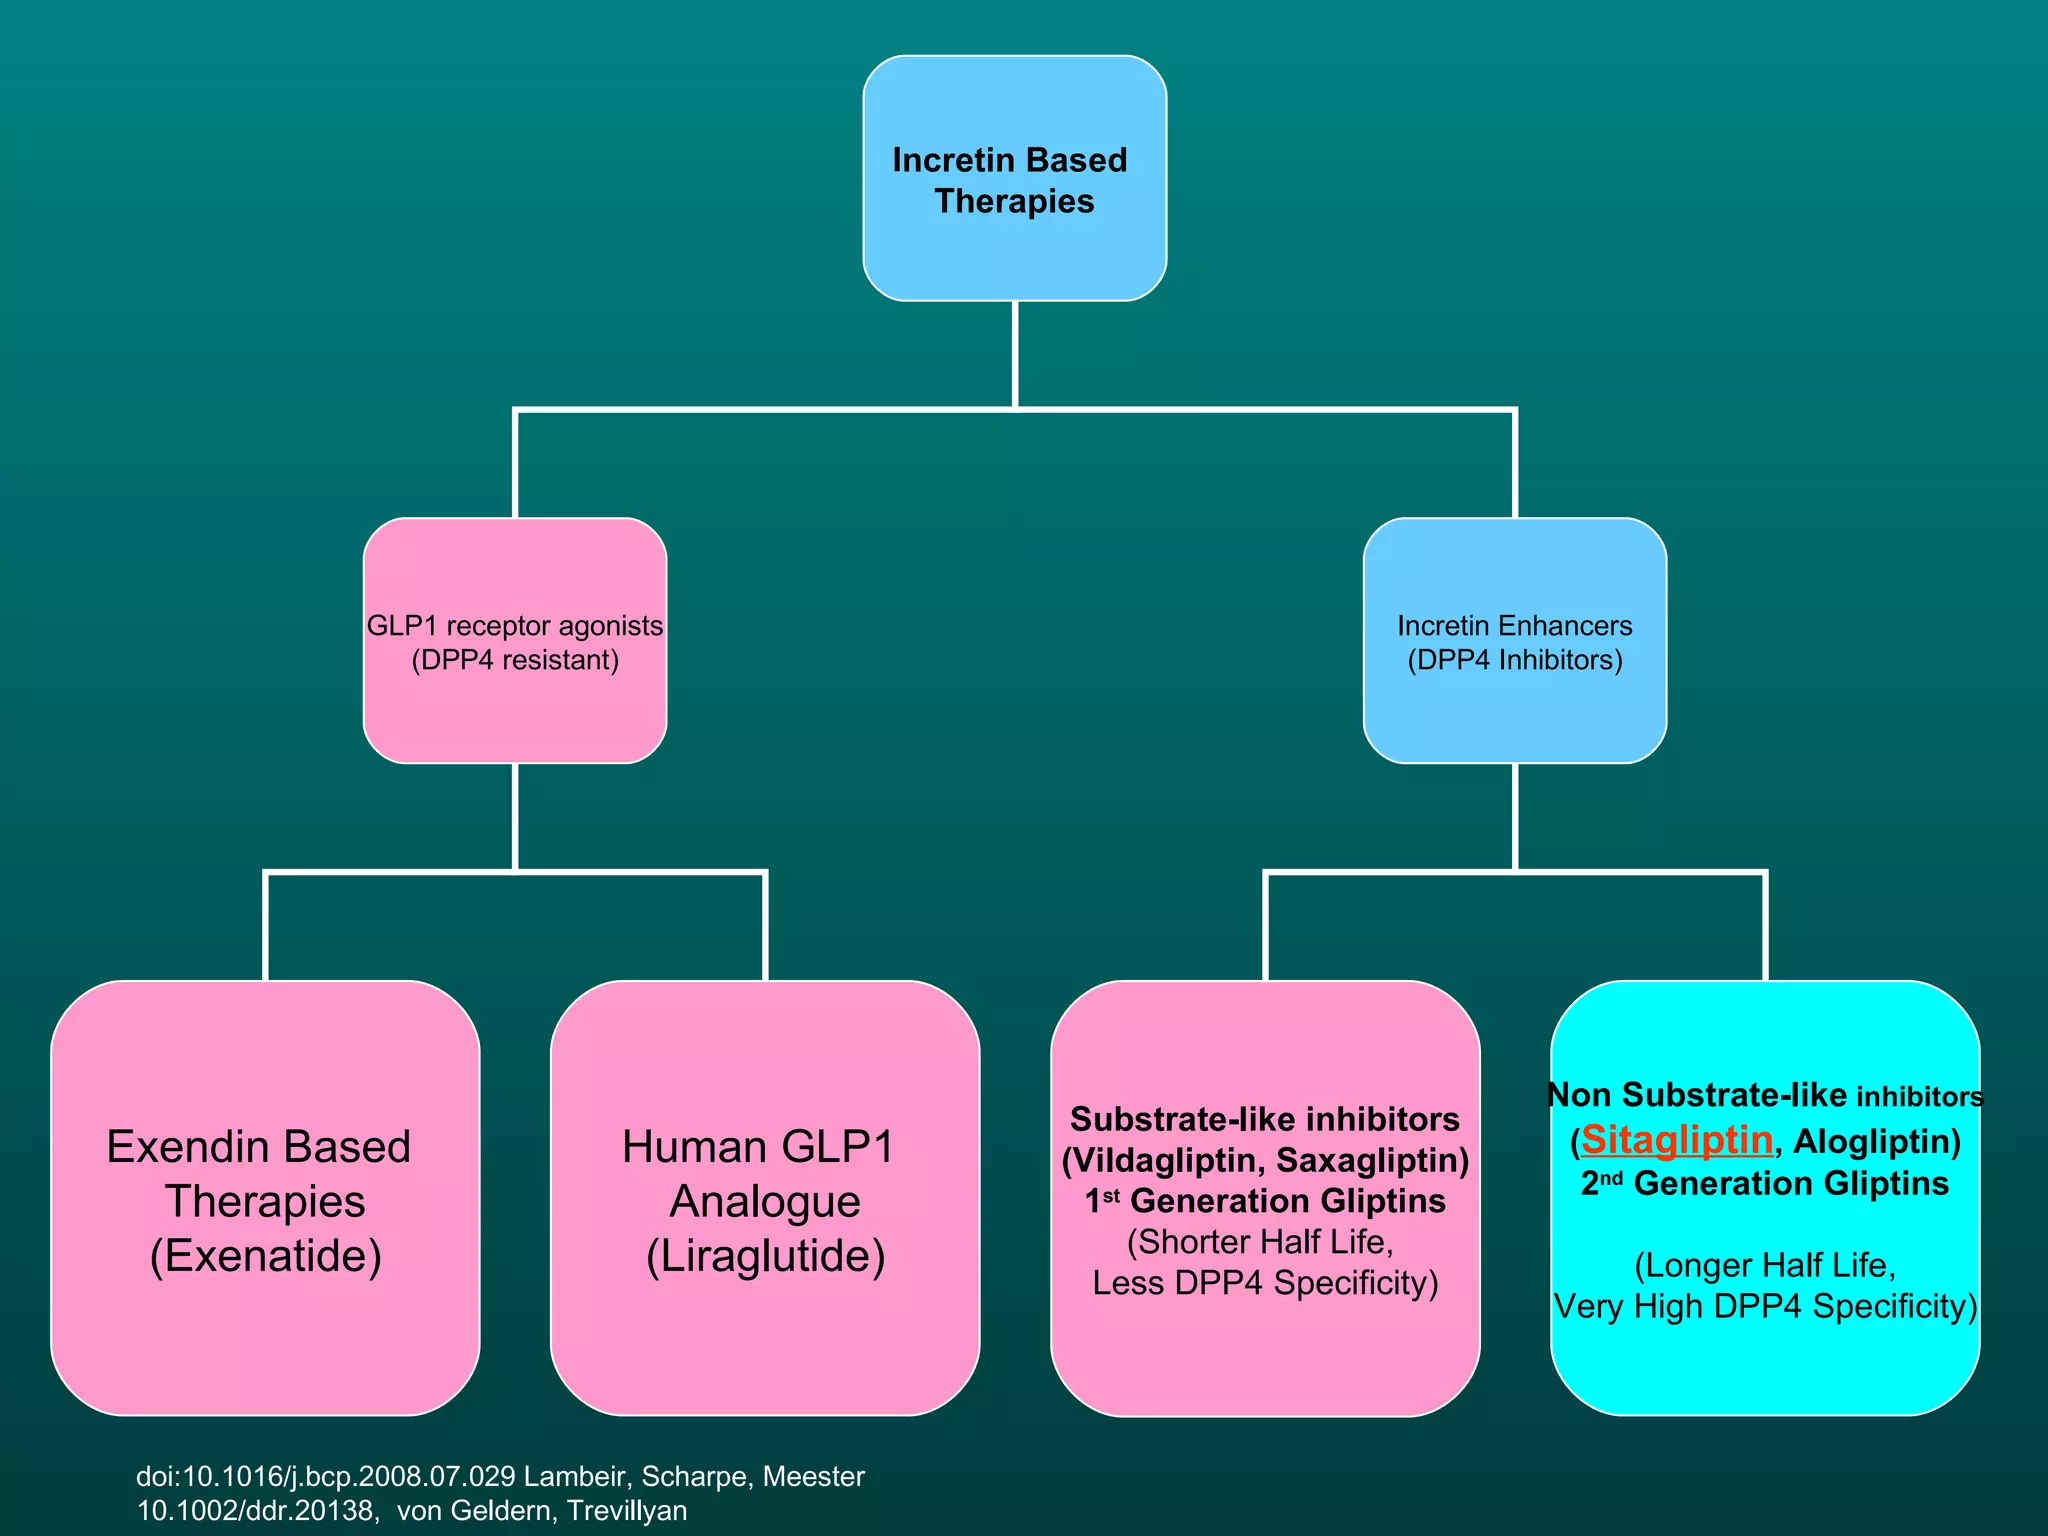
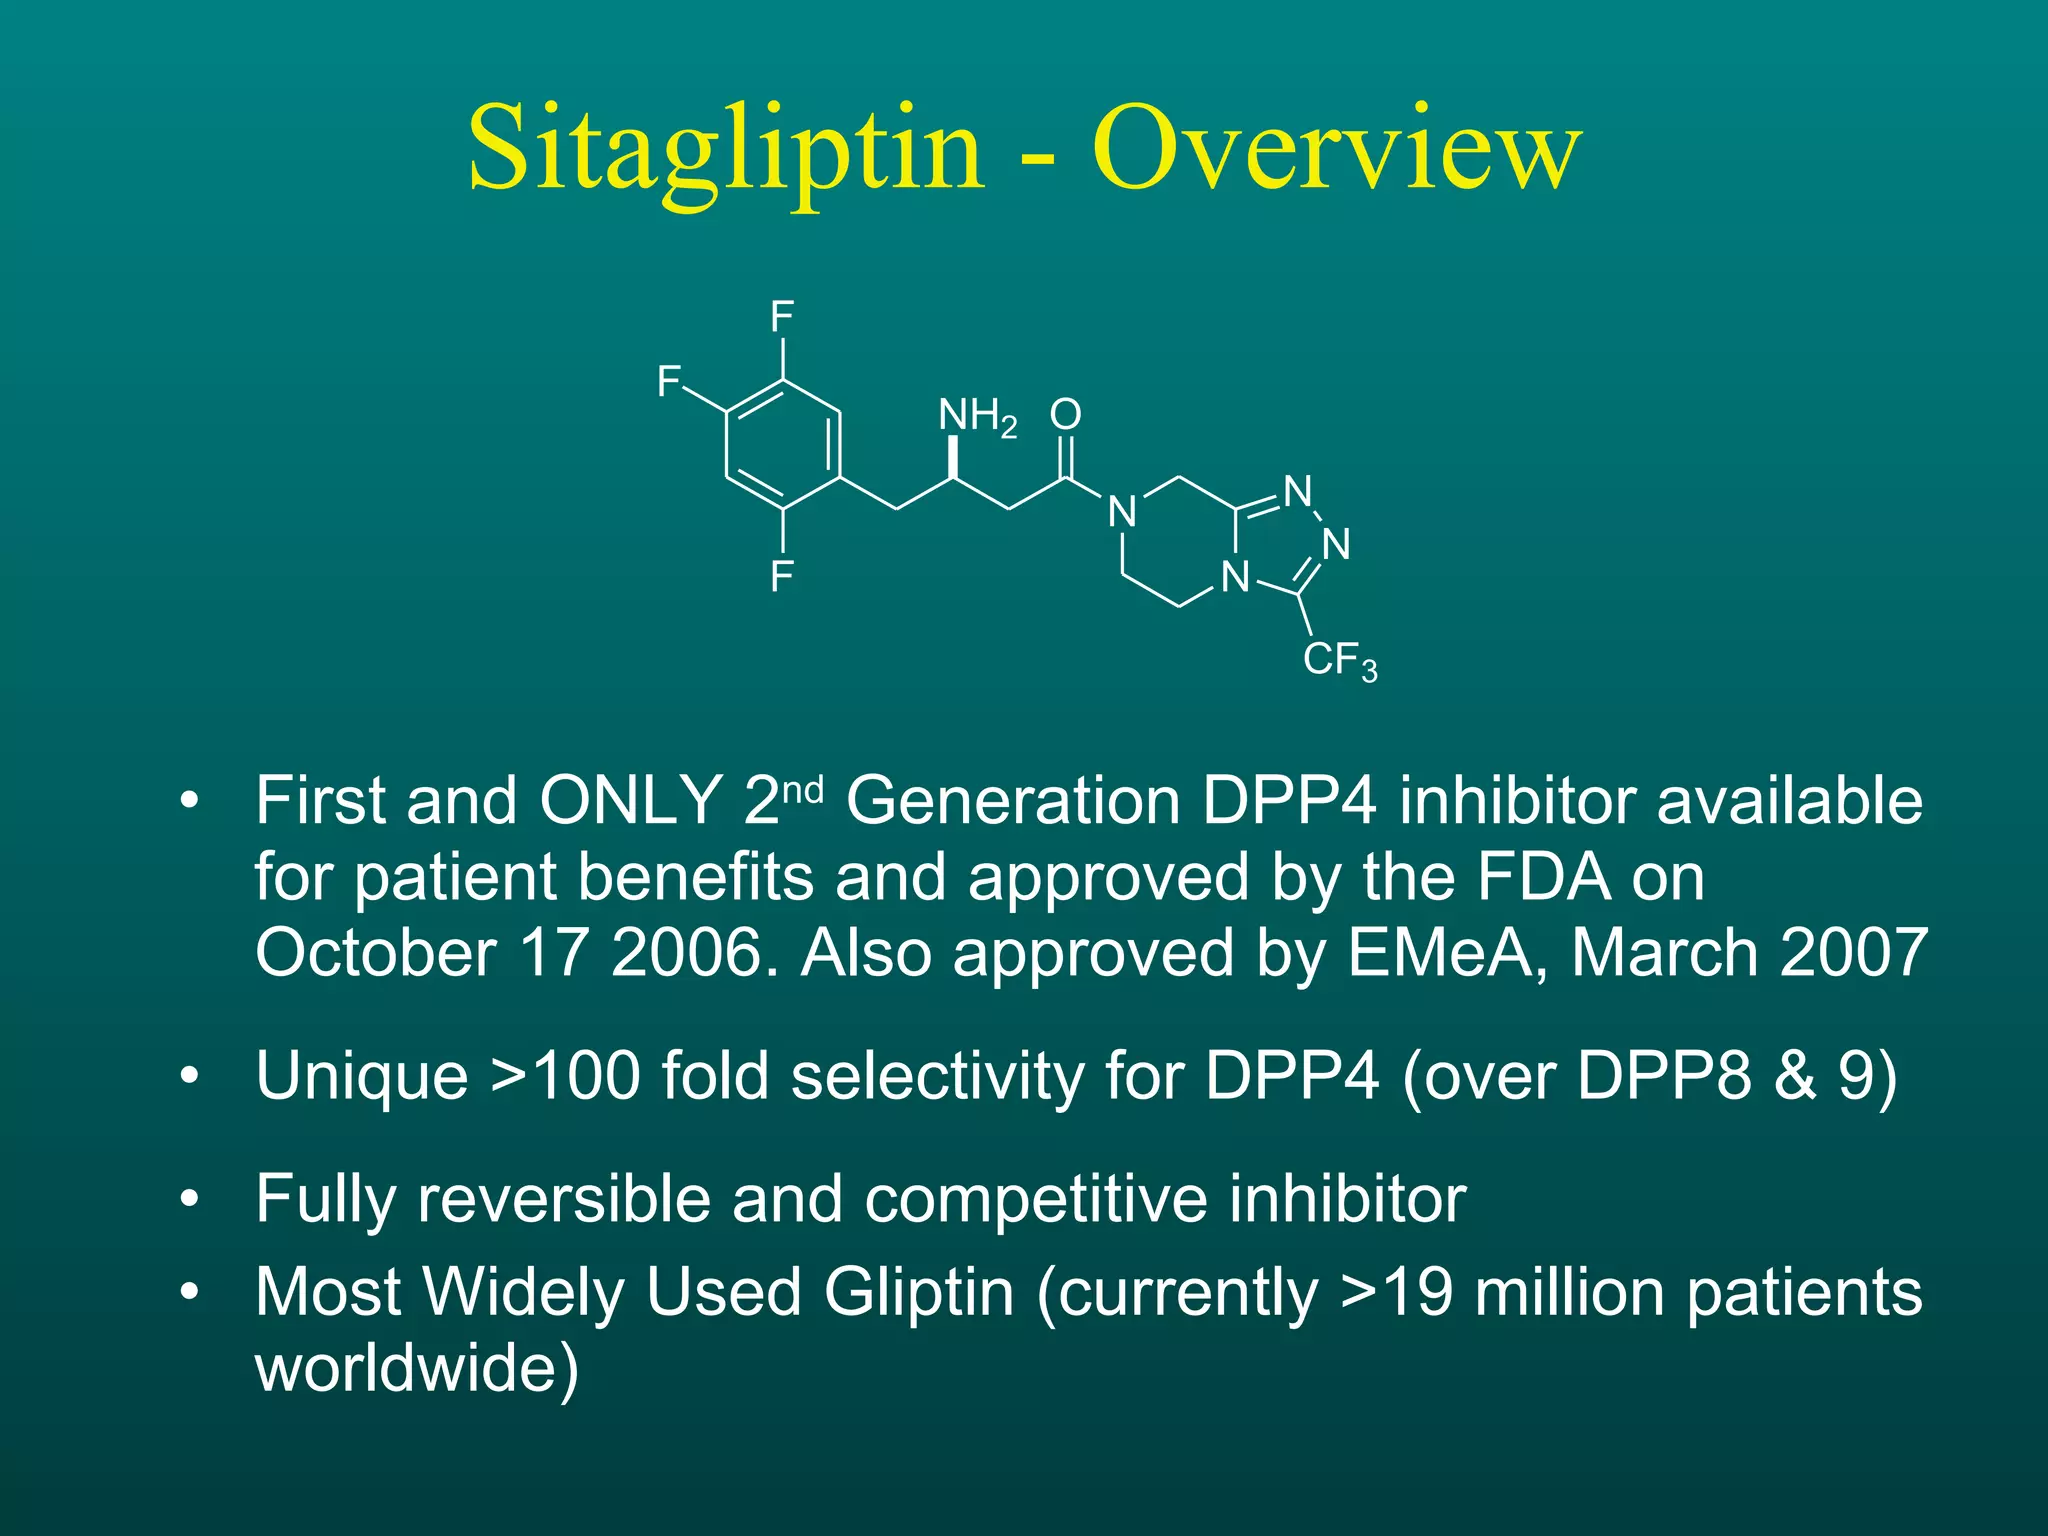
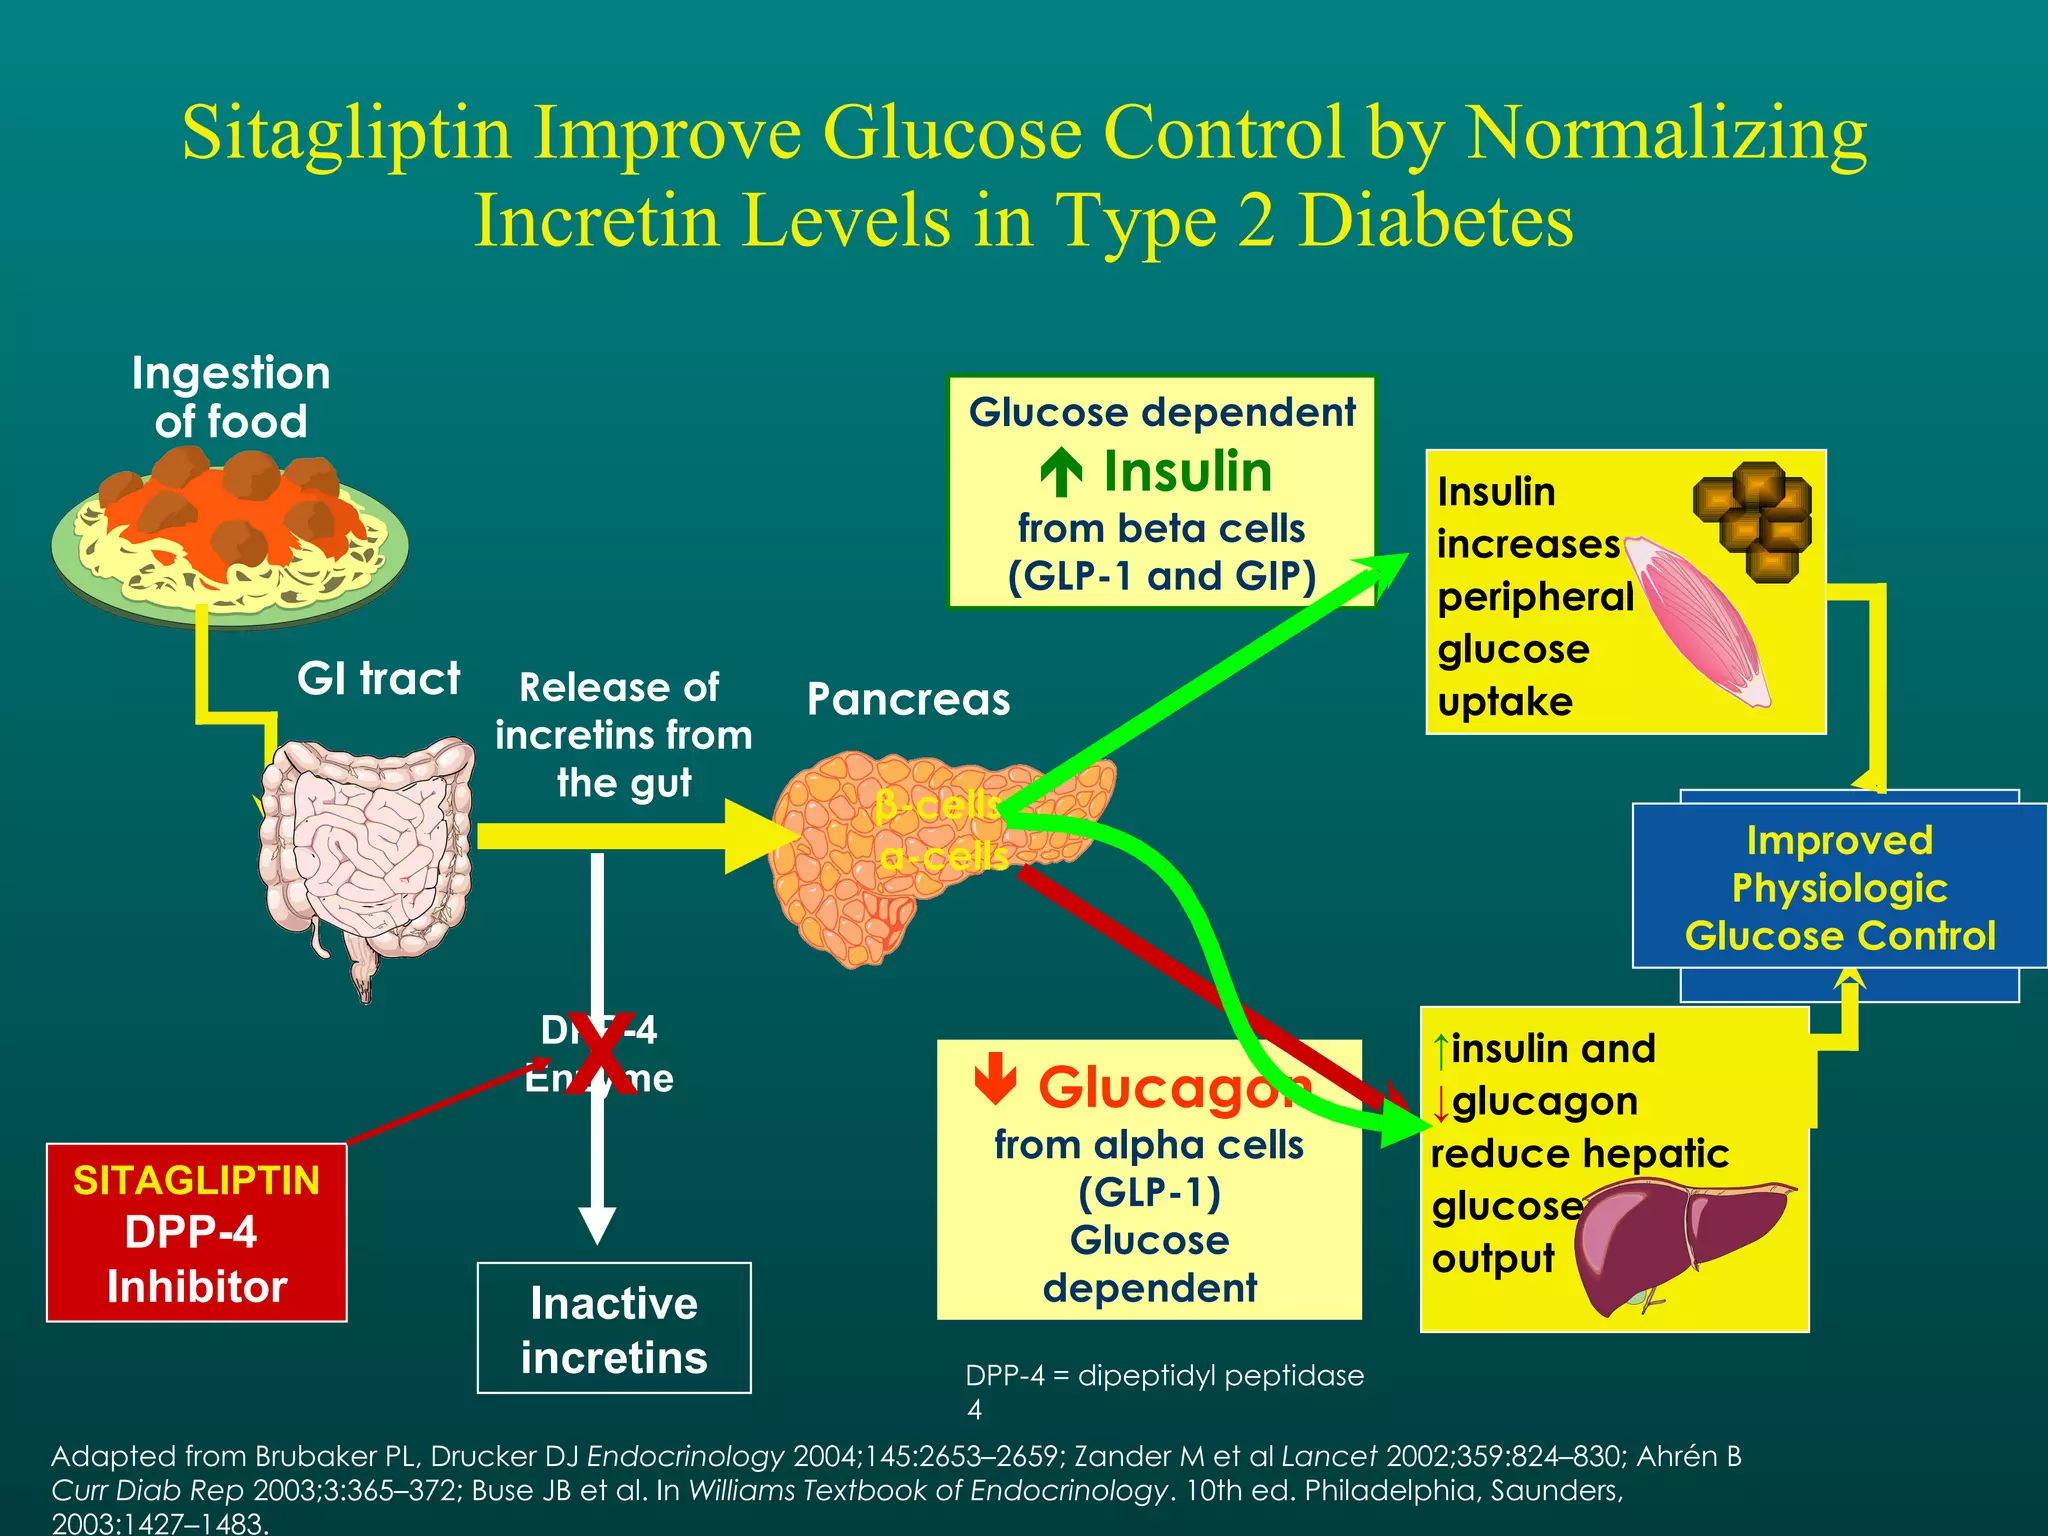
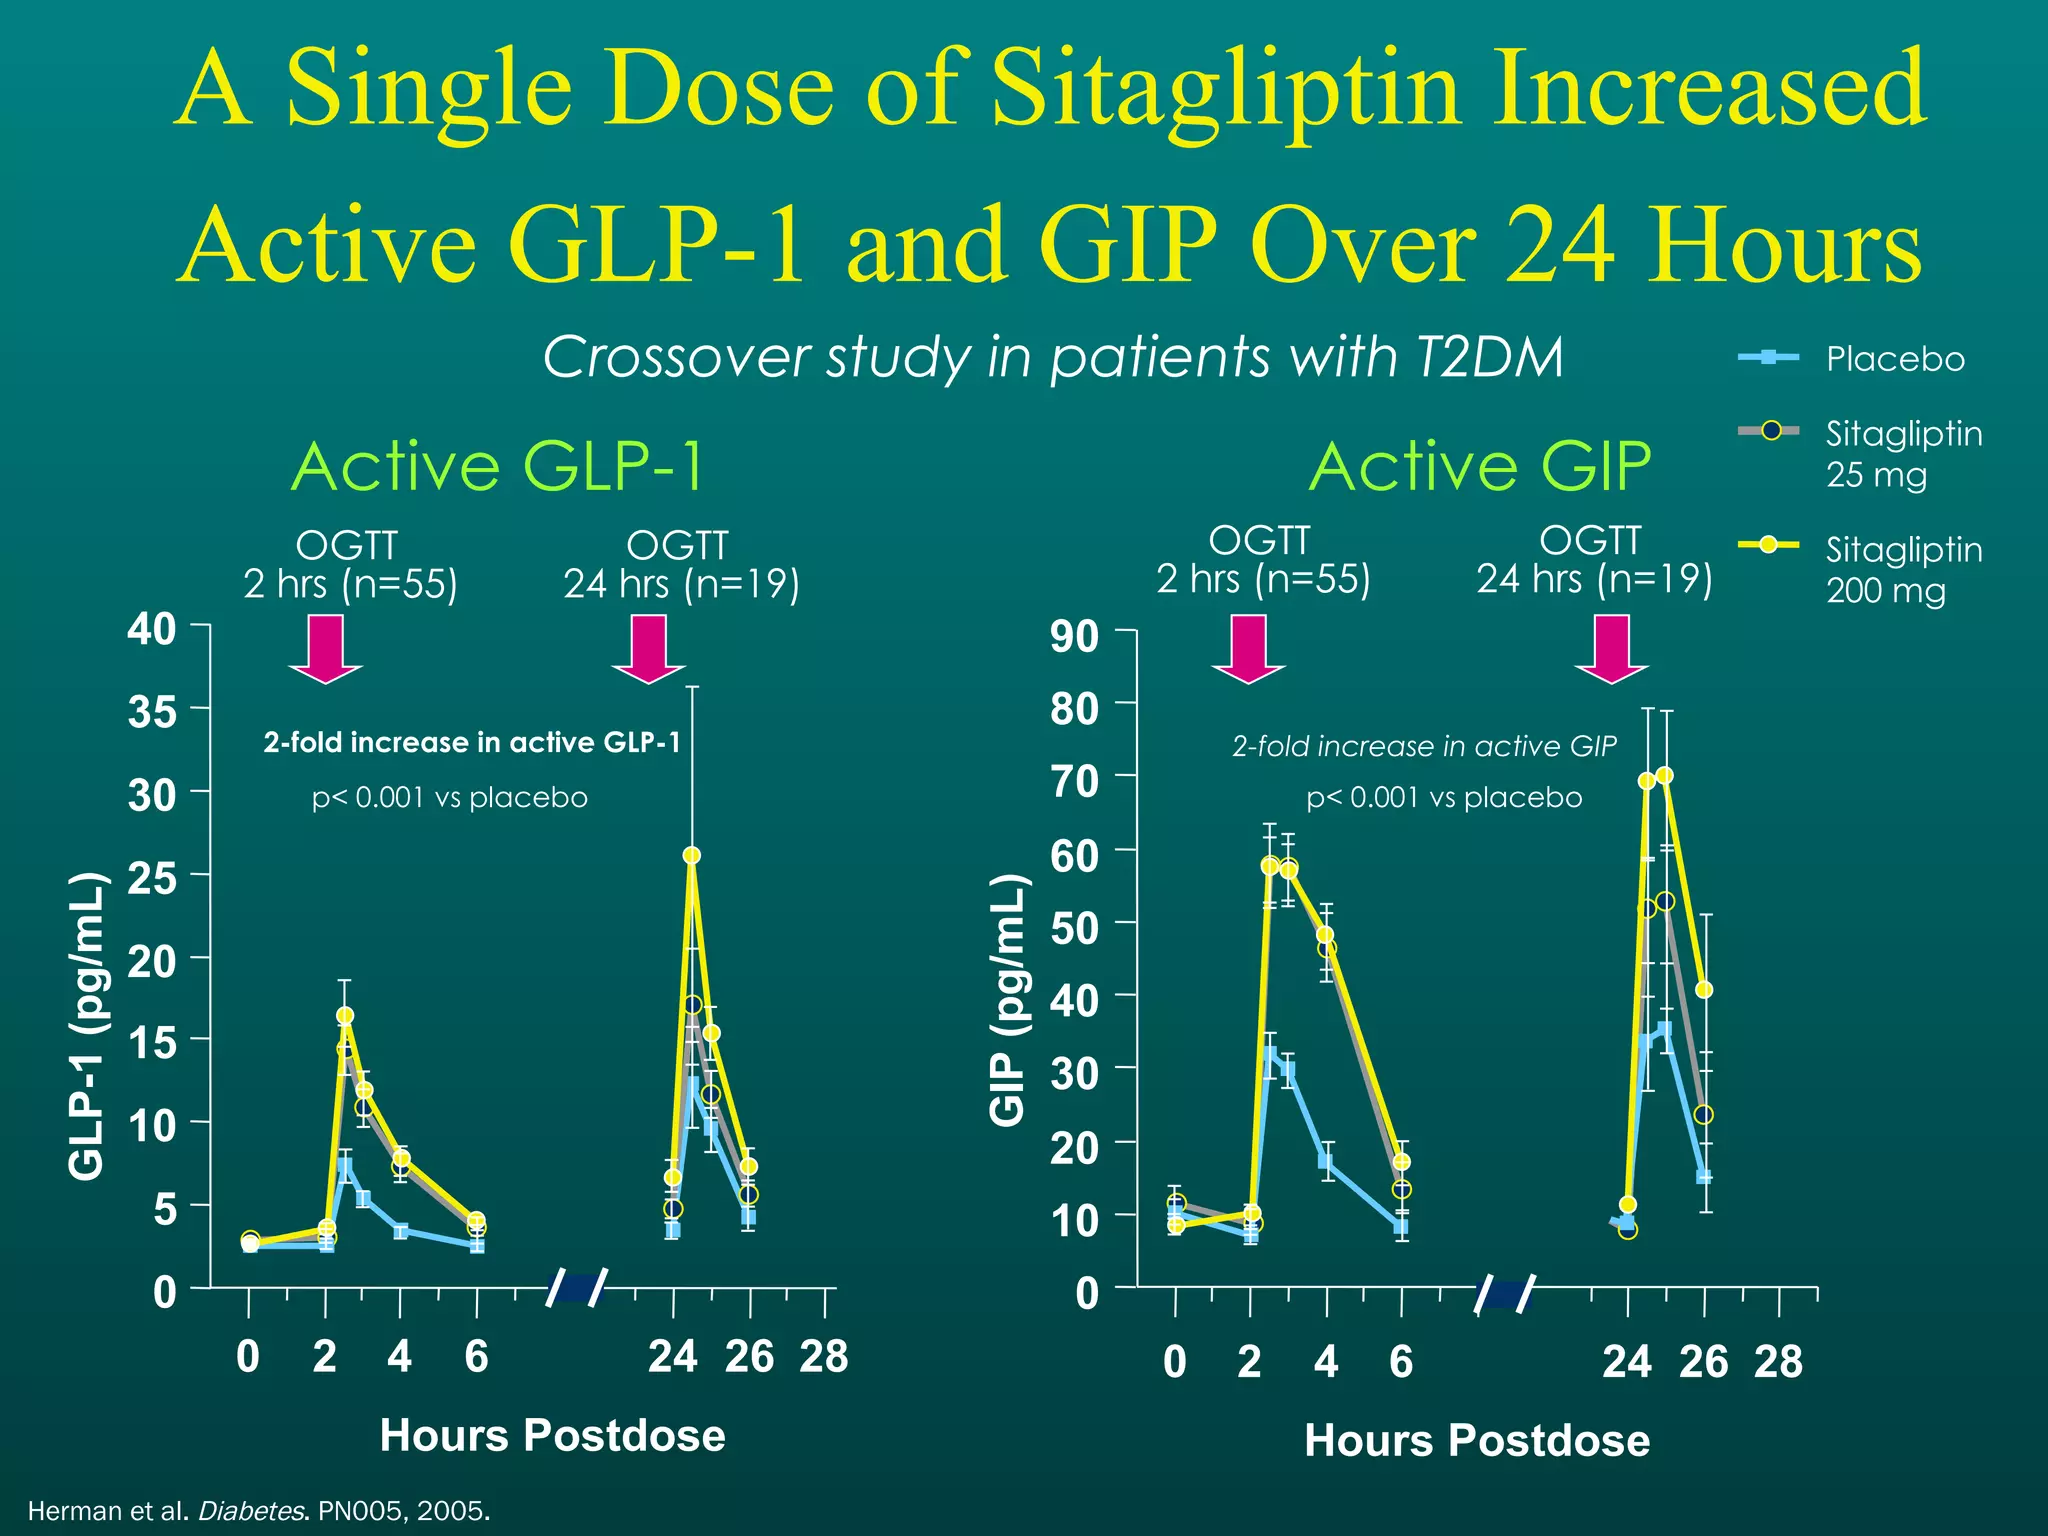
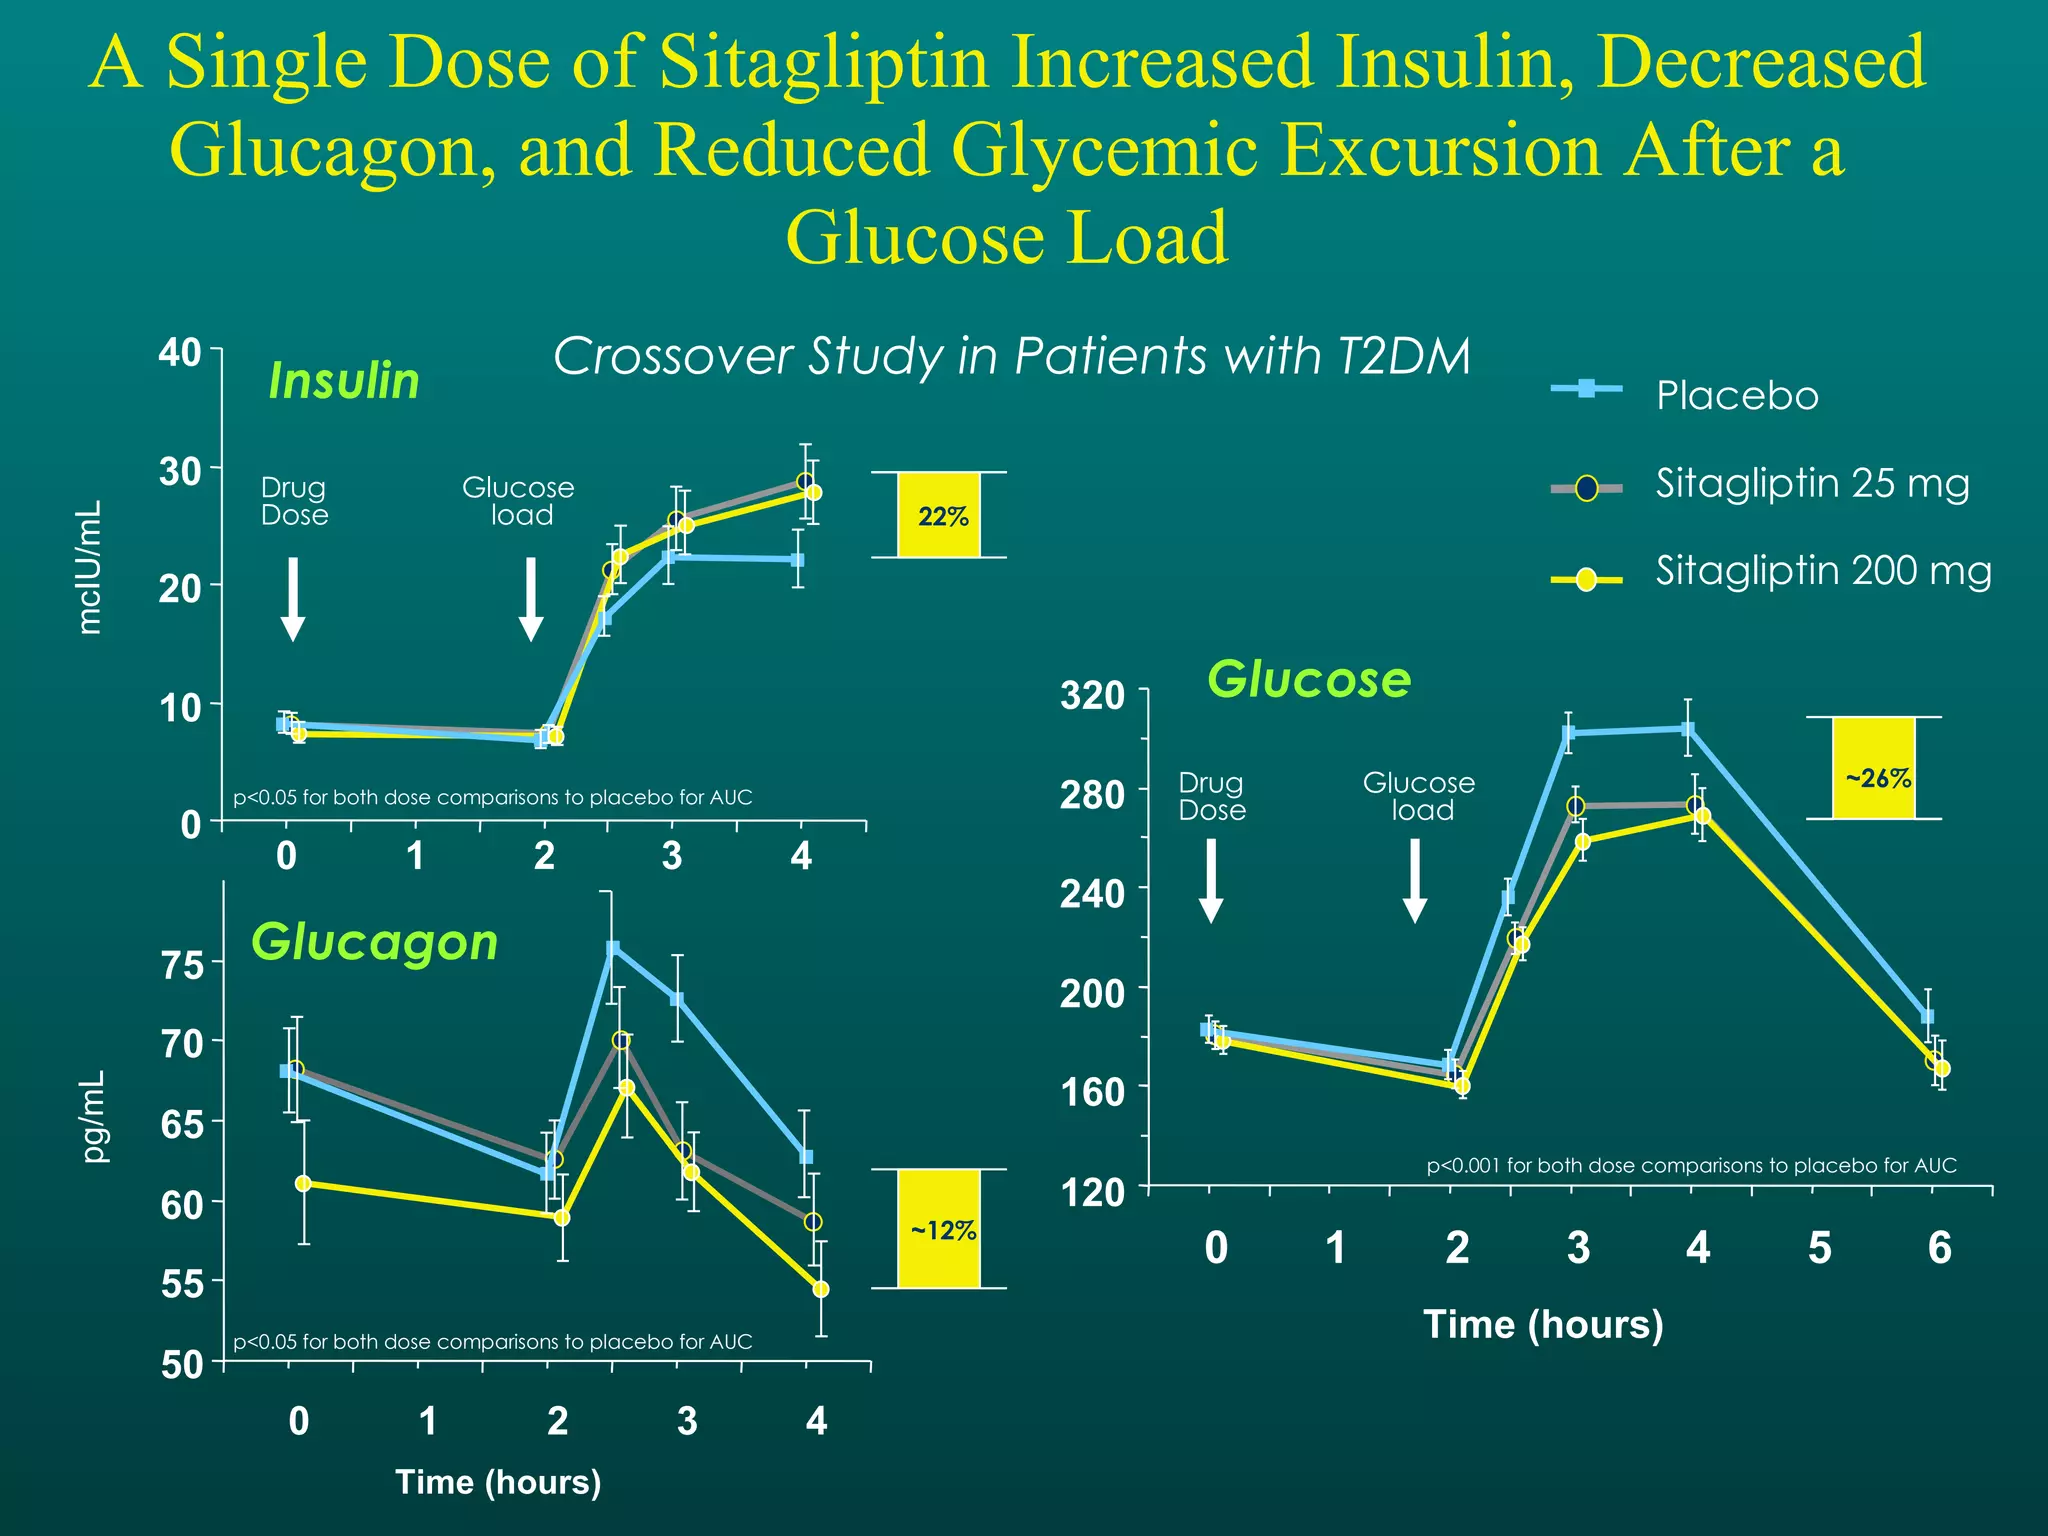
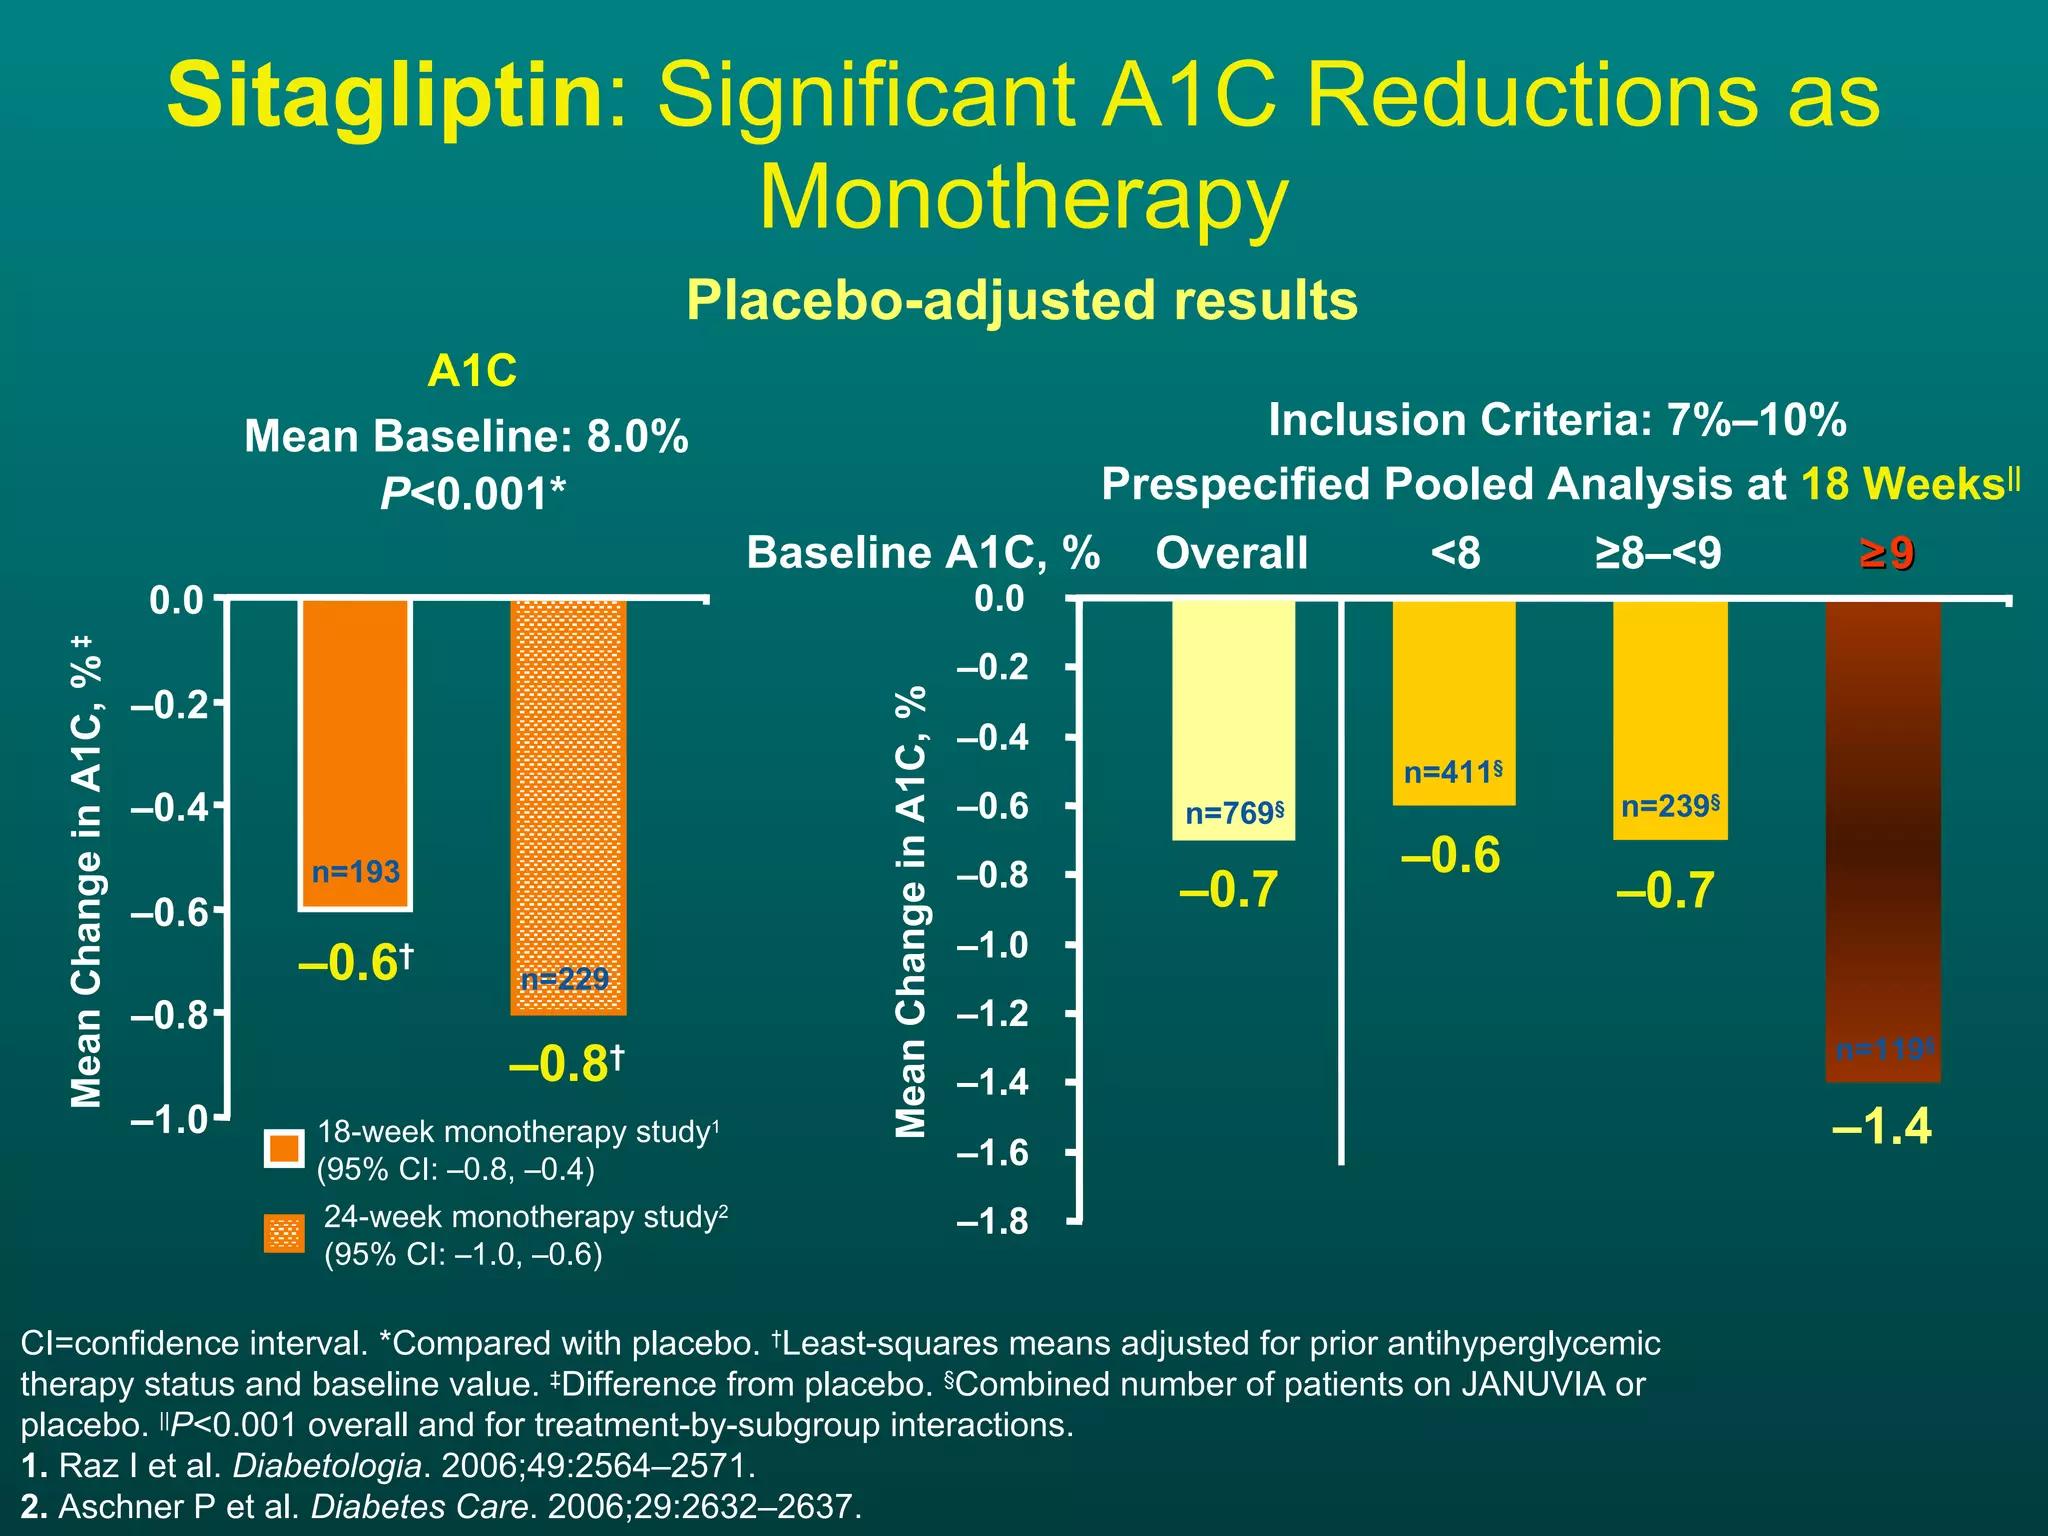
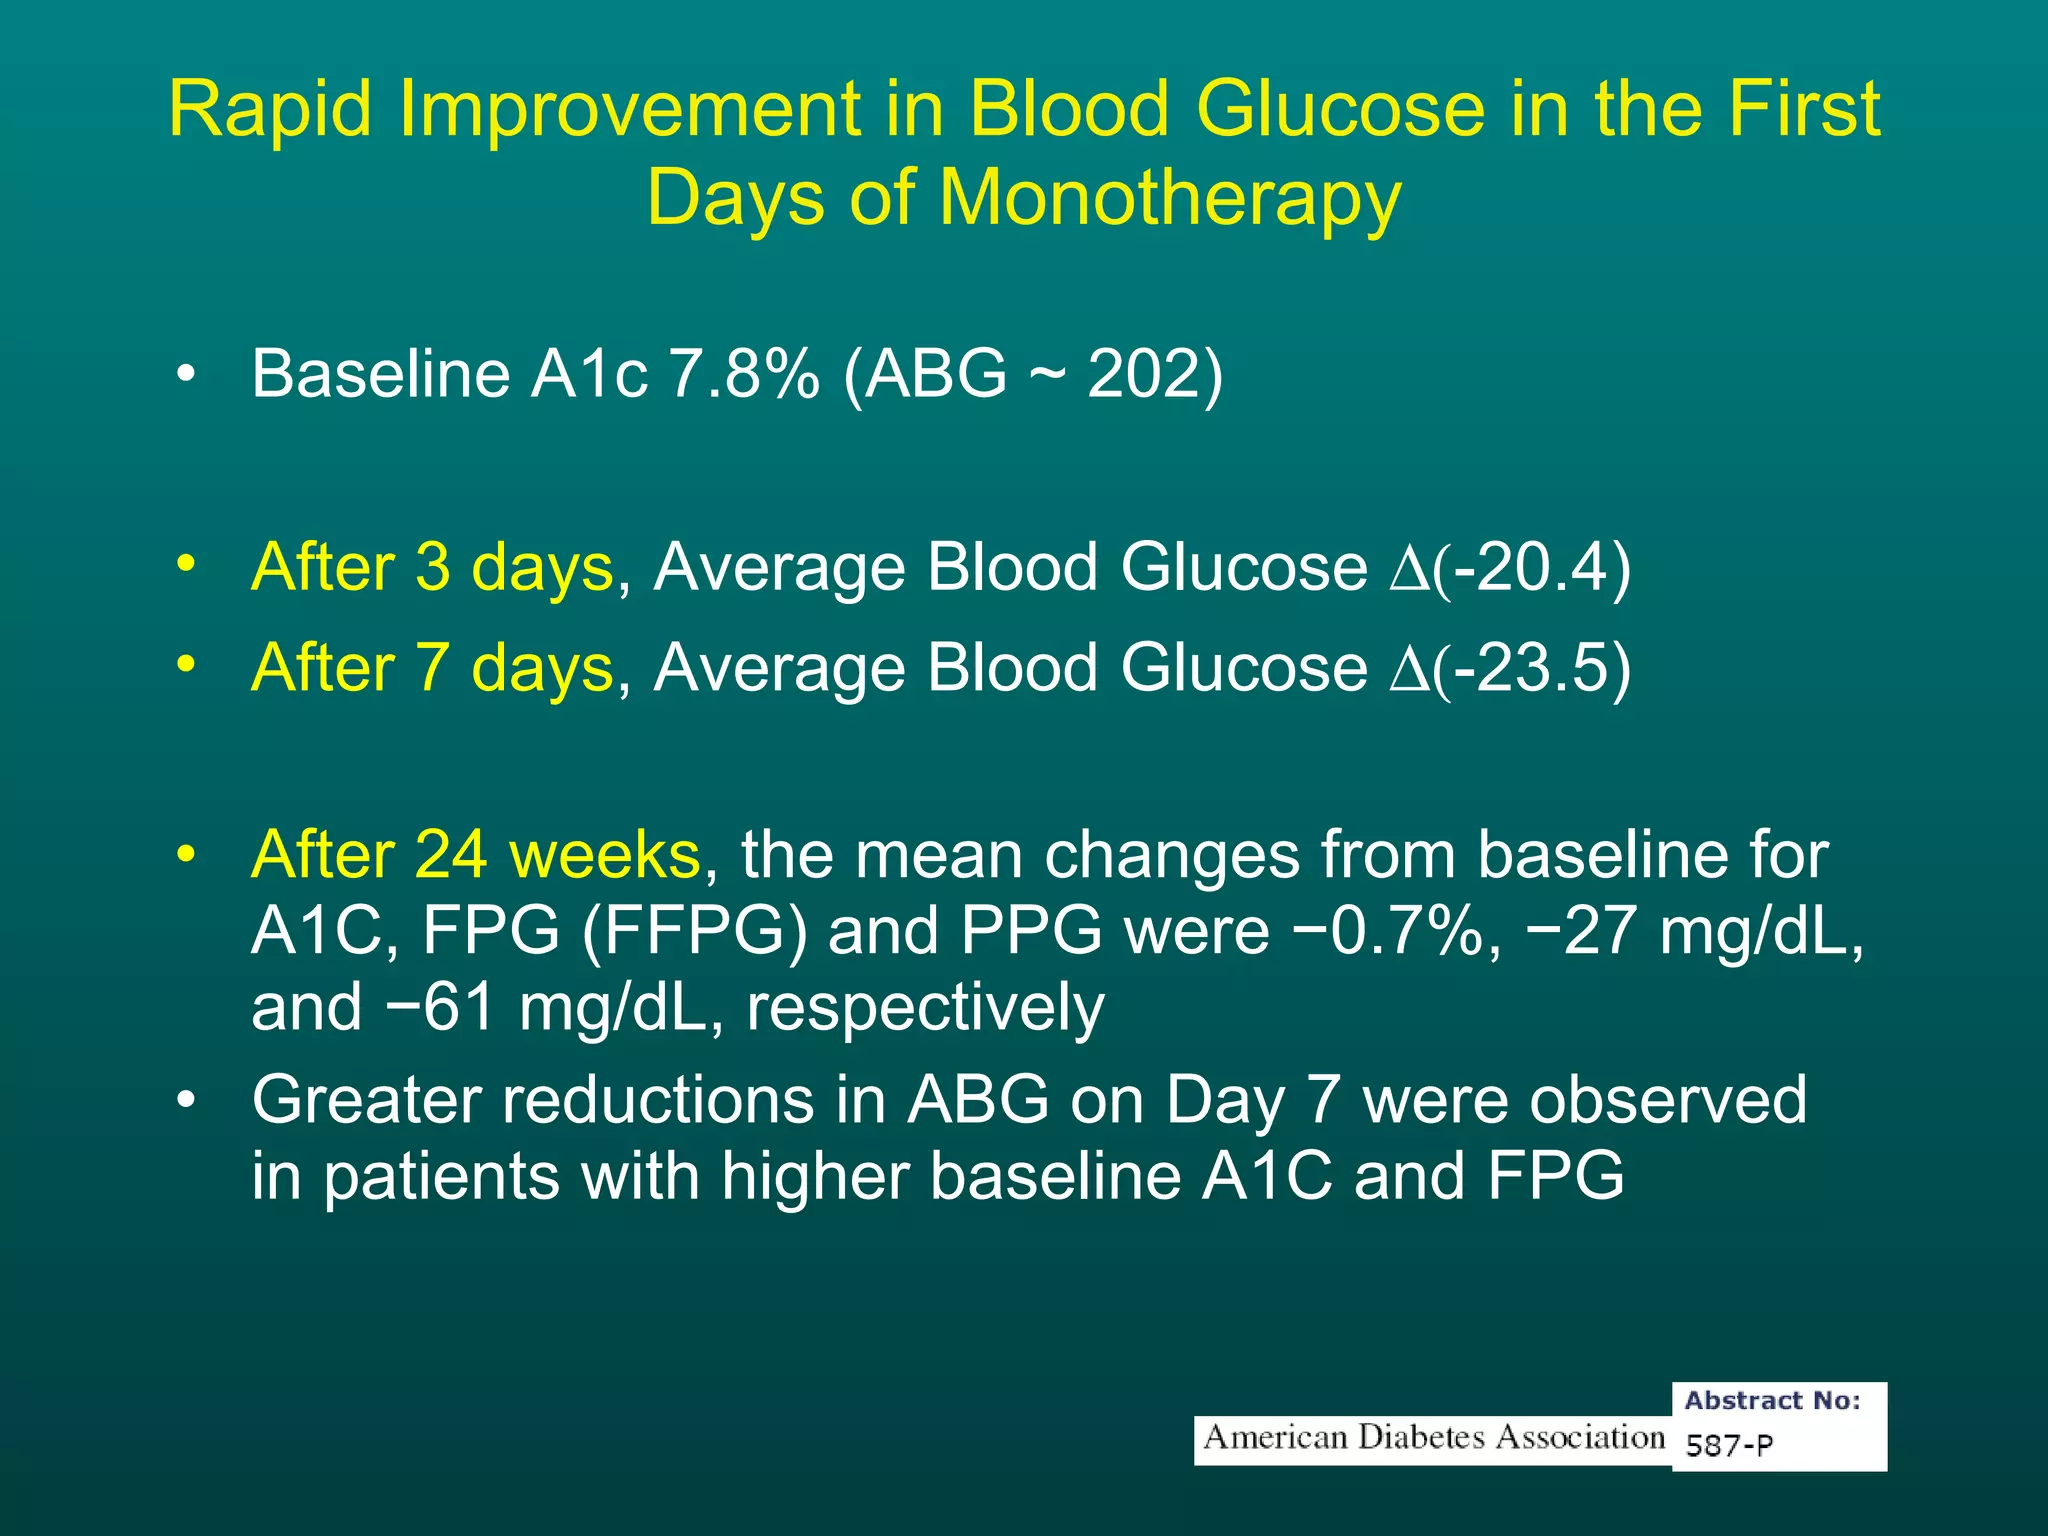
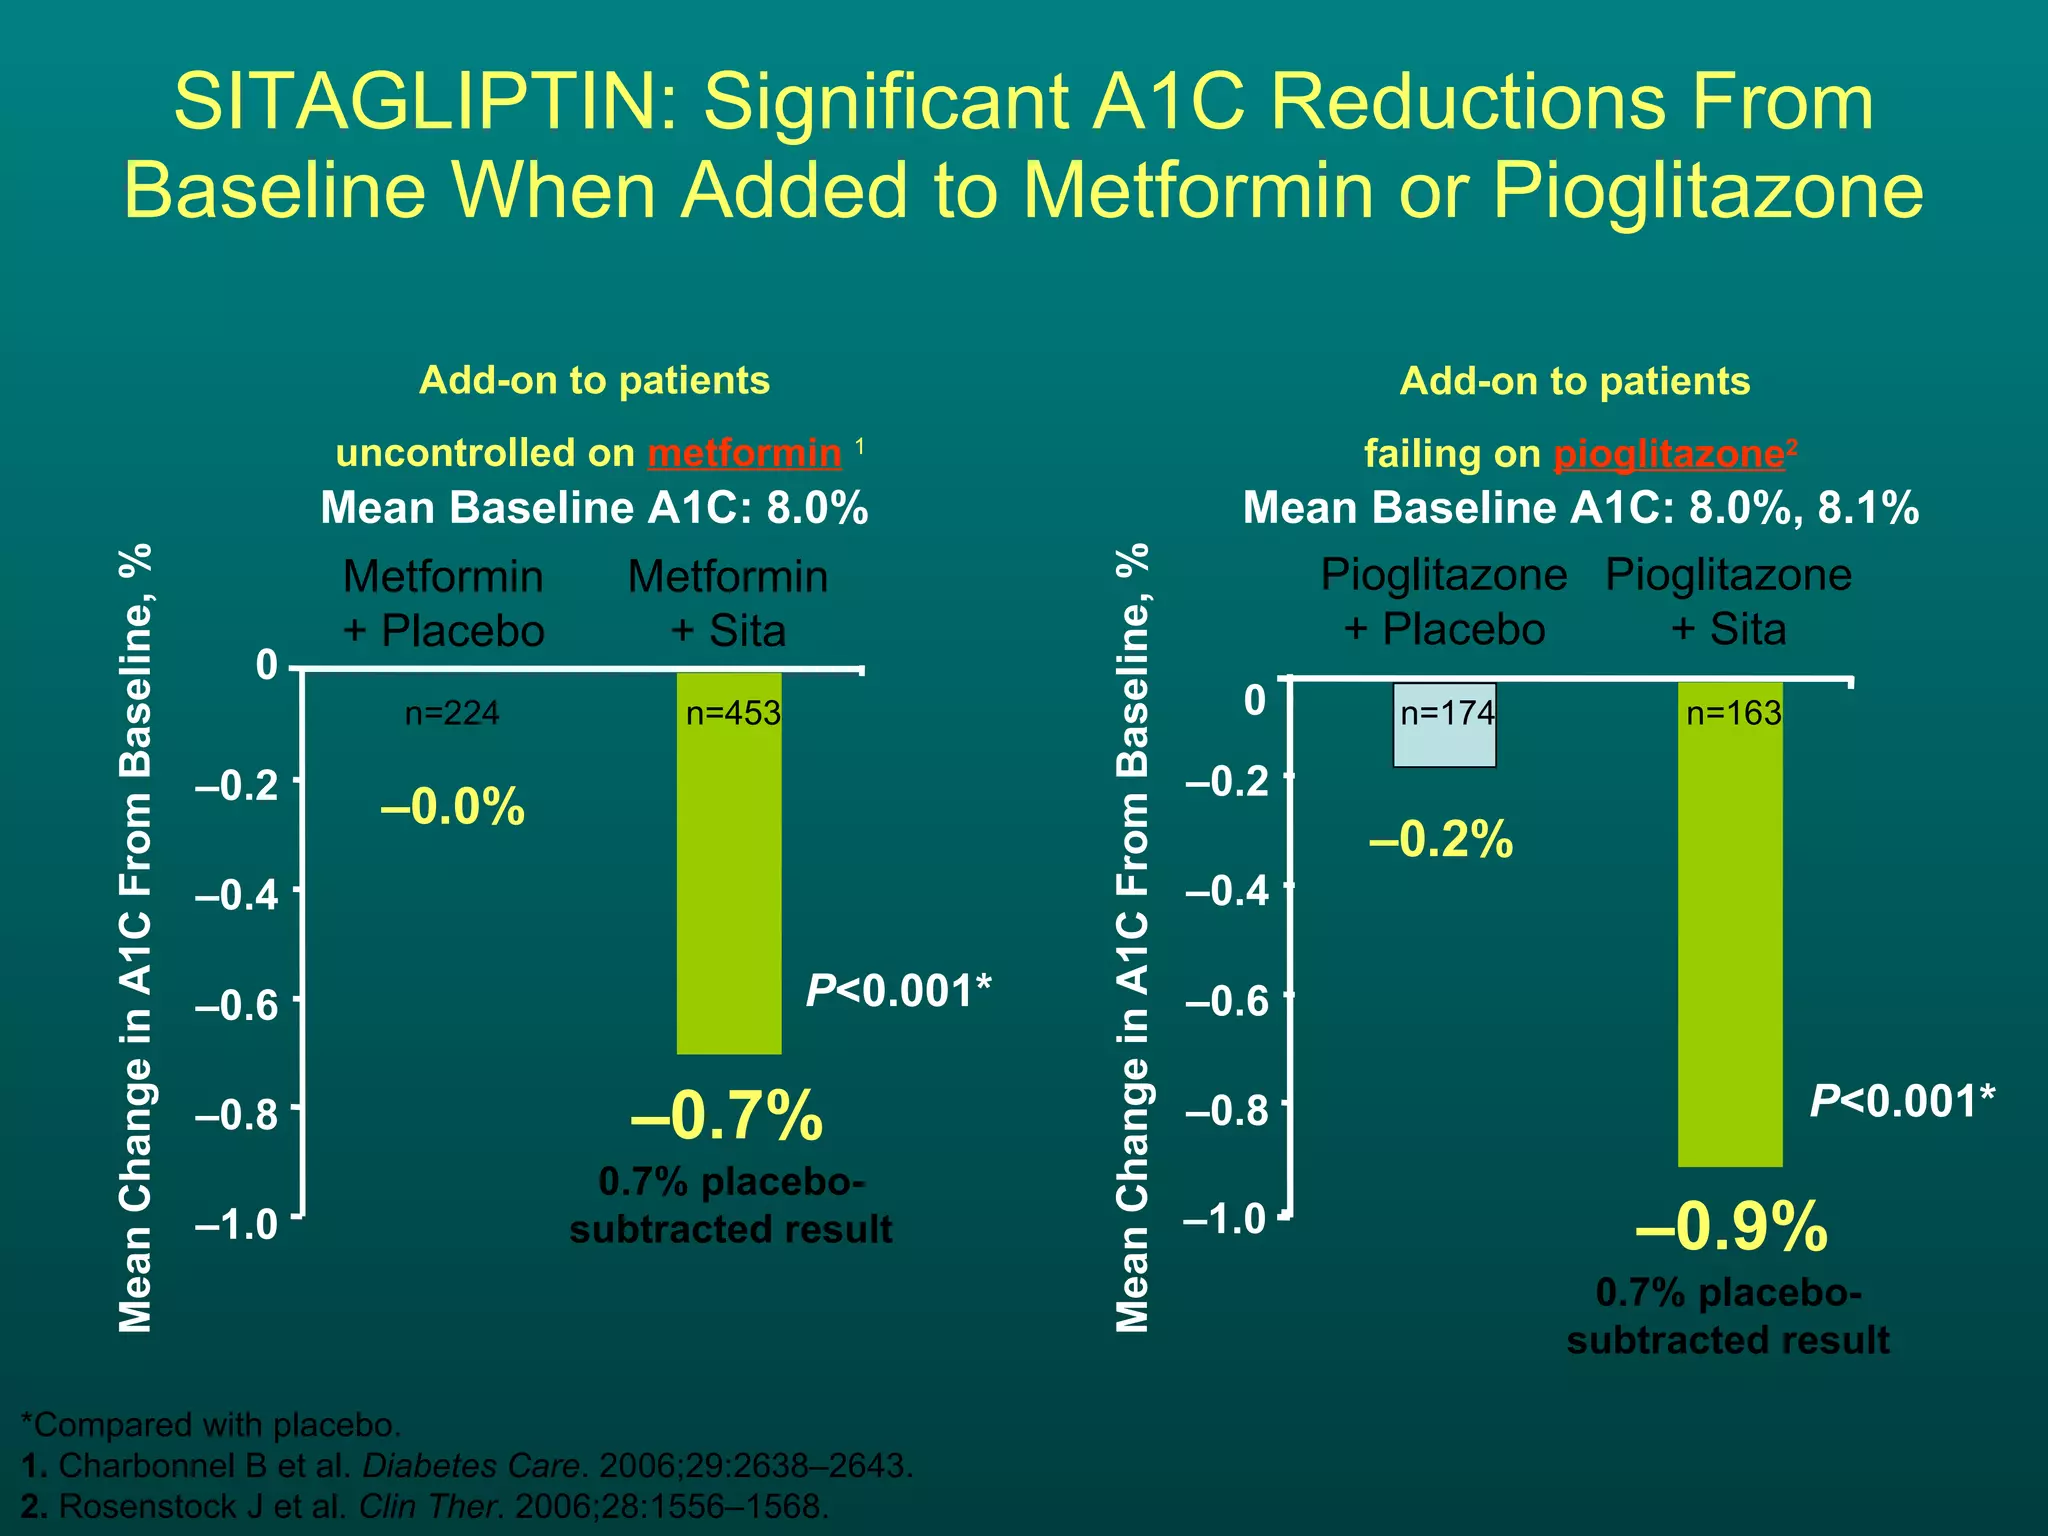
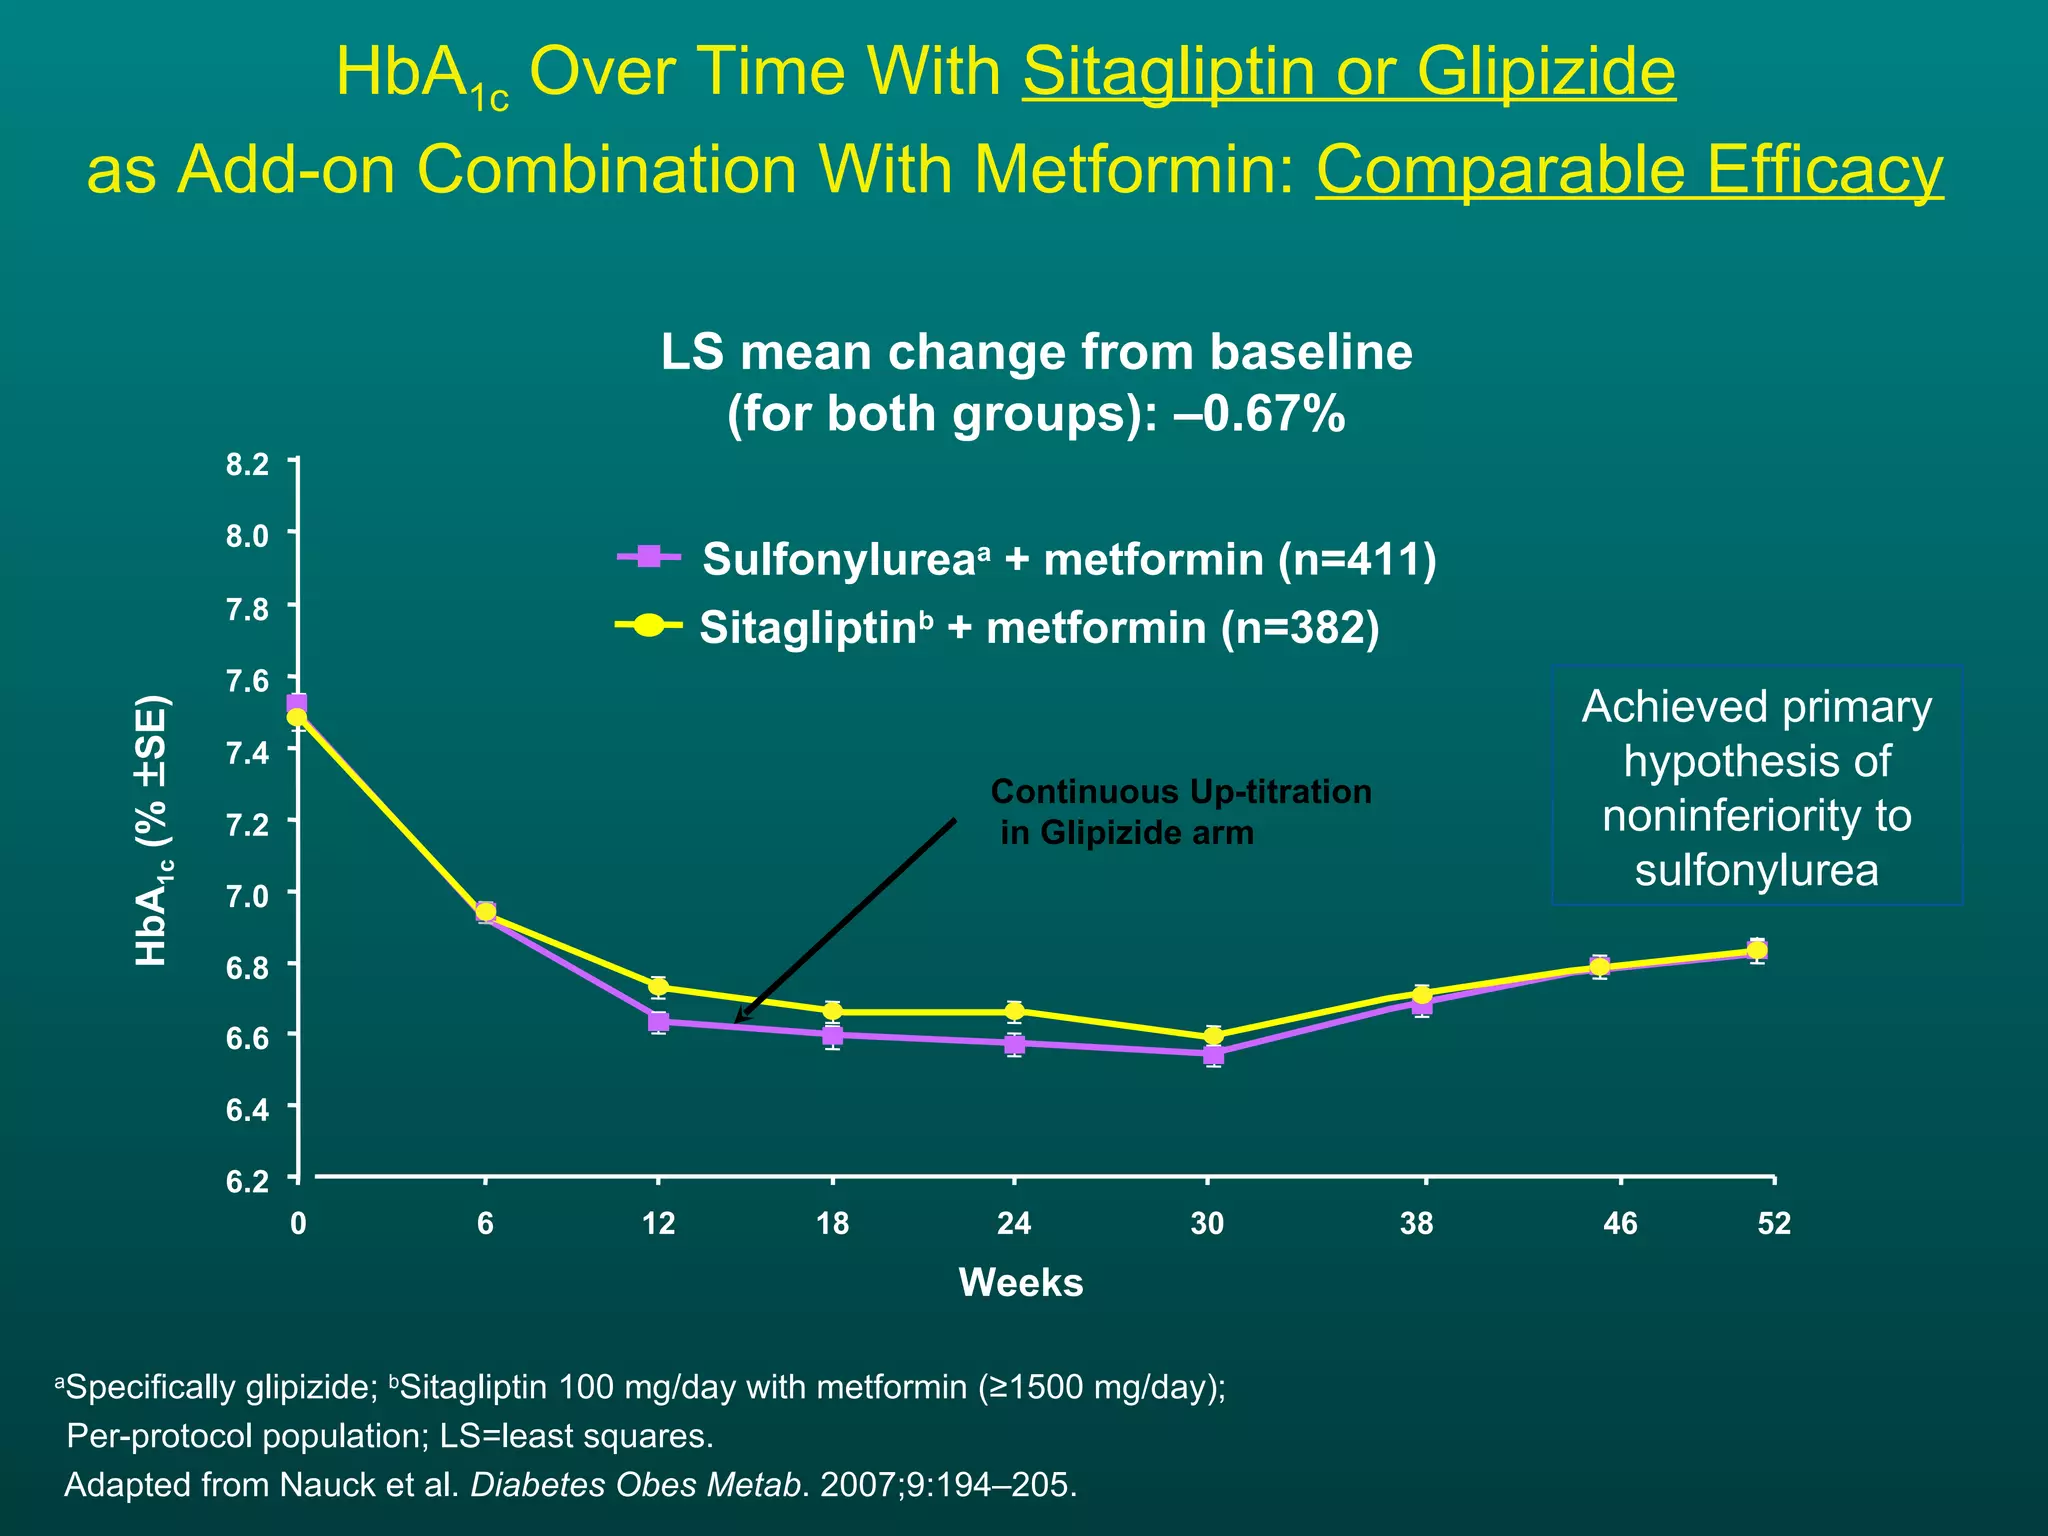
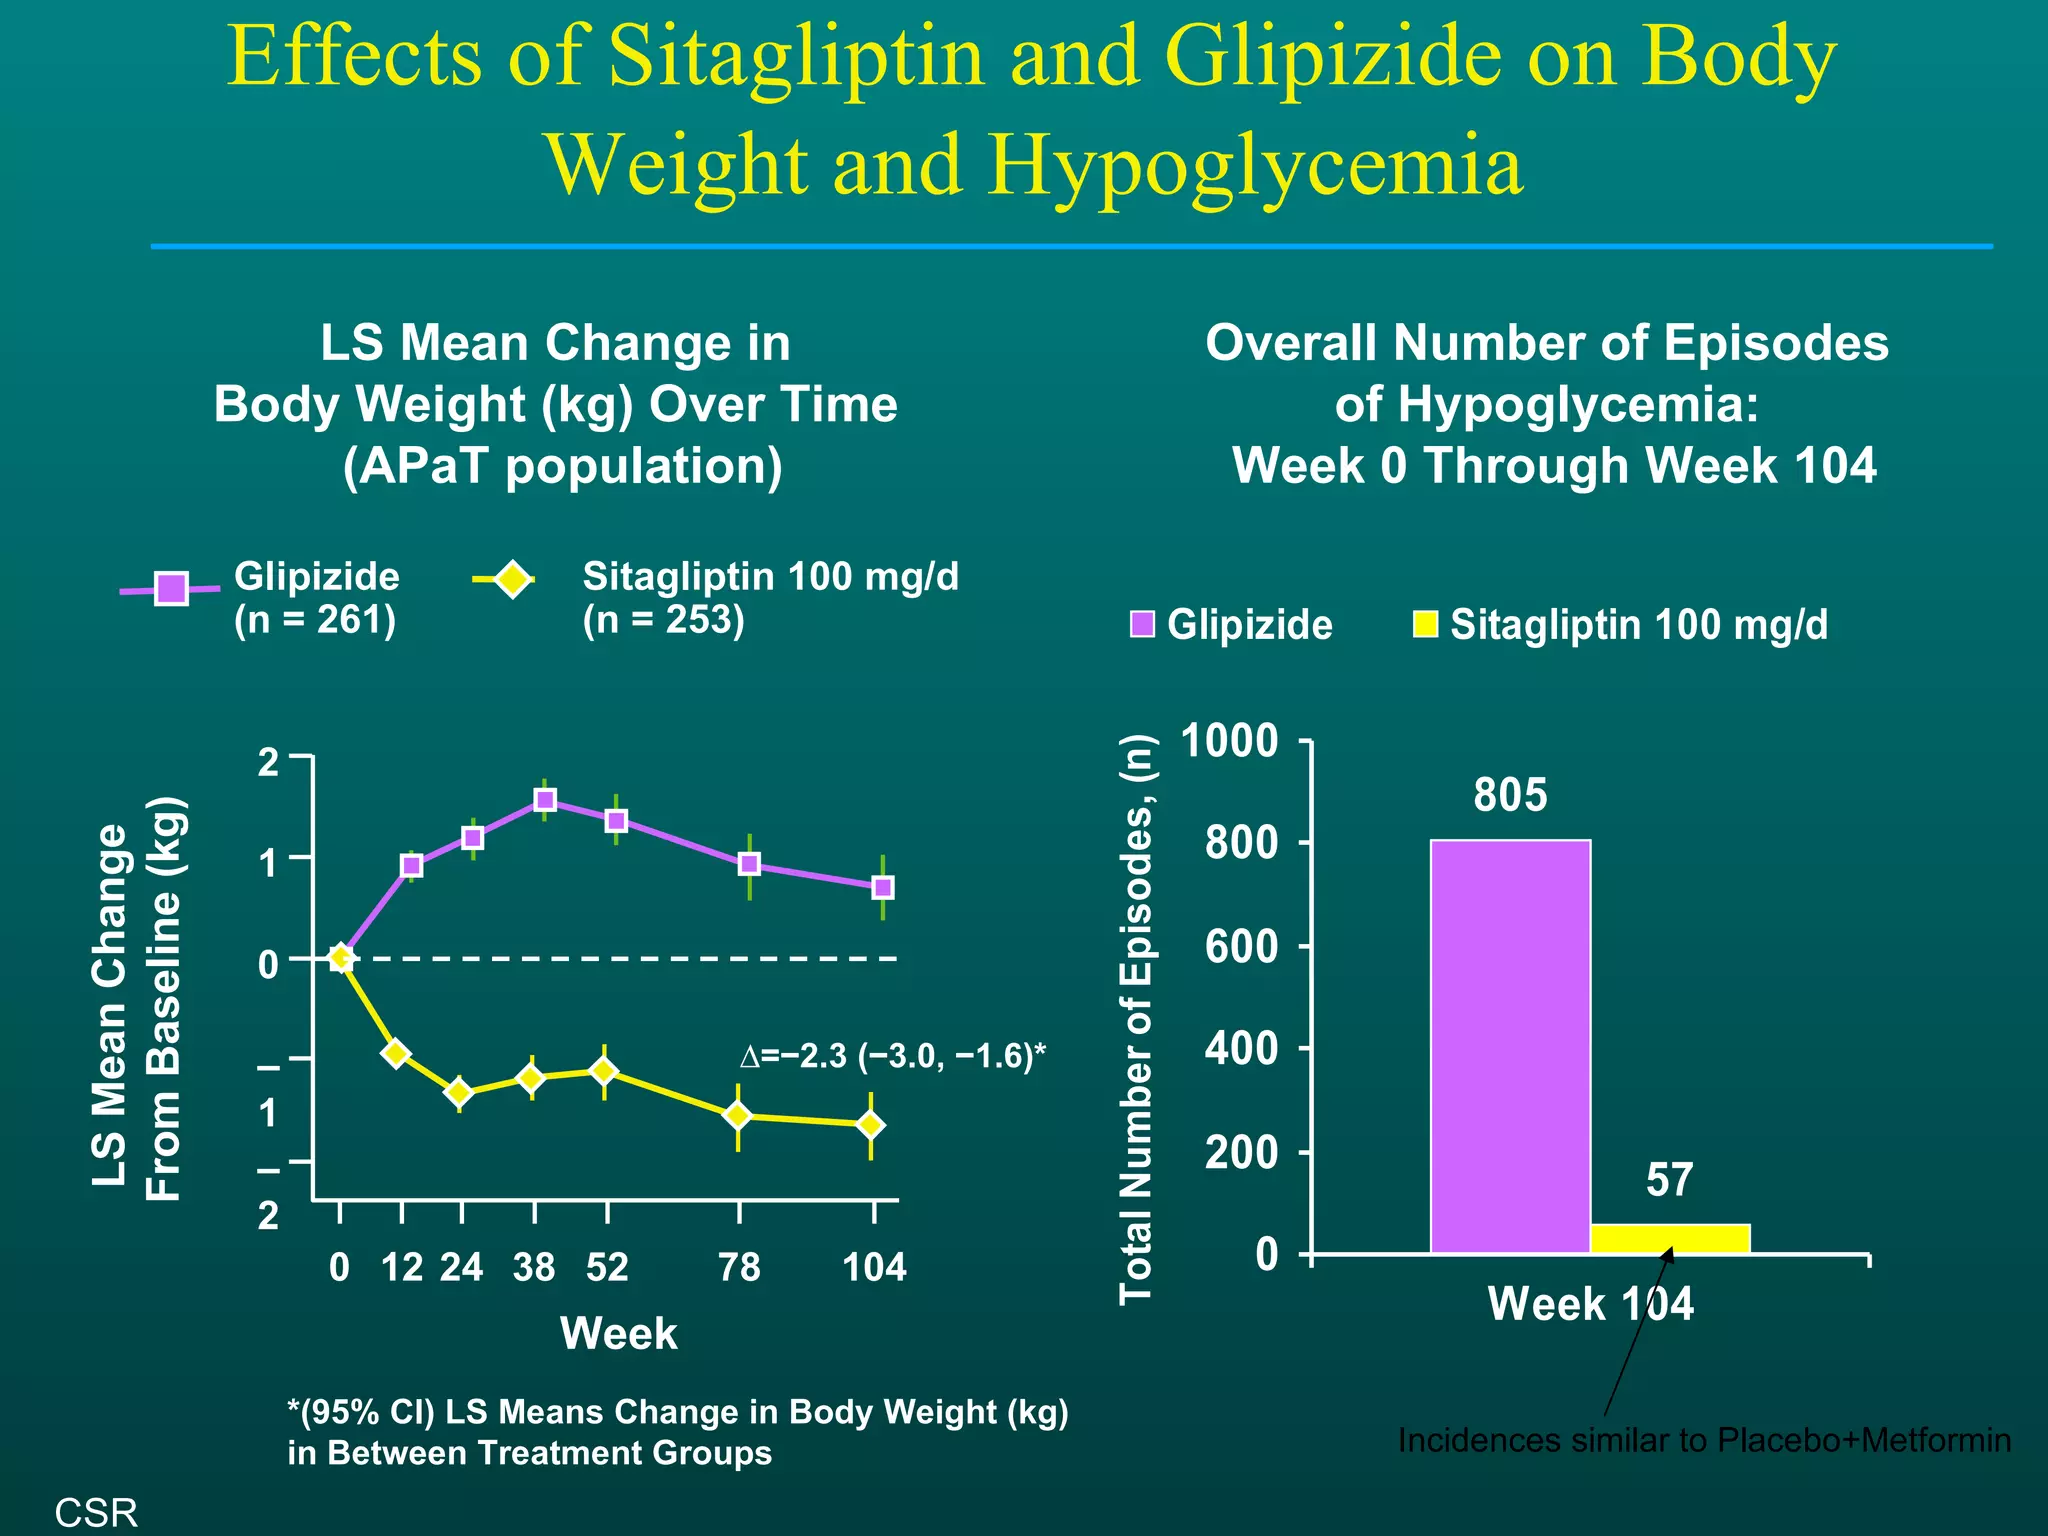
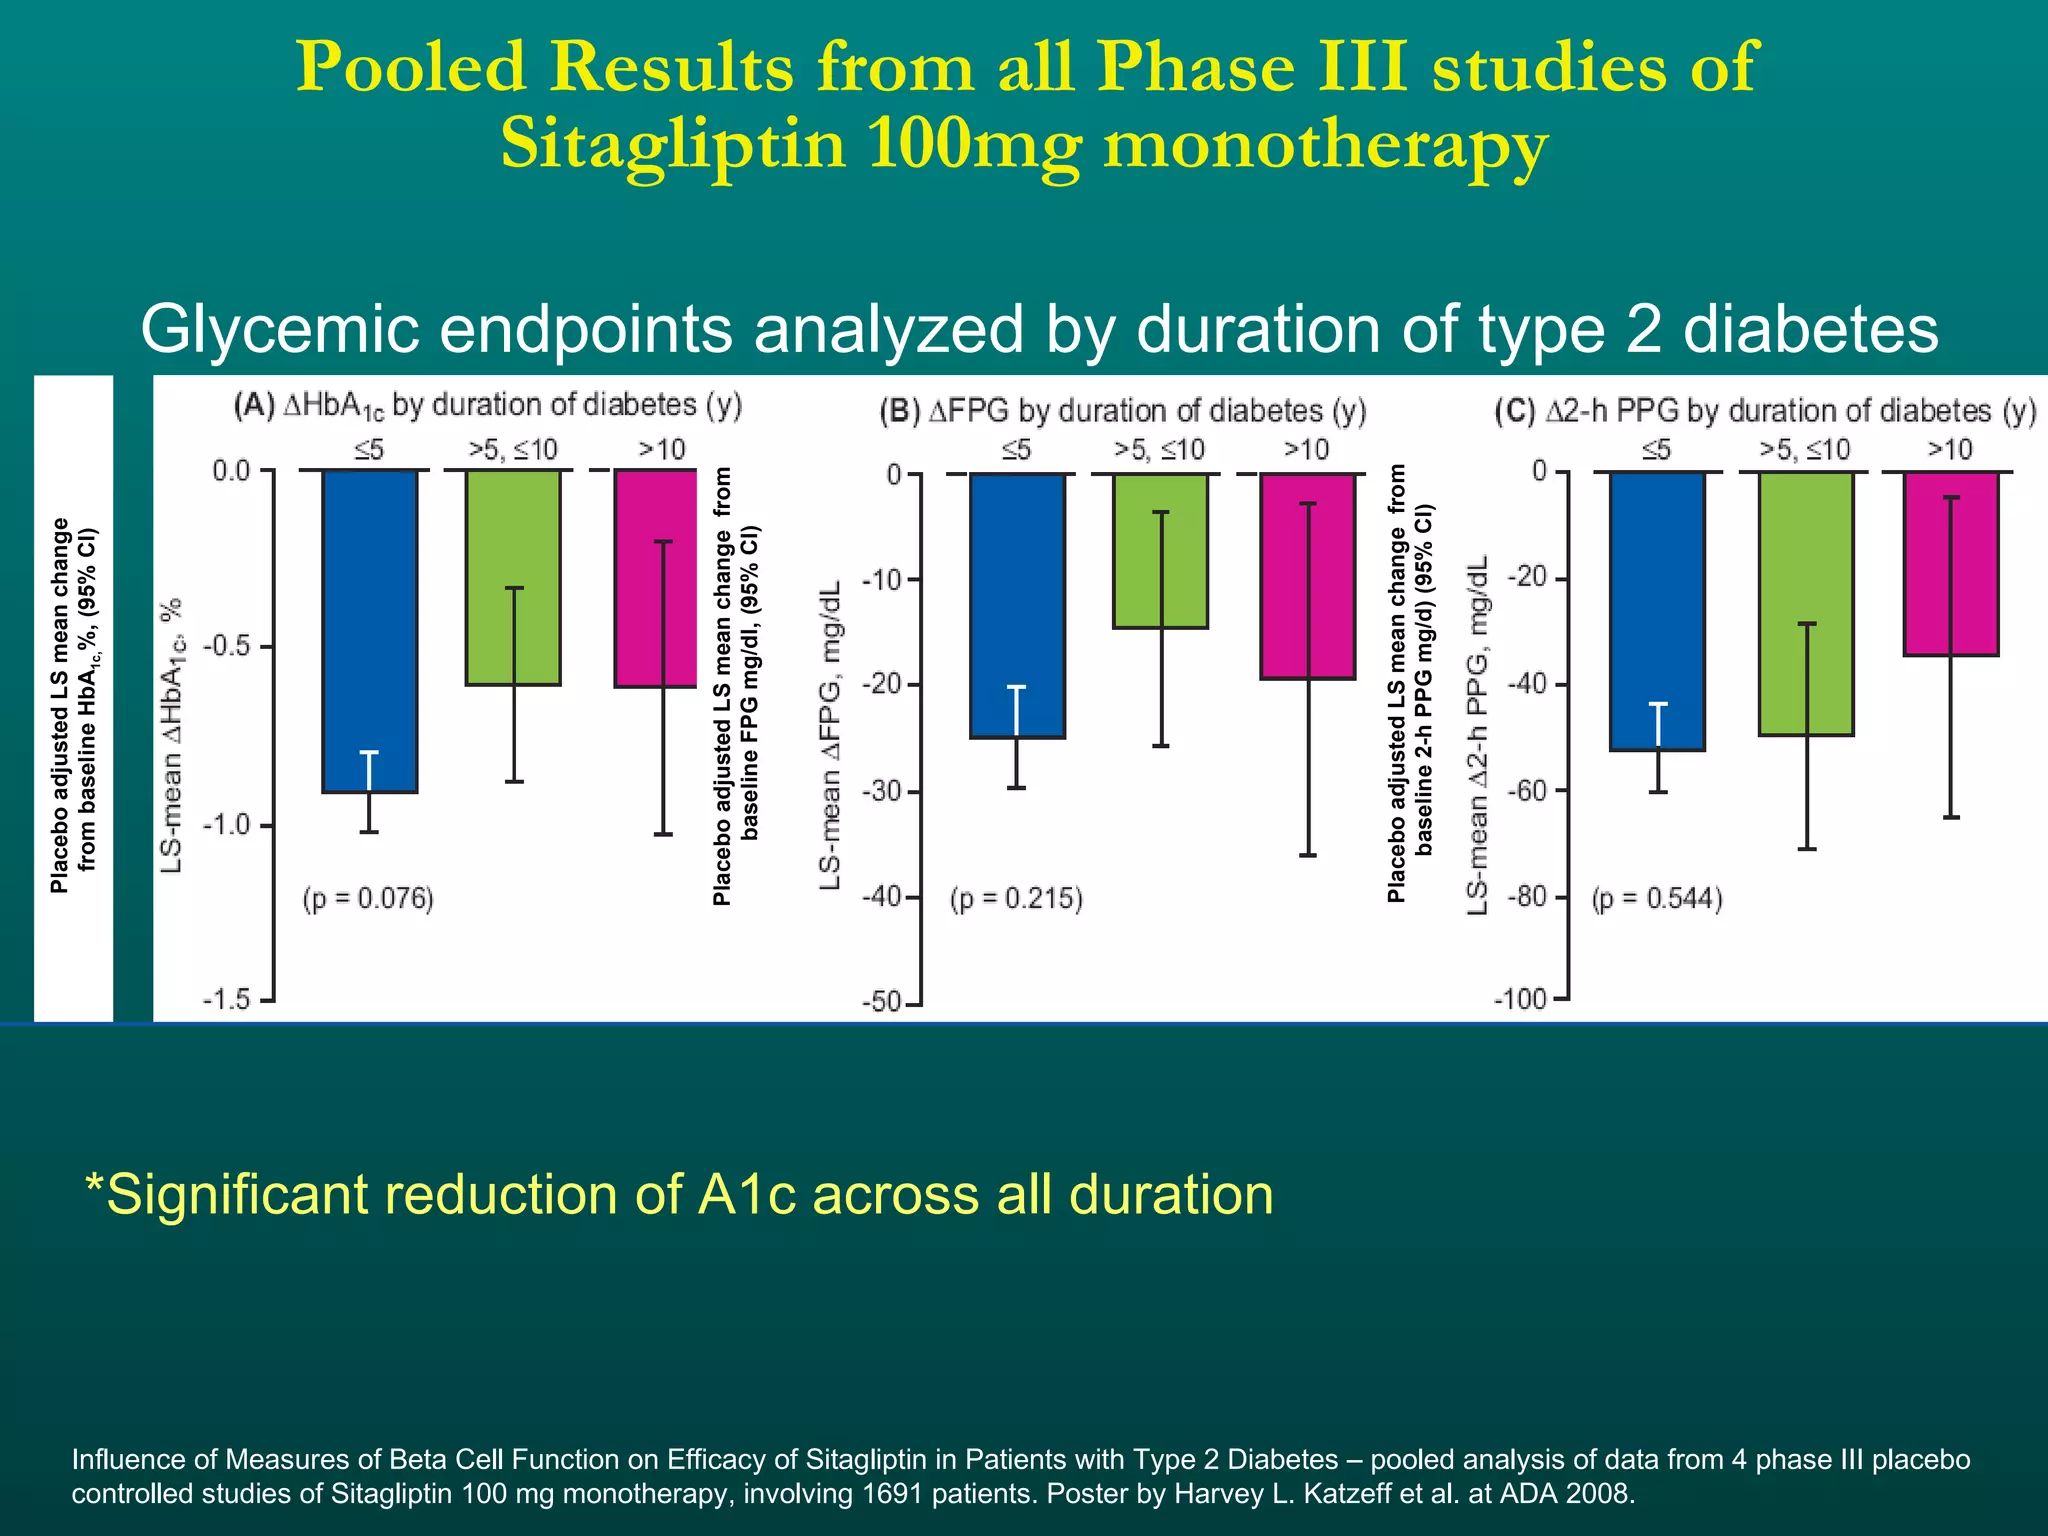
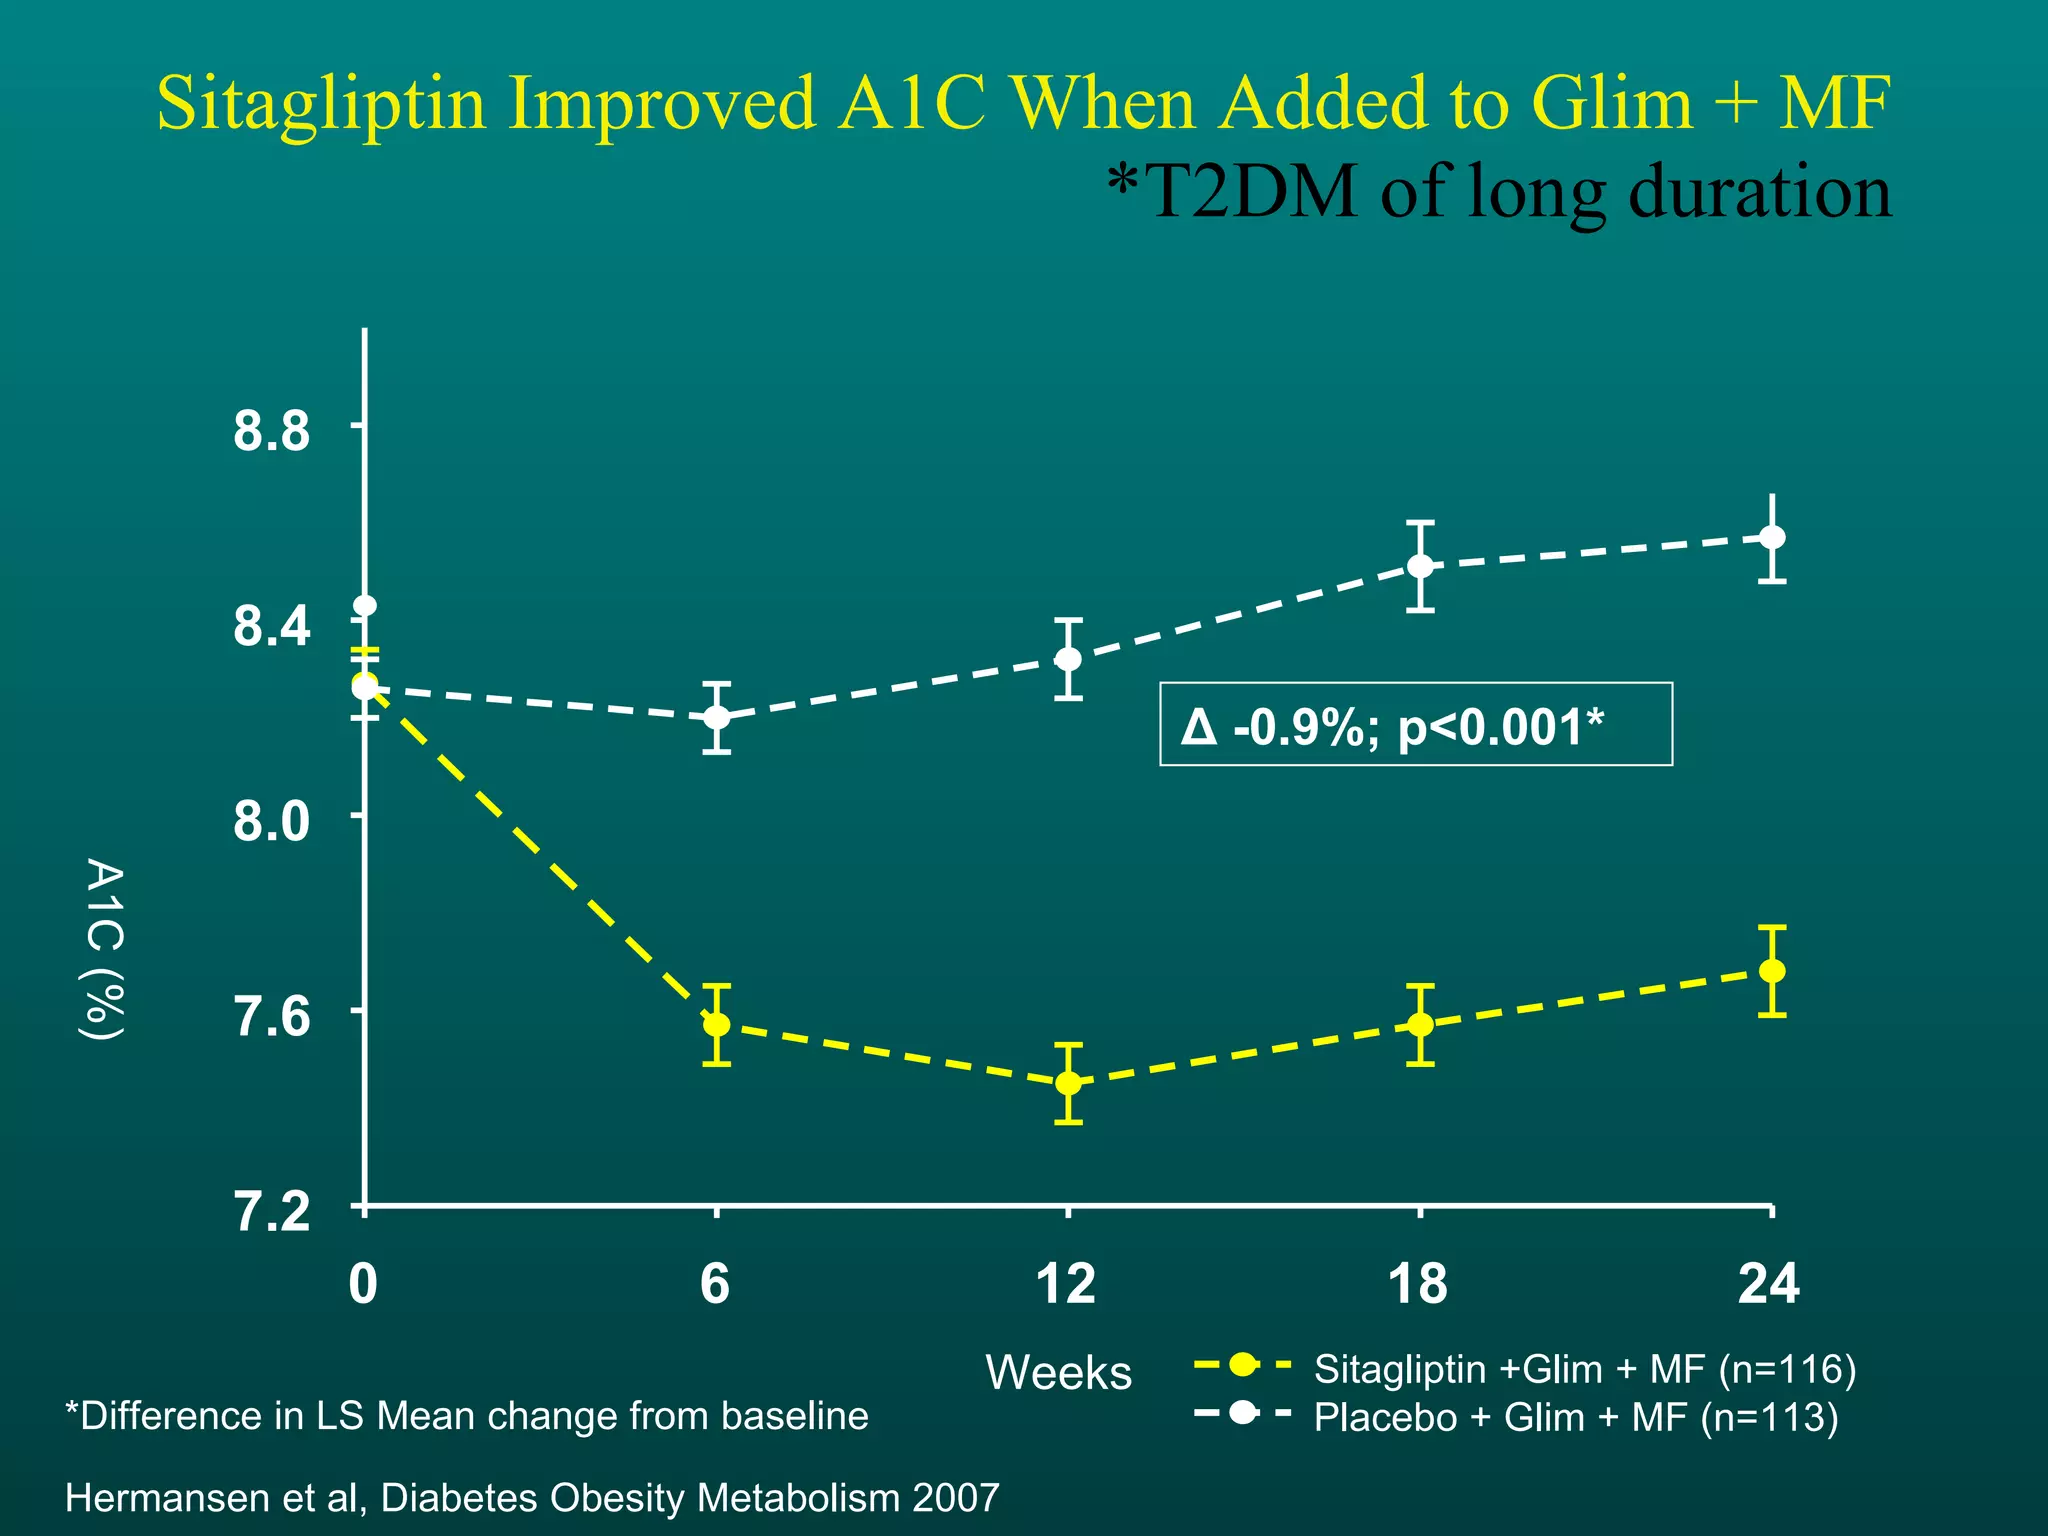
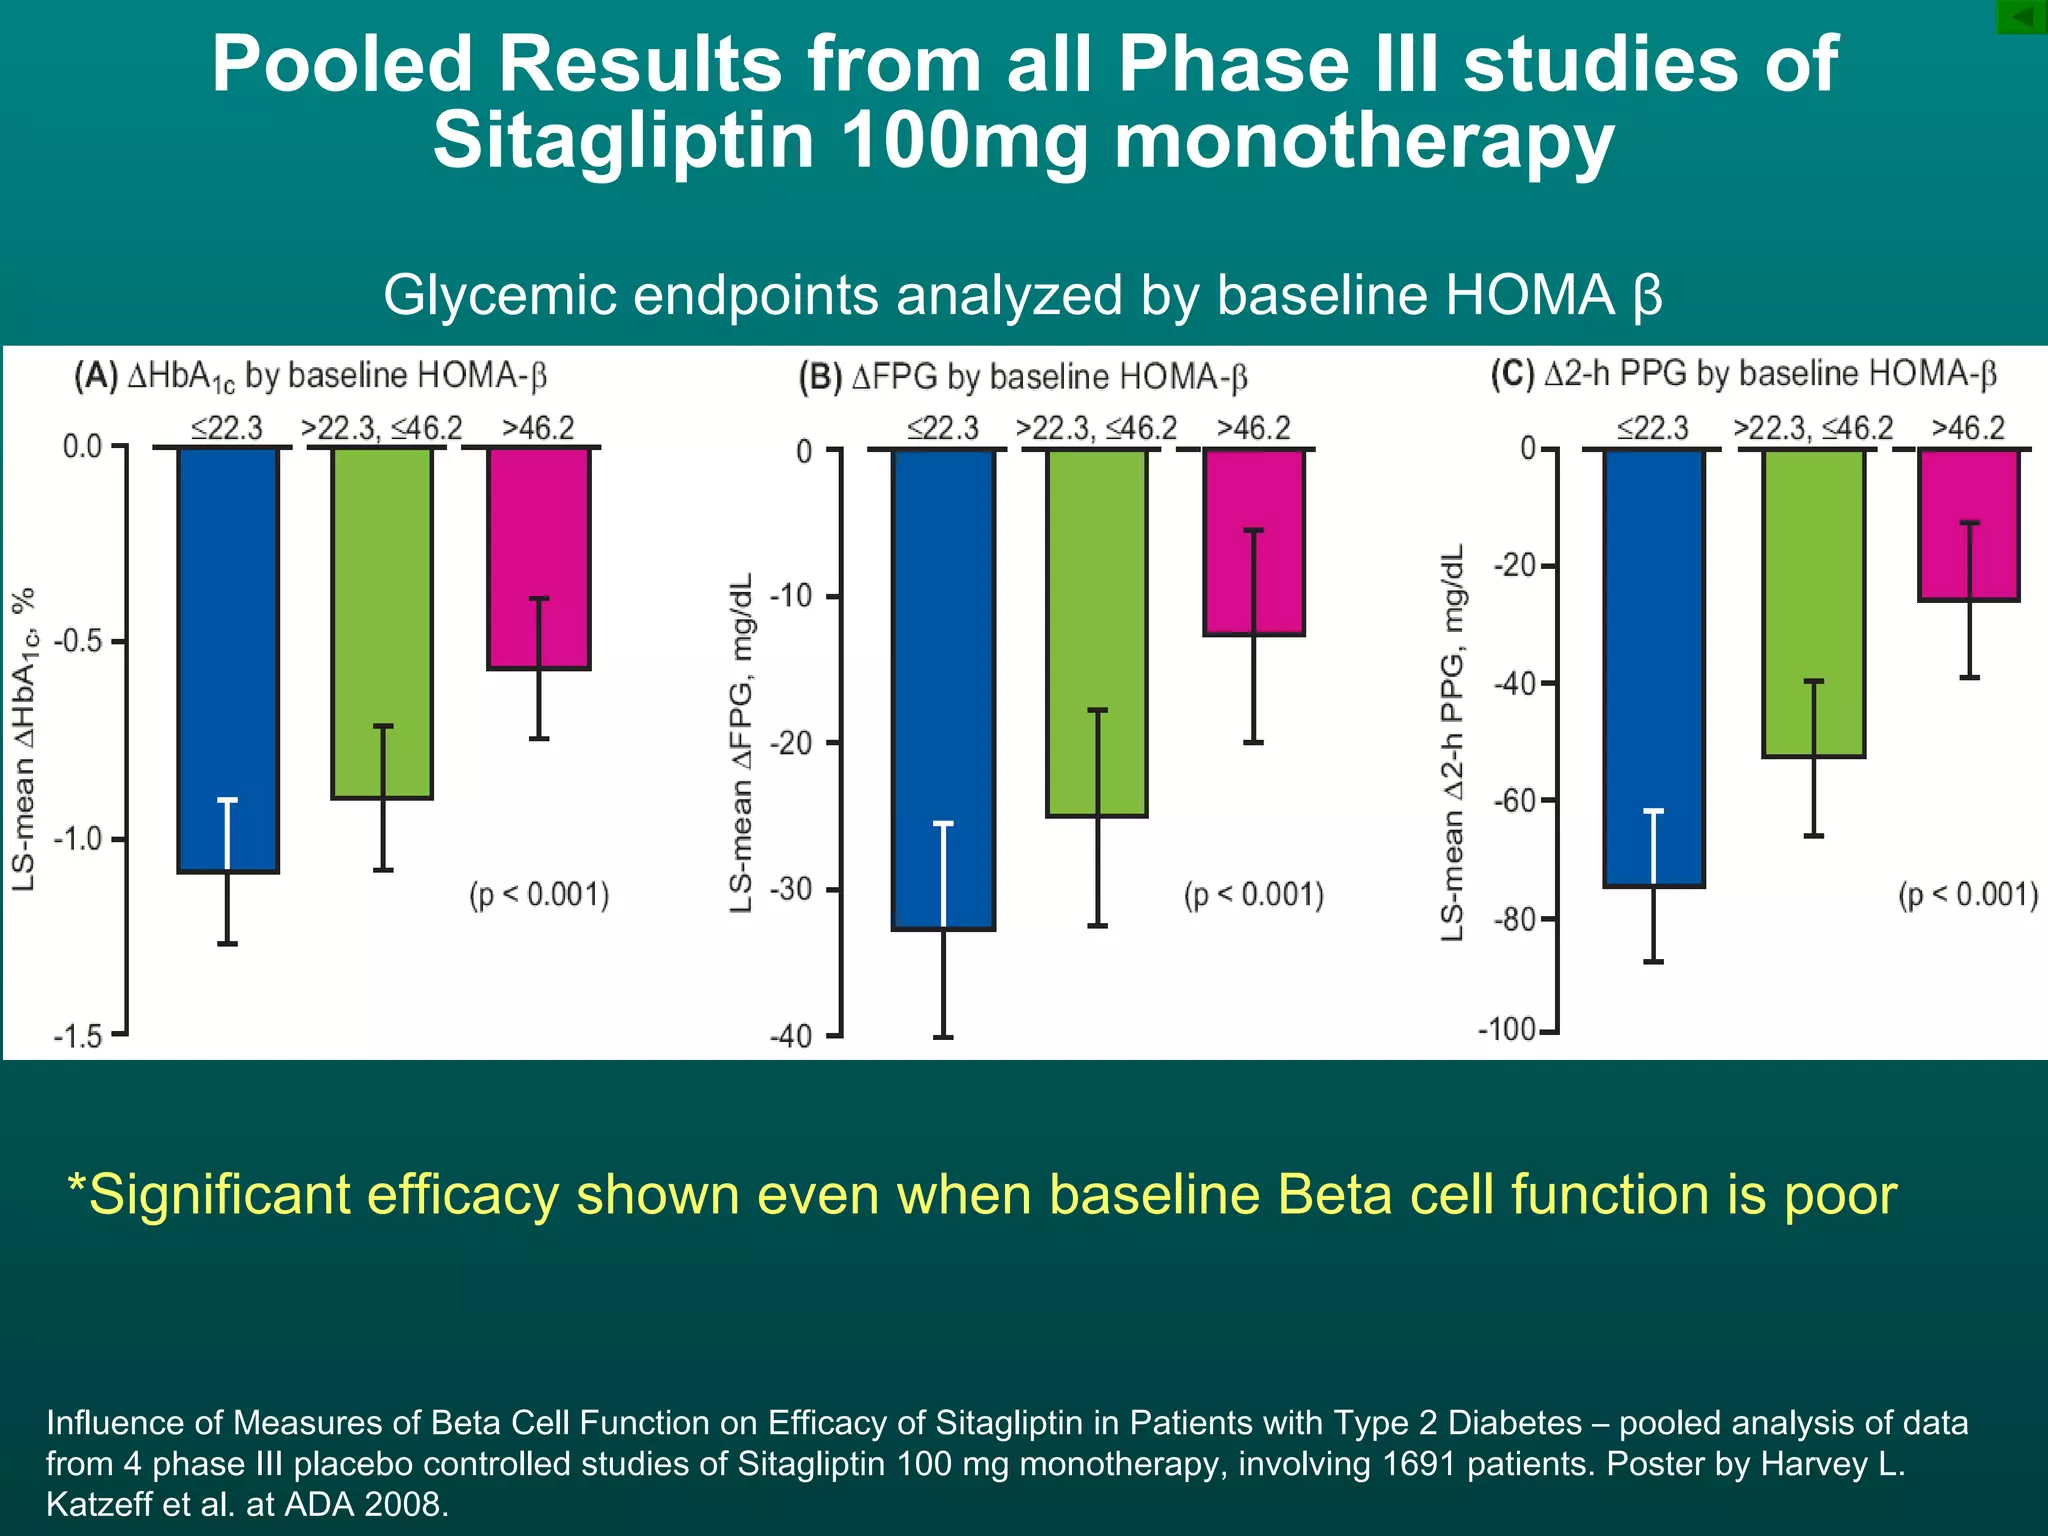
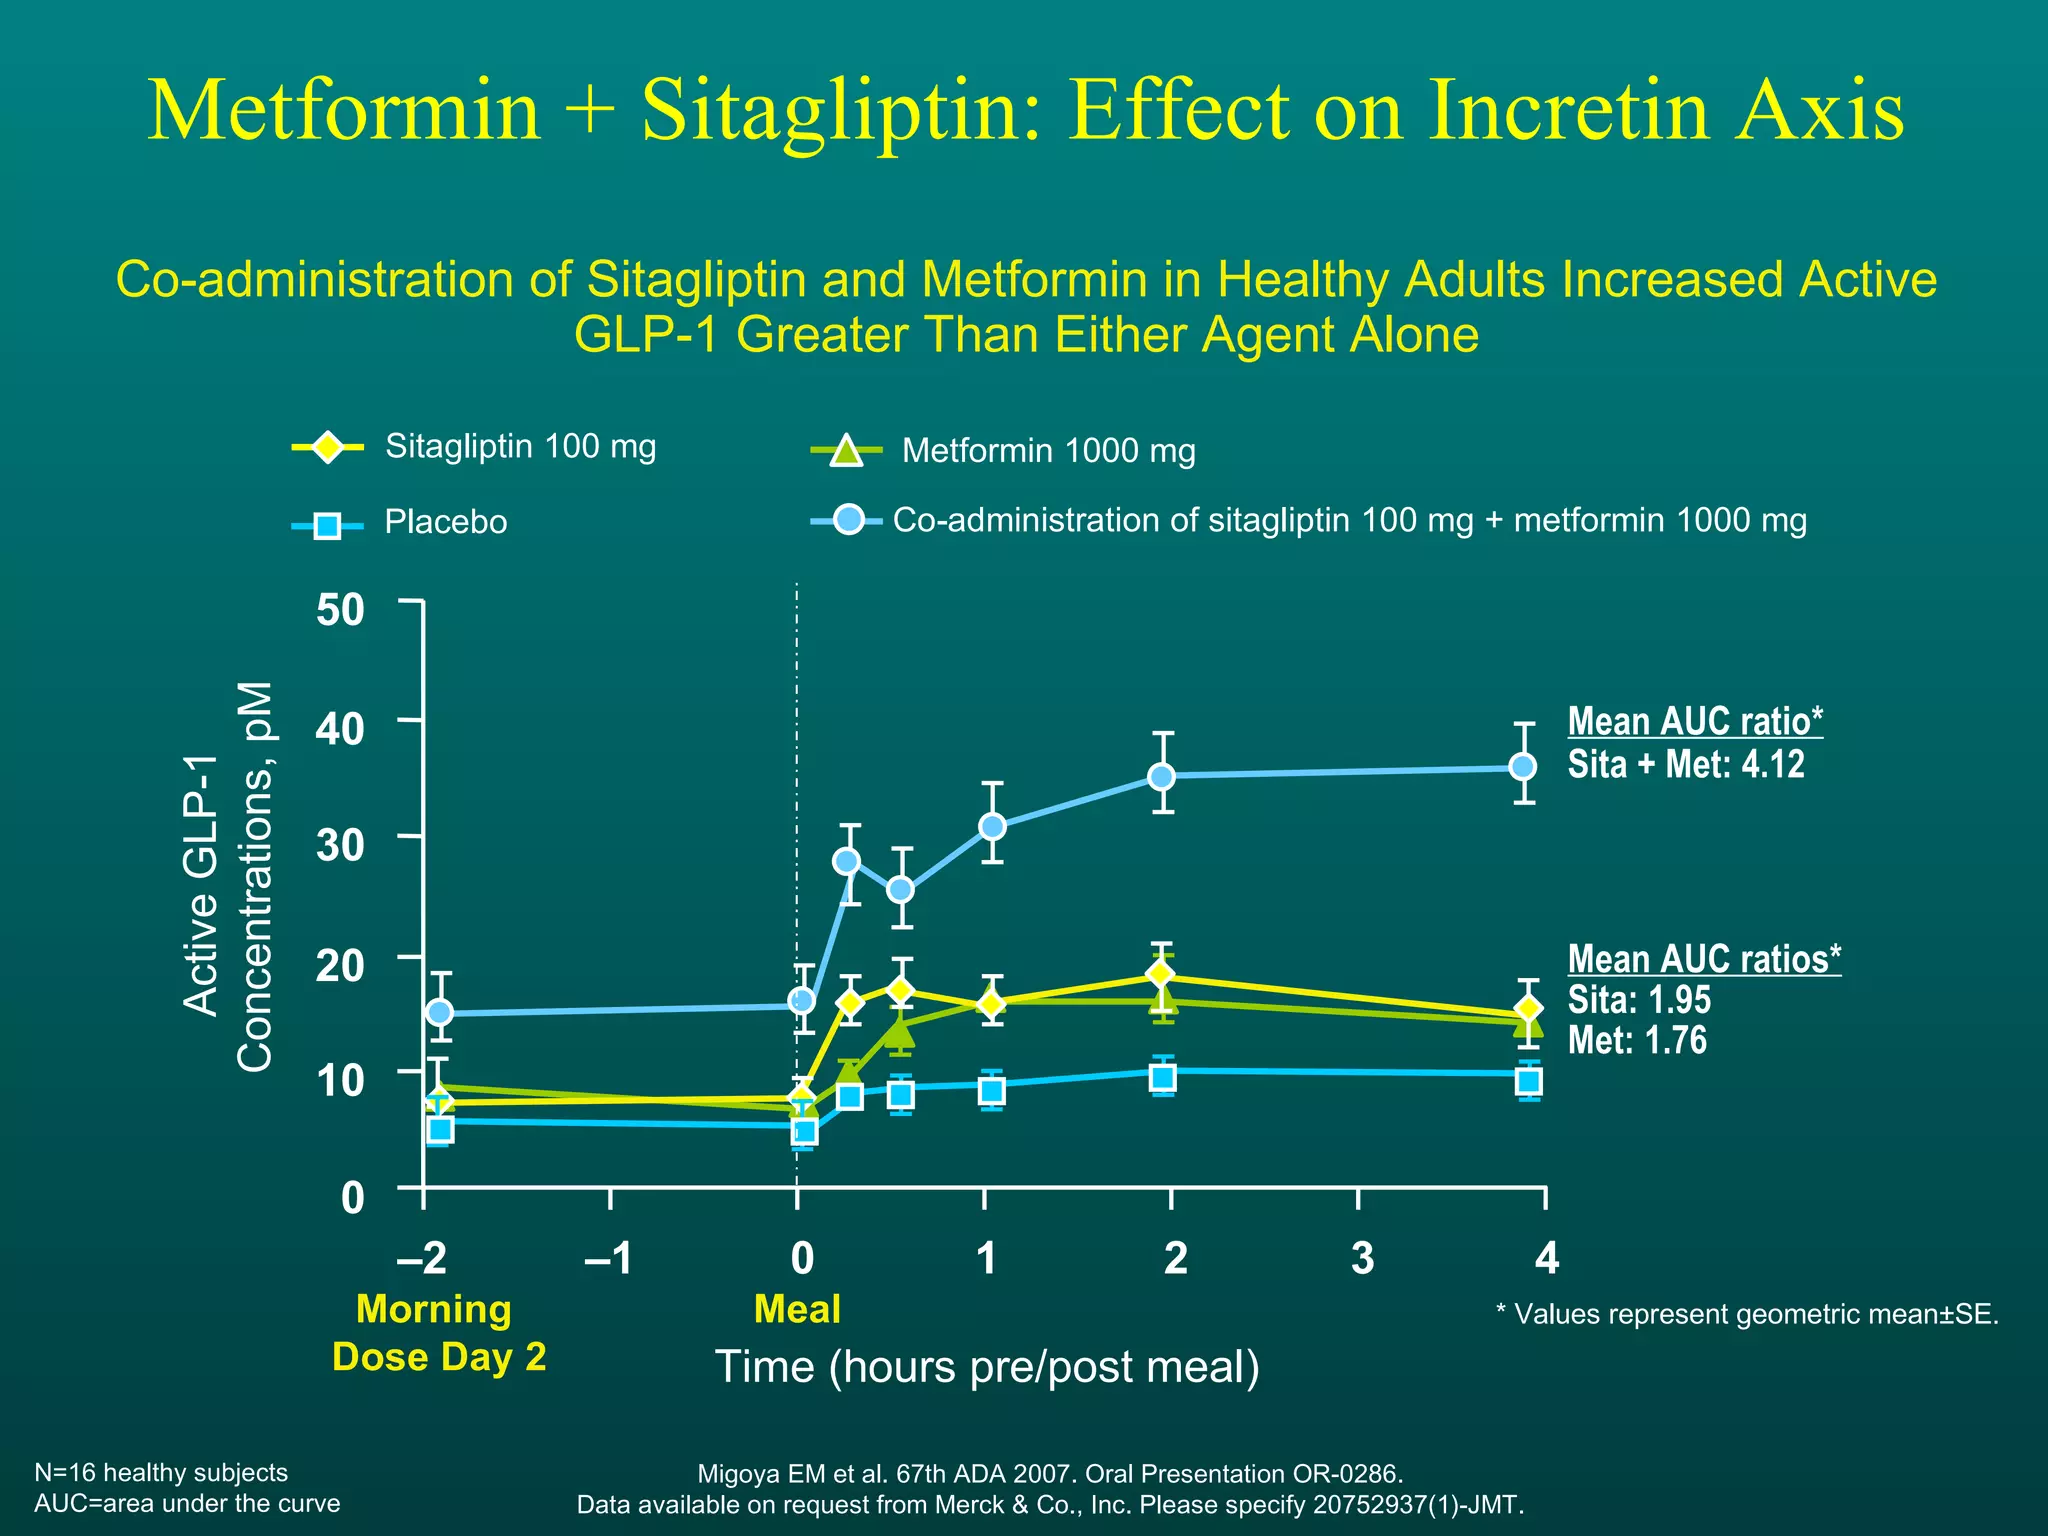
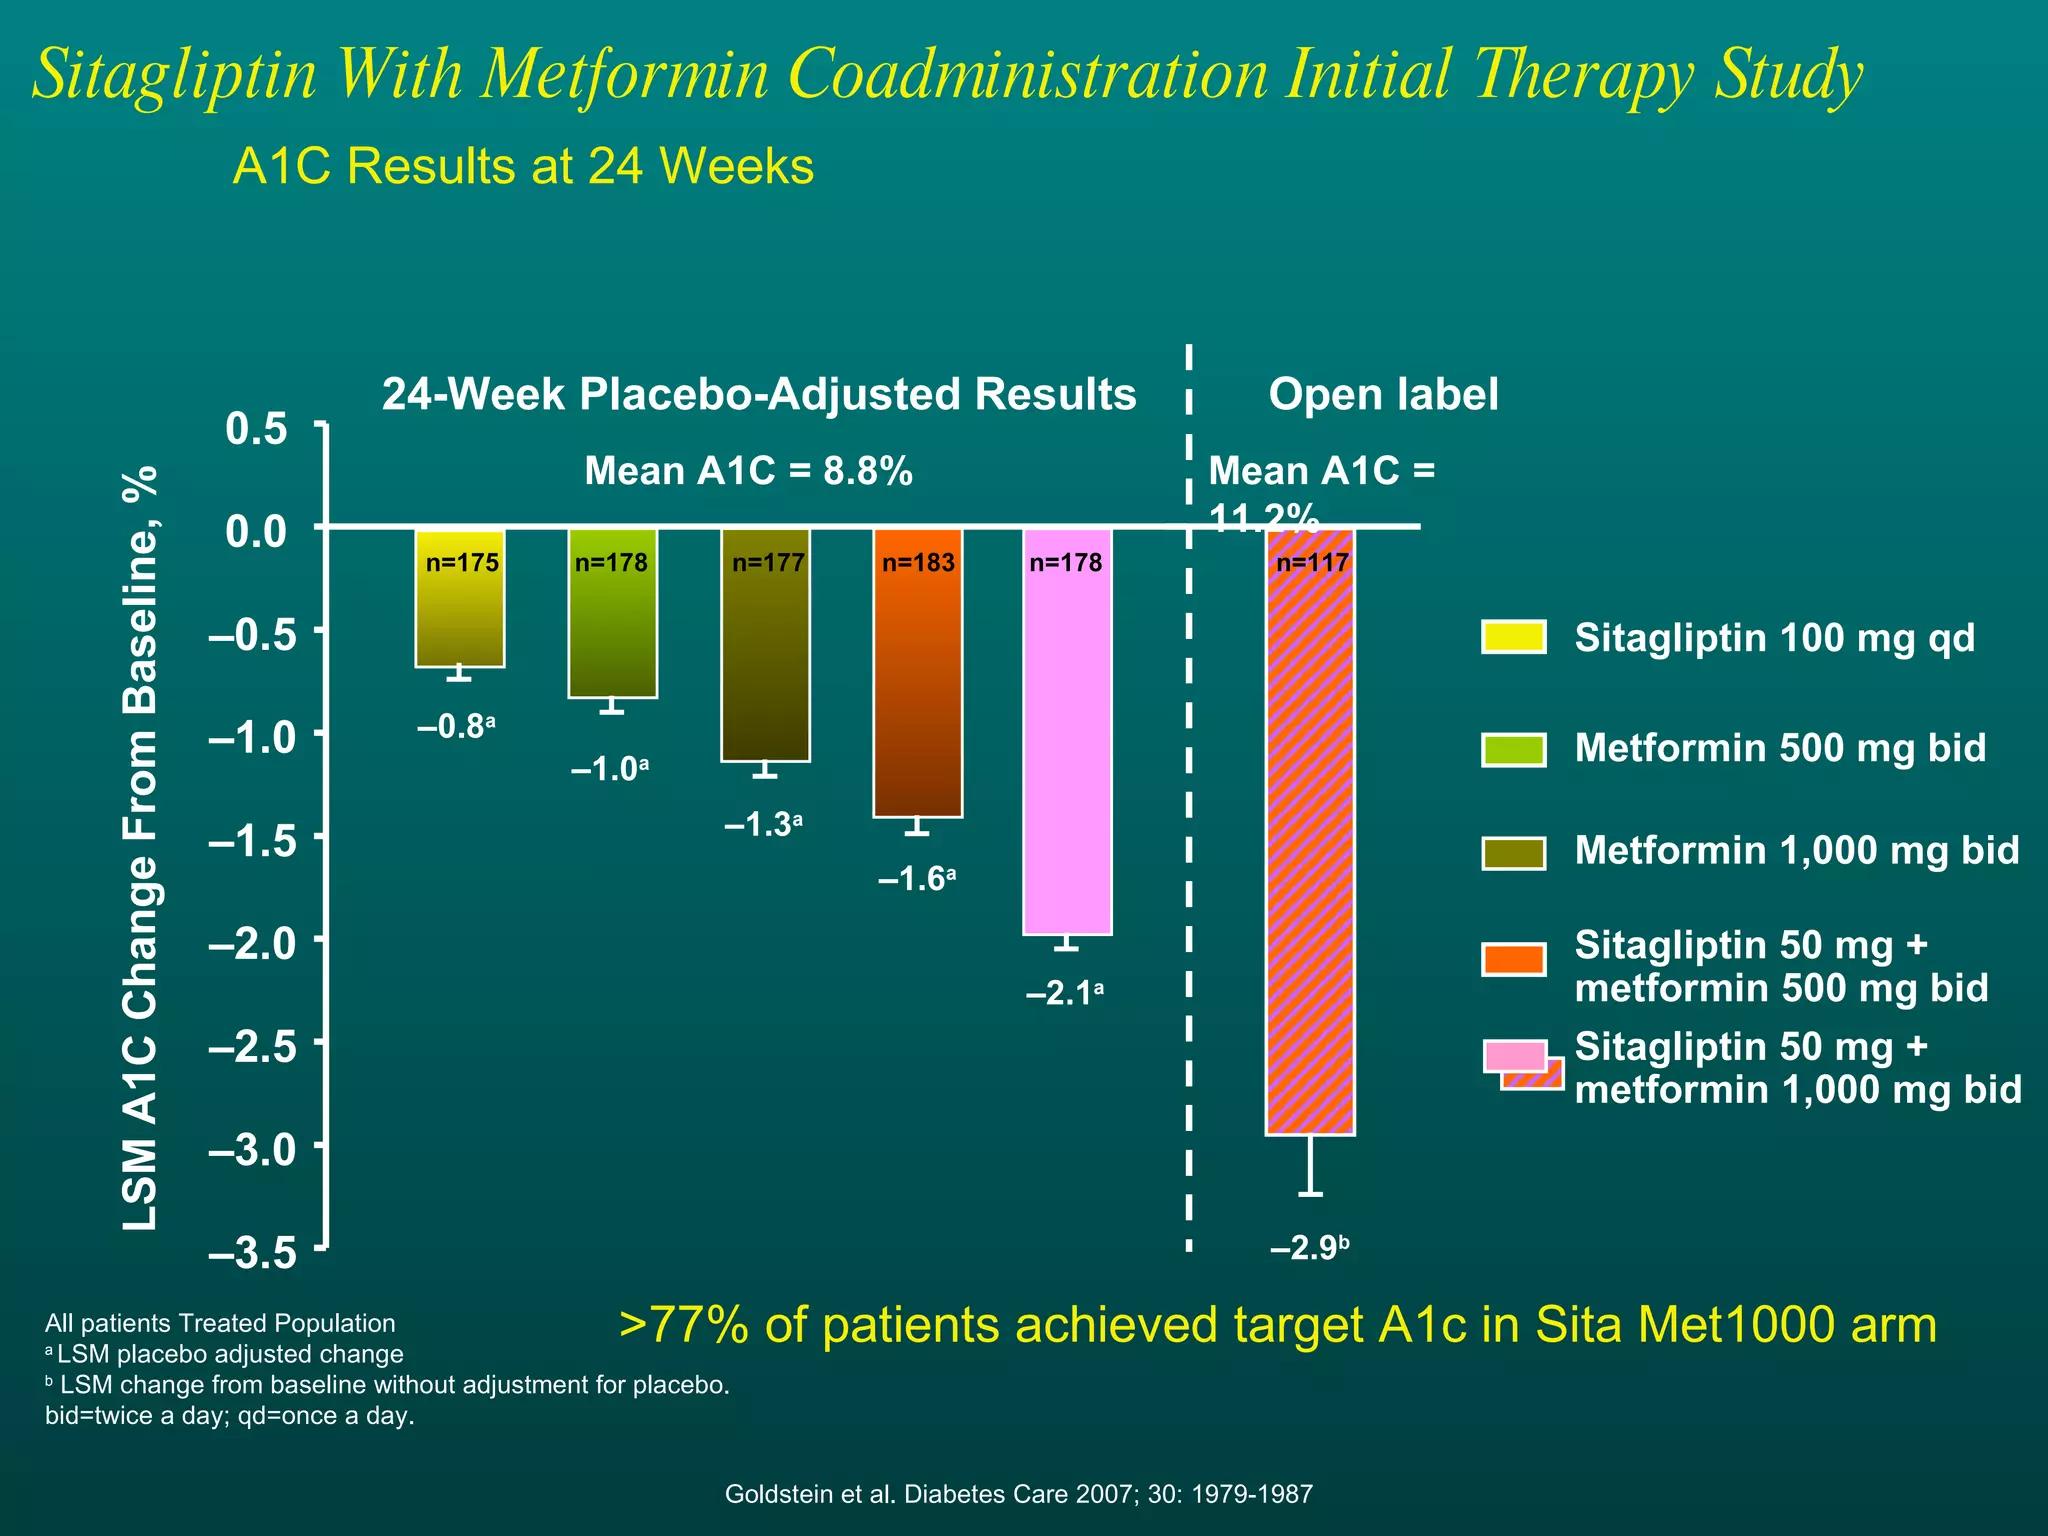
The document discusses the role of DPP-4 inhibition and sitagliptin in the management of type 2 diabetes. It provides evidence that sitagliptin increases active GLP-1 and GIP levels, resulting in improved glycemic control through increased insulin secretion, decreased glucagon levels, and reduced glucose levels. Studies show sitagliptin to be an effective monotherapy and when added to other oral medications, with benefits seen within days and a generally well-tolerated safety profile compared to sulfonylureas.


