Downloaded 1,771 times
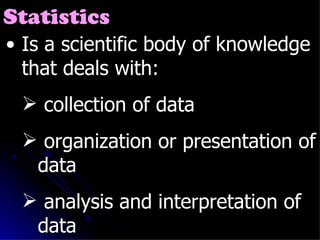


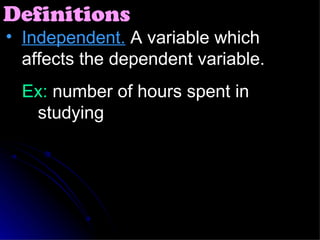


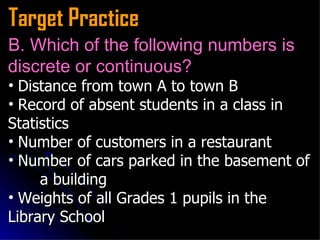


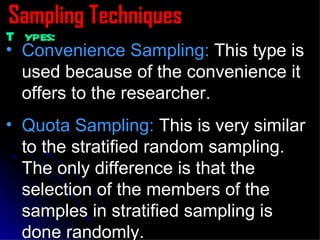


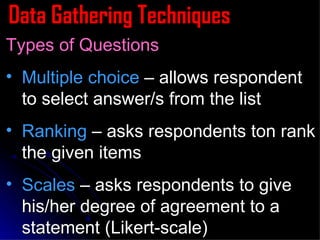


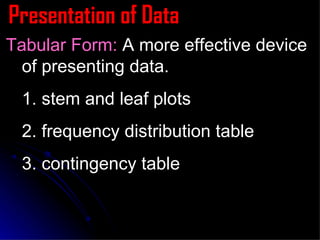


Statistics involves collecting, organizing, analyzing, and interpreting data. Descriptive statistics describe characteristics of a data set through measures like central tendency and variability. Inferential statistics draw conclusions about a population based on a sample. Key terms include population, sample, parameter, statistic, data types, levels of measurement, and sampling techniques like simple random sampling. Common data gathering methods are interviews, questionnaires, and registration records. Data can be presented textually, in tables, or graphically through charts, graphs, and maps.


