Downloaded 219 times


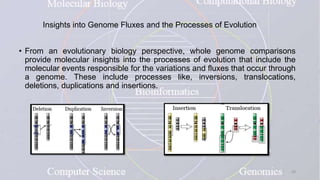
![Comparative Genomics Tools
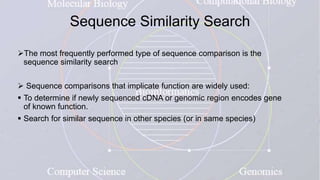
Similarity search programs
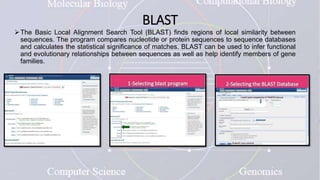
• BLAST2 (Basic Local Alignment Search Tool)
• FASTA
• MUMmer (Maximal Unique Match) (Comparisons and analyses at both
Nucleic acid and protein level)
Other alignment programs
• DBA [DNA Block Aligner]
• Blastz
• BLAT/AVID, – WABA [Wobble Aware Bulk Aligner]
• DIALIGN [Diagonal ALIGNment]
• SSAHA [Sequence Search and Alignment by Hashing Algorithm]](https://image.slidesharecdn.com/newwwanalysis-151230111839/85/genomic-comparison-7-320.jpg)
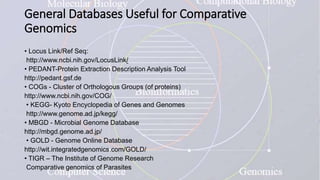
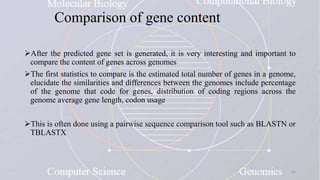
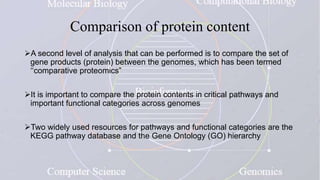
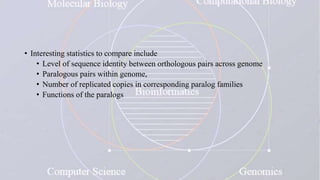
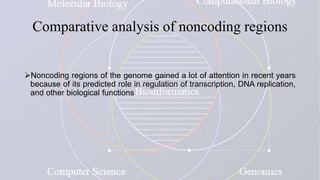

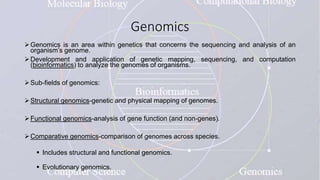
This document provides an overview of comparative genomics. It begins by defining genomics and its subfields, including comparative genomics which compares complete genome sequences across species. Tools for comparative genomics like BLAST and synteny are discussed. The history of comparative genomics from early virus comparisons to current eukaryote analyses is summarized. Methods for comparative analysis include examining genome structure, coding regions, protein content, and non-coding regions. General databases useful for comparative genomics are also listed.