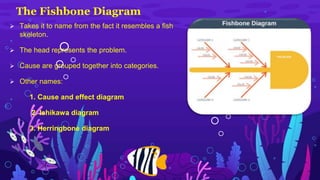
FISHBONE
Fishbone Diagram Overview
• Sometimes things go wrong.
• When complex things go wrong, a fishbone diagram can help you think
about and categorize all of the different factors that led to the issue.
• By doing this you’re more likely:
To find the root cause of the problem.
To resolve the problem the first time.
• A fishbone diagram can help you find the root cause of a problem.
The Fishbone Diagram
 Takes it to name from the fact it resembles a fish
skeleton.
 The head represents the problem.
 Cause are grouped together into categories.
 Other names:
1. Cause and effect diagram
2. Ishikawa diagram
3. Herringbone diagram
Fishbone Diagram Example
 Suppose you run a business selling products online and your website
unexpectedly crashes.
 You decide to use a fishbone diagram to perform a deep analysis of what
caused the crash.
 There are four steps to using a fishbone diagram
State the problem
Define your categories
Brainstorm each category
Analyze your result
01
State the Problem
02
Define you Categories
Define your initial categories.
These are not set in stone
and you can create or
remove categories later as
brainstorming causes your
thinking to develop.
Brainstorm each Category
03 As you brainstorm ideas, it can be useful to use a
technique called the 5 whys to help ensure
you have uncovered the true root cause of
rather than a superficial cause.
Example:
 Initial Cause: The website crashed because it
ran out of memory.
 Why? Because it was incorrectly configured.
 Why? Because the site admin made a
mistake.
 Why? Because development hadn’t provided
adequate instructions.
 Why? Because they assumed it was before.
Advantages and Disadvantages
Advantages
 Easy to understand
 Helps find the most likely cause of the problem.
 Can be applied to a range of problems.
 The whole team gains a better understanding of the issues.
Disadvantages
 Doesn’t help you prioritize causes.
 The output from brainstorming is only as good as your brainstorming session.
 Can become unwieldy to use.
 You may waste time discussing causes that have very little impact on the
problem.
Summary
 The fishbone diagram was developed in the 1960s.
 Provides a way to find the causes of a problem.
 Can be used in any industry and for many purposes.
 It also helps create a shared understanding of problems amongst your team
members.
FISHBONE.pptx

FISHBONE.pptx

  • 1.
  • 2.
    Fishbone Diagram Overview •Sometimes things go wrong. • When complex things go wrong, a fishbone diagram can help you think about and categorize all of the different factors that led to the issue. • By doing this you’re more likely: To find the root cause of the problem. To resolve the problem the first time. • A fishbone diagram can help you find the root cause of a problem.
  • 3.
    The Fishbone Diagram Takes it to name from the fact it resembles a fish skeleton.  The head represents the problem.  Cause are grouped together into categories.  Other names: 1. Cause and effect diagram 2. Ishikawa diagram 3. Herringbone diagram
  • 4.
    Fishbone Diagram Example Suppose you run a business selling products online and your website unexpectedly crashes.  You decide to use a fishbone diagram to perform a deep analysis of what caused the crash.  There are four steps to using a fishbone diagram State the problem Define your categories Brainstorm each category Analyze your result
  • 5.
  • 6.
    02 Define you Categories Defineyour initial categories. These are not set in stone and you can create or remove categories later as brainstorming causes your thinking to develop.
  • 7.
    Brainstorm each Category 03As you brainstorm ideas, it can be useful to use a technique called the 5 whys to help ensure you have uncovered the true root cause of rather than a superficial cause. Example:  Initial Cause: The website crashed because it ran out of memory.  Why? Because it was incorrectly configured.  Why? Because the site admin made a mistake.  Why? Because development hadn’t provided adequate instructions.  Why? Because they assumed it was before.
  • 8.
    Advantages and Disadvantages Advantages Easy to understand  Helps find the most likely cause of the problem.  Can be applied to a range of problems.  The whole team gains a better understanding of the issues. Disadvantages  Doesn’t help you prioritize causes.  The output from brainstorming is only as good as your brainstorming session.  Can become unwieldy to use.  You may waste time discussing causes that have very little impact on the problem.
  • 9.
    Summary  The fishbonediagram was developed in the 1960s.  Provides a way to find the causes of a problem.  Can be used in any industry and for many purposes.  It also helps create a shared understanding of problems amongst your team members.