Downloaded 95 times


![[Webinar Deck] Google Data Studio for Mastering the Art of Data Visualizations](https://image.slidesharecdn.com/webinardeckgoogledatastudioformasteringtheartofdatavisualizations-170830111718/85/Webinar-Deck-Google-Data-Studio-for-Mastering-the-Art-of-Data-Visualizations-37-320.jpg)

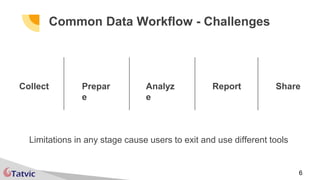
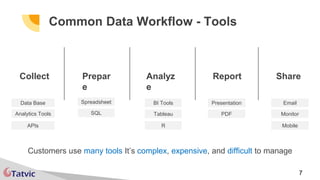
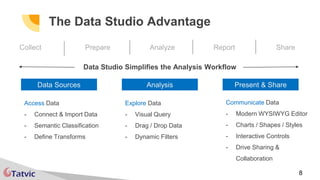
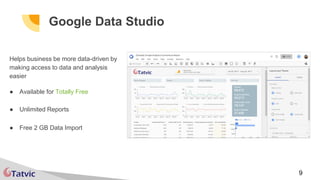
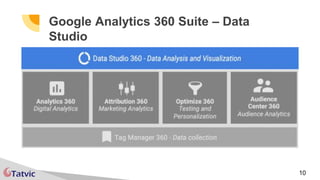
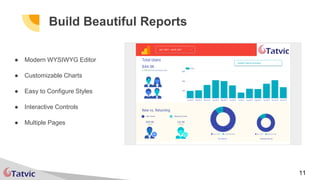
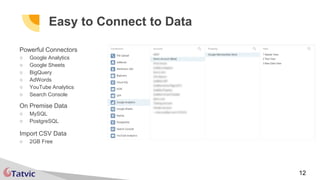
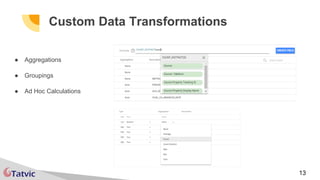
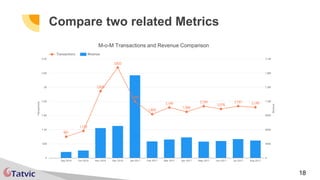
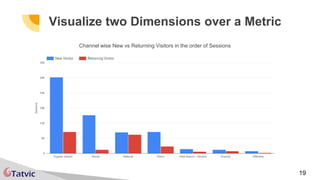
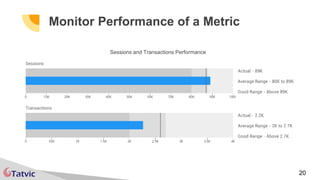
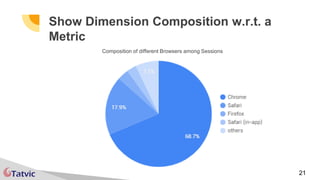
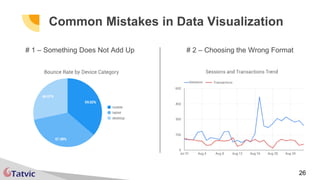
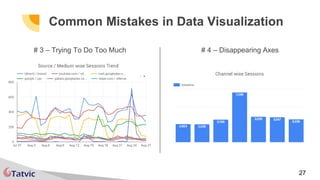
The document outlines a presentation on Google Data Studio, emphasizing its advantages for data visualization and the challenges users face in data workflows. It highlights key features such as easy connectivity to various data sources, customizable reports, and common mistakes in data visualization. The agenda includes an introduction, live demo, and examples of report types, along with details on an upcoming webinar.


![[Webinar] 3 Reasons Why Digital Publishers Should Integrate DFP with Google A...](https://cdn.slidesharecdn.com/ss_thumbnails/webinarintegratedfpwithga-180529112459-thumbnail.jpg?width=640&height=640&fit=bounds)

![[Webinar] Interacting with BigQuery and Working with Advanced Queries](https://cdn.slidesharecdn.com/ss_thumbnails/webinarinteractingwithbigqueryandworkingwithadvancedqueries-171206133544-thumbnail.jpg?width=640&height=640&fit=bounds)
![[Webinar] Getting Started with BigQuery: Basics, Its Appilcations & Use Cases](https://cdn.slidesharecdn.com/ss_thumbnails/webinargettingstartedwithbigquery-171116122740-thumbnail.jpg?width=640&height=640&fit=bounds)


![[Webinar] Deep Dive in App Analytics](https://cdn.slidesharecdn.com/ss_thumbnails/webinardeepdiveinappanalytics-170818085631-thumbnail.jpg?width=640&height=640&fit=bounds)
![[Webinar] Predict Your App Uninstalls and Prevent your Churning Users using M...](https://cdn.slidesharecdn.com/ss_thumbnails/webinarpredictyourappuninstalls-170621100059-thumbnail.jpg?width=640&height=640&fit=bounds)


