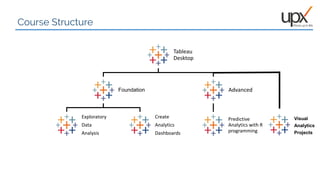
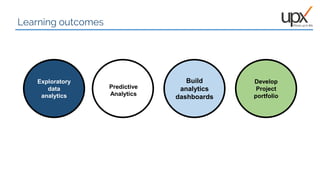
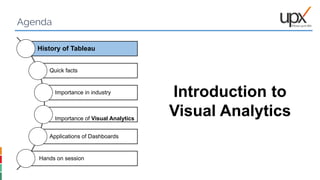
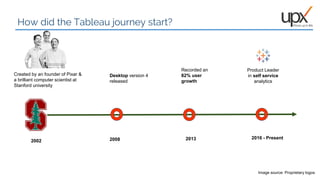
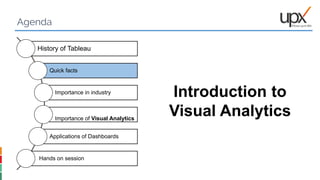
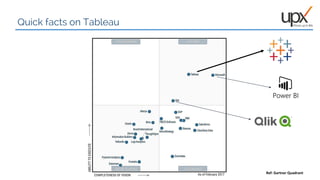
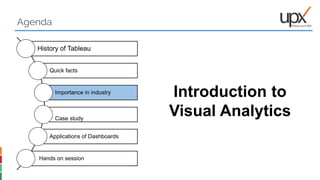
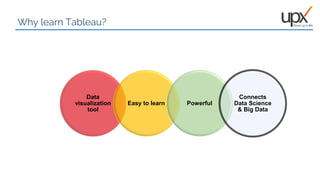
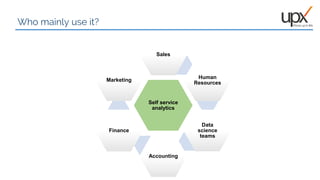
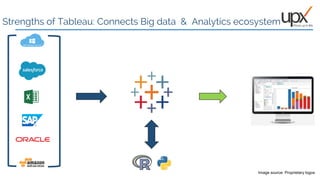
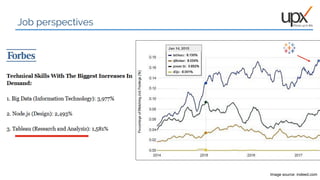
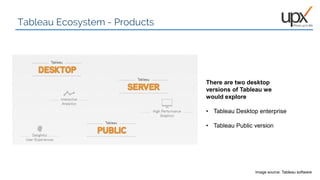
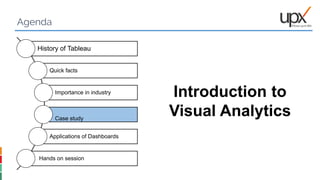
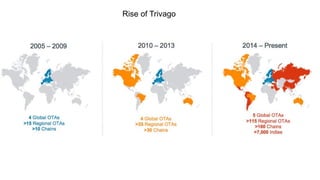
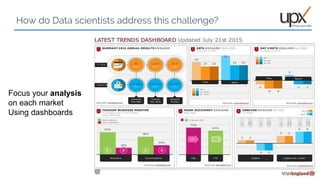
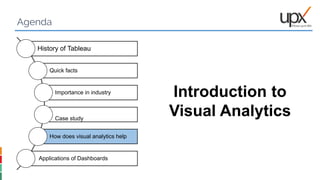
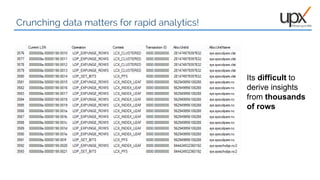
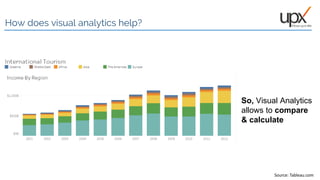
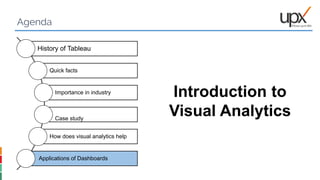
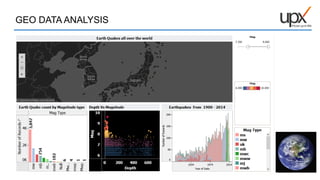
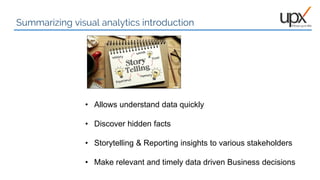
This document provides an overview of a visual analytics course using Tableau. The course structure includes modules on Tableau Desktop foundations, exploratory data analysis, creating analytics dashboards, advanced predictive analytics with R programming, and completing visual analytics projects. Learners will gain skills in exploratory data analytics, building dashboards, predictive analytics, and developing a project portfolio. Case studies will cover topics like geo-data analysis, customer segmentation, and price index analysis. The importance of visual analytics and Tableau for industries like sales, marketing, and finance is also discussed.


![Data first with Tableau [FutureStack16]](https://cdn.slidesharecdn.com/ss_thumbnails/datafirsttableau-161201204510-thumbnail.jpg?width=640&height=640&fit=bounds)


![[Webinar Deck] Google Data Studio for Mastering the Art of Data Visualizations](https://cdn.slidesharecdn.com/ss_thumbnails/webinardeckgoogledatastudioformasteringtheartofdatavisualizations-170830111718-thumbnail.jpg?width=640&height=640&fit=bounds)


![[DSC Europe 25] Milos Belcevic - Product Professional's Journey to Full-Stack...](https://cdn.slidesharecdn.com/ss_thumbnails/1zovd6fgsycdg4wvgvls-milos-belcevic-product-professionals-journey-to-full-stack-product-developer-260123083019-d993120d-thumbnail.jpg?width=640&height=640&fit=bounds)
![[DSC Europe 25] Mikhail Rozhkov - AI Product Canvas: From Business Goals to T...](https://cdn.slidesharecdn.com/ss_thumbnails/d53doddtpgfqivmzqel6-mikhail-rozhkov-ai-product-canvas-v1-260121115910-9dd517a7-thumbnail.jpg?width=640&height=640&fit=bounds)

![[DSC Europe 25] Laila Kakar - Leveraging AI for Strategic Excellence: Enhanci...](https://cdn.slidesharecdn.com/ss_thumbnails/eykmhrtsqmaaftwkexh7-dsc-lailakakar-1-260119101520-5f3b5616-thumbnail.jpg?width=640&height=640&fit=bounds)

![[DSC Europe 25] Borko Kozomora - Optimizing business workflows with advances ...](https://cdn.slidesharecdn.com/ss_thumbnails/hbgekyb0txw0xpo4yfml-borko-kozomora-leading-ai-transformation-260122103838-cc29ee38-thumbnail.jpg?width=640&height=640&fit=bounds)


![[DSC Europe 25] Harshvardhan Jain - From Pre-Trained to Purpose-Built: Fine-T...](https://cdn.slidesharecdn.com/ss_thumbnails/zru4zmiseku5tgvu2dgw-harshvardhan-jain-from-pre-trained-to-purpose-built-fine-tuning-llms-for-high-i-260119101520-8335585f-thumbnail.jpg?width=640&height=640&fit=bounds)


![[DSC Europe 25] Srdj Stanisic - Local and Private AI in UX.pdf](https://cdn.slidesharecdn.com/ss_thumbnails/vwmetykqmztgmokmmkfa-3-srdjan-stanisic-local-and-small-ai-in-ux-260120105855-55a31869-thumbnail.jpg?width=640&height=640&fit=bounds)


