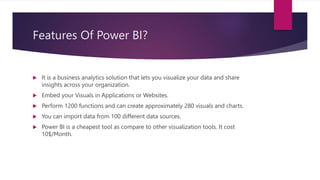
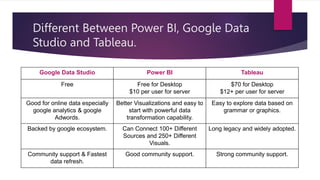
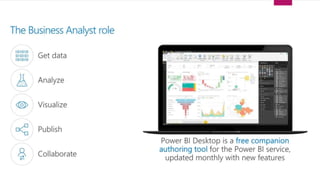
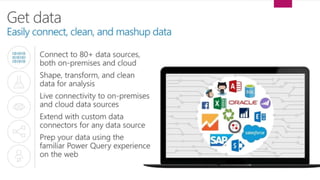
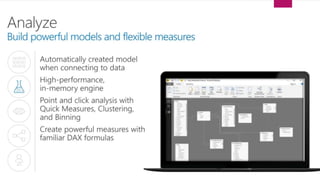
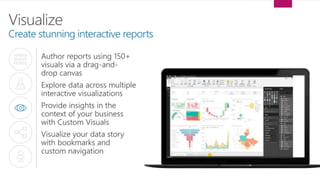
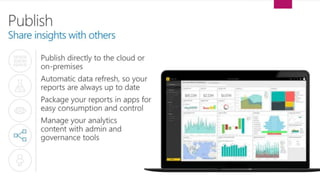
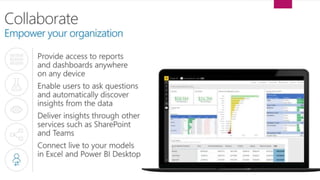
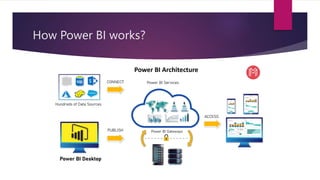
Power BI is a business intelligence tool from Microsoft that allows users to analyze data, clean it, and visualize it in interactive reports and dashboards. It includes several components like Power Query for data transformation, Power Pivot for data modeling, and Power View for data visualization. Power BI Desktop is used to create reports locally, while Power BI Service hosts reports and dashboards in the cloud. It supports connecting to over 100 data sources and creating over 250 visualizations to provide insights from data.
2. What is Business Intelligence?
BI(Business Intelligence) is a set of processes, architectures, and technologies that
convert raw data into meaningful information that drives profitable business
actions.
Business Intelligence (BI) is a combination of business analytics, data mining, data
visualization, data tools and best practices to help organizations make more data-
driven decisions.
3. What is Microsoft Power BI?
Power BI is an interactive data visualization software product.
Developed by Microsoft with a primary focus on business intelligence. It is part of
the Microsoft Power Platform.
It is a Business Intelligence tool which will help you to Analyse your data to Clean
your data and Convert your data into visual format.
Power BI is a collection of components.
Example:- Power Query, Power Pivot, Power View, Power BI Desktop, Power BI
Gateway, Power BI Mobile Apps and Power BI Service.
4. What is Power Query?
Power Query is a data transformation and data preparation engine.
Power Query is an ETL tool (Extract Transfer Load).
A Power query helps you to clean, summarize and filter data in a table.
Perform calculations.
5. What is Power Pivot?
Power Pivot is a data modeling technology that lets you create data models,
establish relationships, and create calculations.
With Power Pivot you can work with large data sets, build extensive relationships,
and create complex (or simple) calculations, all in a high-performance
environment.
6. What is Power View?
Power View is a data visualization technology that lets you create interactive
charts, graphs, maps, and other visuals.
Power View is available in Excel, in SharePoint, SQL Server, and Power BI.
7. What is Power BI Desktop?
This is used to create reports and data visualizations on the dataset.
8. What is Power BI Gateway?
You can use Power BI on-premises gateway to keep your data fresh by connecting
to your on-premises data sources without the need to move the data. It allows you
to query large datasets and benefit from the existing investments.
9. What is Power BI Apps?
Using Power BI mobile apps, you can stay connected to their data from anywhere.
Power BI apps are available for Windows, iOS, and Android platform.
10. What is Power BI service?
Power BI Service(powerbi.com) is an online service hosted on azure cloud where
you can show your dashboardreport and share with your group member.
11. Difference Between Power BI Desktop and
Power BI Service.
Power BI Desktop
The desktop allows you to connect to
different types of data sources and then
transform it in a data model.
A Windows desktop application called
Power BI Desktop.
Multiple Data Sources.
More Features.
Power BI Service
The Power BI Service is the cloud-based
service where users view and interact with
the reports.
An online SaaS service is called the Power
BI service.
Limited Data Sources.
Less Features as Compared to Power BI
Desktop.
12. Features Of Power BI?
It is a business analytics solution that lets you visualize your data and share
insights across your organization.
Embed your Visuals in Applications or Websites.
Perform 1200 functions and can create approximately 280 visuals and charts.
You can import data from 100 different data sources.
Power BI is a cheapest tool as compare to other visualization tools. It cost
10$/Month.
13. Different Between Power BI, Google Data
Studio and Tableau.
Google Data Studio Power BI Tableau
Free Free for Desktop
$10 per user for server
$70 for Desktop
$12+ per user for server
Good for online data especially
google analytics & google
Adwords.
Better Visualizations and easy to
start with powerful data
transformation capability.
Easy to explore data based on
grammar or graphics.
Backed by google ecosystem. Can Connect 100+ Different
Sources and 250+ Different
Visuals.
Long legacy and widely adopted.
Community support & Fastest
data refresh.
Good community support. Strong community support.
25. Easy To Get Started.
Microsoft Power BI
https://powerbi.microsoft.com/en-us/desktop/
(OR)
Download it from Windows Microsoft Store
Benefits from continuous updates and community-driven innovation.
Streamlined for no-codes advanced analytics.
Built-in intelligence to speed up your analysis.
Automatic updates from windows store.