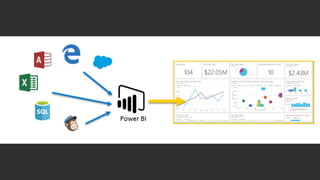
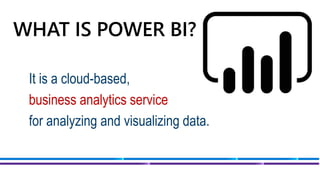
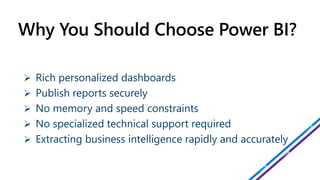
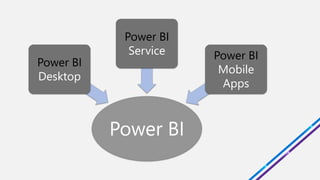
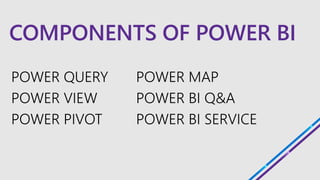
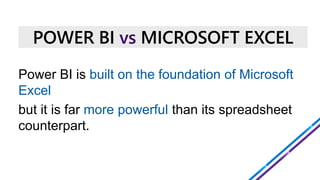
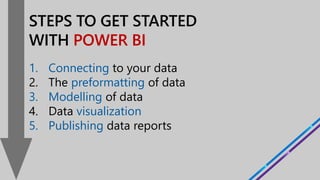
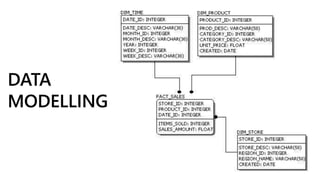
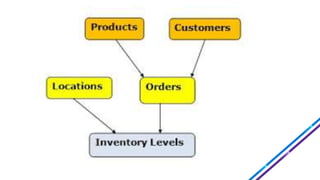
This document provides an introduction to Power BI, a business intelligence tool for data visualization. It discusses how Power BI helps organizations make more data-driven decisions by combining business analytics, data mining, visualization and infrastructure. Key features of Power BI include rich dashboards, report publishing, no constraints on memory or speed, and no need for technical support. Power BI consists of desktop, service and mobile app components and allows users to connect to data, model and format it, create visualizations, and publish reports.
Get technically equipped to grow and build your Power BI (Business Intelligence) practice, enabling you to offer new solutions and services to customers. With Power BI, you can transform your customers' data into rich visuals they can collect and organize, helping them focus on what matters most to their businesses.
Introduction to Power BI to make smart decisionsVIVEK GURURANI
Power BI: Business intelligence like never before!
Power BI is a tool that allows accounting and finance managers and professionals to have relevant information at the right time to make strategic decisions in a flexible, centralized, and secure way. Transform your business with predictive analytics, data visualization, and information in real-time, thanks to Power BI.
Presentation Agenda:
1. Introduction to Power BI
2. Why would your business need Power BI?
3. Power BI Architecture
4. Data Sanitization & Cleansing Capabilities
5. Analytical Insights
6. Generating Department Wise Reports & Visualizations
7. Latest & Upcoming Power BI features
8. Live Q&A
Explain about power BI Overview from Power BI Desktop, Power BI Service, Power BI Report Server and Power BI Mobile that consume all BI Data from Dataset and datamodel
A simplified version of my presentation:
- PowerBI solution architecture
- Key steps to visualize data in PowerBI
- PowerBI Demo
- R in PowerBI
- Custom Visuals
- PowerBI Report Server
- Azure services and Power BI
The presentation discusses the different aspects of Power BI like Power BI for O365, Data Discovery, Data Analysis, Data Visualization & Power Maps, Natural Language Search etc.
Its a business analytics solution presented by Netwoven at the Microsoft Power BI workshop held on Oct 30th at SVC Microsoft, Mountain View.
45 mins presentation @ the MVP Cloud RoadShow on April 11, 2015
In preview and recently available in Canada, Power BI. Insights are hiding in your company's data - see the impact of bringing them into focus with Power BI. Let Power BI organize your data. See it all in one place and make better decisions. The metrics you need to run your business on a dashboard. Make confident decisions knowing everyone is on the same page.
Business intelligence dashboards and data visualizations serve as a launching point for better business decision making. Learn how you can leverage Power BI to easily build reports and dashboards with interactive visualizations.
Power BI Training | Getting Started with Power BI | Power BI Tutorial | Power...Edureka!
This Edureka tutorial on "Getting started with Power BI" will provide you the fundamental knowledge of Power BI. Below are the topics covered in this tutorial:
1. What is Self Service Business Intelligence?
2. Why Power BI?
3. What is Power BI?
4. Demo on Power BI
Slides for the Usergroup meeting for the Manchester Power BI User Group on June 27th, 2019.
Subject: Power BI for Developers about Power BI Embedded and Power BI Custom Visuals
Presented to The Ottawa IT Community Meetup Group (Ottawa SQL - PASS Chapter) on Thursday September 19
Powerful Self-Service BI in Excel 2013 - Data search and discovery with Power Query (formerly "Data Explorer"), analyzing and modeling with Power Pivot, visualizing and exploring with Power View and Power Map (formerly codename "GeoFlow")
What is Microsoft Power BI and what are its benefits. how we can Analyse data with the help of power BI. Power BI A Microsoft Business Intelligence and Data Analysis tool.
What Is Power BI? | Introduction To Microsoft Power BI | Power BI Training | ...Edureka!
( Power BI Training - https://www.edureka.co/power-bi-training )
This Edureka "What Is Power BI?" tutorial will help you an introduction to Power BI. This video helps you to learn the following topics:
1. Why Power BI?
2. What Is Power BI?
3. Who Use Power BI?
4. Components Of Power BI
5. Building Blocks Of Power BI
Check out our Power BI Playlist: https://goo.gl/97sJv1
Power BI Tutorial For Beginners | Power BI Tutorial | Power BI Demo | Power B...Edureka!
( Power BI Training - https://www.edureka.co/power-bi-training )
This Edureka videoon "Power BI Tutorial" will provide you with the fundamental knowledge on Power BI (Blog: https://goo.gl/uFTDU3). Below are the topics covered in this tutorial:
1. Why do we need Business Intelligence?
2. What is Self Service Business Intelligence?
3. Why Power BI?
4. What is Power BI?
5. Demo: Report and Dashboard Creation
Power BI Desktop | Power BI Tutorial | Power BI Training | EdurekaEdureka!
This Edureka "Power BI Desktop" tutorial will help you to understand what is Power BI Desktop with examples and demo. Below are the topics covered in this tutorial:
1. Why Power BI?
2. What Power BI?
3. Who use Power BI?
4. Flow of Work
5. Power BI Trends
Power BI is a business analytics service by Microsoft. It aims to provide interactive visualizations and business intelligence capabilities with an interface simple enough for end users to create their own reports and dashboards.
This presentation will give you an overview of what Microsoft Power BI is. What are its features. Why it is an upcoming popular Data Visualization tool in the market. How to use it and comparison with other Visualization tools.
Power BI is a business analytics service that enables you to see all of your data through a single pane of glass. Live Power BI dashboards and reports...
Power BI has in its DNA the goal of enabling everybody to experience their data any way, anywhere—in seconds and at global scale.
Power BI offers a set of capabilities that are uniquely enabled by its global and cloud nature:
The ability to harness data from Excel spreadsheets, on-premises data sources through the data gateway, big data, streaming data, and cloud services. It doesn’t matter what type of data you want or where it lives, Power BI allows you to connect to hundreds of data sources.
Out-of-the box SaaS content packs that deliver a curated experience with pre-built dashboards to get you up and running quickly. We have hundreds of ISVs building content packs to cater to the needs of millions of Power BI users.
Unmatched, unique ways for users to experience their data with speed and agility:
Live dashboards that maintain a real-time pulse on the business and provide critical insights.
Natural language query that enables users to simply and intuitively ask questions of their data, including through Cortana.
Custom visuals that bring data to life and surface intelligence hidden in the sea of data, with our community leveraging the Power BI visualization stack to create new ways to visualize data in a way that makes more sense. (Now available in the Office store.)
Integration of Power BI with the Microsoft stack. Power BI is part of larger ecosystem that integrates with services like Microsoft Teams, Office 365, and Dynamics 365. These services are aware of Power BI, are wired to Power BI, and enable you to use Power BI in the context of your work.
Anywhere access to insights. Whether in the office or on-the-go, Power BI provides anywhere access to insights with dashboards accessible via the desktop, on the web, or across mobile devices. Inside Excel, embedded—we have hundreds of ISVs embedding Power BI in their offerings.
This slide deck explains in a comprehensive way what Power BI is, how the Power BI architecture looks like and what the usage scenarios are for using Power BI and related tools
Power BI Full Course | Power BI Tutorial for Beginners | EdurekaEdureka!
YouTube Link: https://youtu.be/3u7MQz1EyPY
** Power BI Training - https://www.edureka.co/power-bi-training **
This Edureka PPT on "Power BI Full Course" will help you understand and learn Power BI in detail. This Power BI Tutorial is ideal for both beginners as well as professionals who want to master up their Power BI concepts.
What is the Best Data Visualization Tool: Power BI or Tableau?Digital Dialogue
Business Intelligence (BI) is a vital field of computer science that involves a range of processes and technologies aimed at gathering, storing, analyzing, and providing access to data to enhance business decision-making. Read more here!
Power BI course in Chandigarh.pptx-presentationasmeerana605
Power BI is a collection of software services and apps that work together to turn your data into rich visualizations. You can pull data from simple spreadsheets, complex databases, and a vast array of cloud-based services, allowing you to consolidate information, and present it in clear, compelling ways.
BI: new of the buzz words that everyone is talking about but what is it? How can it be used to make a impact in my organization? How do I get started? This session was delivered for SharePoint Saturday Reston.
Power BI, a game-changer in data analytics, revolutionizes the way businesses interpret and leverage data. This Microsoft tool seamlessly integrates diverse data sources, offering dynamic visualizations and actionable insights. With user-friendly dashboards and real-time updates, Power BI empowers organizations to make informed decisions swiftly. Its intuitive interface facilitates even non-technical users in transforming raw data into meaningful narratives, fostering a data-driven culture. By simplifying complex analytics, Power BI enhances efficiency, accelerates decision-making, and propels businesses towards a new era of data-driven success.
Useful Link: Power BI, a game-changer in data analytics, revolutionizes the way businesses interpret and leverage data. This Microsoft tool seamlessly integrates diverse data sources, offering dynamic visualizations and actionable insights. With user-friendly dashboards and real-time updates, Power BI empowers organizations to make informed decisions swiftly. Its intuitive interface facilitates even non-technical users in transforming raw data into meaningful narratives, fostering a data-driven culture. By simplifying complex analytics, Power BI enhances efficiency, accelerates decision-making, and propels businesses towards a new era of data-driven success.
Useful Link:Power BI, a game-changer in data analytics, revolutionizes the way businesses interpret and leverage data. This Microsoft tool seamlessly integrates diverse data sources, offering dynamic visualizations and actionable insights. With user-friendly dashboards and real-time updates, Power BI empowers organizations to make informed decisions swiftly. Its intuitive interface facilitates even non-technical users in transforming raw data into meaningful narratives, fostering a data-driven culture. By simplifying complex analytics, Power BI enhances efficiency, accelerates decision-making, and propels businesses towards a new era of data-driven success.
Power BI: How to Implement Advanced Analytics with Data Integration?Kavika Roy
https://www.datatobiz.com/blog/advanced-analytics-with-data-integration/
SMEs are on the way to becoming data-driven enterprises by investing in data analytics and business intelligence. This move is to empower themselves to make better decisions based on reports generated by advanced data analytics tools.
Revamping the business systems and processes by integrating the latest AI, ML software allows enterprises to collect, store, process, and understand the vast amounts of data generated every day. Historical and real-time data from numerous sources is gathered in one place and processed using BI tools such as Power BI to gather valuable and accurate insights. In this blog, we will learn about the need for data integration and how Power BI can be used to implement advanced analytics with data integration.
This session will cover the enhancements and new features in SQL Server 2012 as Microsoft continues its roadmap with self-service BI. Topics include the changes that have been made to PowerPivot in Excel, as well as the new features. There will be a demo showing how PowerPivot models can be used in SharePoint along with Power View to provide self-service reporting capabilities to end-users. This session will also cover what Power View is, how it works, and what you can do with this new reporting feature that is part of SharePoint SSRS 2012 Integrated Mode.
During the bake-off (NYC Enterprise Collaboration Meetup in the NYC Microsoft Office) between Power BI and QlikView, Gal Vekselman presented the Power BI tool and those are his slides.
Join the professionals at BAASS as we answer your key quesons about Business Intelligence and how it can fit
within your business model. Dive deeper into how varying
soluons offered by our vendors can cater specifically to your business needs. Uncover technology that transforms raw data into meaningful and useful informaon for your key business funcons. You’ll hear from a wide range of
presenters and be able to uncover details regarding each of the following Business Intelligence Tools:
1. BAASS Business Intelligence
2. Sage Business Intelligence
3. Info Explorer
4. BI Metrix
5. Data Warehousing BI
Microsoft Power BI | Brief Introduction | PPTSophia Smith
What is Power BI?
Microsoft Power BI is one of the most powerful data visualization software. It empowers the organizations with their tools and help the users to transform their raw data into valuable information. Let's have a look on How Power BI helps to your business.
Power BI helps in managing and showcasing data and allows you to alter your data sets to highlight insights. It also facilitates creating and managing your data relationships for your company. It comes with various pre-built visual interfaces which help you in laying out your findings and visuals.
Interpersonal and soft skills assessment and developmentSwatiTripathi44
This ppt is about soft skills, interpersonal skills, conflict resolution, rapport building, etc. It is a crucial skill for people in every area they work.
What is culture? Sociology's perspective | Detailed DiscussionSwatiTripathi44
This ppt is about culture, its types, subculture, importance, characteristics, hippie movement, culture shock, counter-culture, etc. It is a university presentation under sociology subject.
Covid-19 : Emotional Well Being and Coping during CrisisSwatiTripathi44
This presentation is about how to cope and stay mentally healthy in time of pandemic caused by Covid-19. It was created as a behavioural science presentation for a university project.
This presentation is about the founder and CEO of OYO, Ritesh Agarwal. He is an inspiration for young generations especially in India who aspire to be successful entrepreneurs.
This presentation explains the difference between society and community. It is basic difference often asked in sociology. People often get confused and use society and community word interchangeably but there is a difference between these words which is well explained in the slides.
Adjusting primitives for graph : SHORT REPORT / NOTESSubhajit Sahu
Graph algorithms, like PageRank Compressed Sparse Row (CSR) is an adjacency-list based graph representation that is
Multiply with different modes (map)
1. Performance of sequential execution based vs OpenMP based vector multiply.
2. Comparing various launch configs for CUDA based vector multiply.
Sum with different storage types (reduce)
1. Performance of vector element sum using float vs bfloat16 as the storage type.
Sum with different modes (reduce)
1. Performance of sequential execution based vs OpenMP based vector element sum.
2. Performance of memcpy vs in-place based CUDA based vector element sum.
3. Comparing various launch configs for CUDA based vector element sum (memcpy).
4. Comparing various launch configs for CUDA based vector element sum (in-place).
Sum with in-place strategies of CUDA mode (reduce)
1. Comparing various launch configs for CUDA based vector element sum (in-place).
Show drafts
volume_up
Empowering the Data Analytics Ecosystem: A Laser Focus on Value
The data analytics ecosystem thrives when every component functions at its peak, unlocking the true potential of data. Here's a laser focus on key areas for an empowered ecosystem:
1. Democratize Access, Not Data:
Granular Access Controls: Provide users with self-service tools tailored to their specific needs, preventing data overload and misuse.
Data Catalogs: Implement robust data catalogs for easy discovery and understanding of available data sources.
2. Foster Collaboration with Clear Roles:
Data Mesh Architecture: Break down data silos by creating a distributed data ownership model with clear ownership and responsibilities.
Collaborative Workspaces: Utilize interactive platforms where data scientists, analysts, and domain experts can work seamlessly together.
3. Leverage Advanced Analytics Strategically:
AI-powered Automation: Automate repetitive tasks like data cleaning and feature engineering, freeing up data talent for higher-level analysis.
Right-Tool Selection: Strategically choose the most effective advanced analytics techniques (e.g., AI, ML) based on specific business problems.
4. Prioritize Data Quality with Automation:
Automated Data Validation: Implement automated data quality checks to identify and rectify errors at the source, minimizing downstream issues.
Data Lineage Tracking: Track the flow of data throughout the ecosystem, ensuring transparency and facilitating root cause analysis for errors.
5. Cultivate a Data-Driven Mindset:
Metrics-Driven Performance Management: Align KPIs and performance metrics with data-driven insights to ensure actionable decision making.
Data Storytelling Workshops: Equip stakeholders with the skills to translate complex data findings into compelling narratives that drive action.
Benefits of a Precise Ecosystem:
Sharpened Focus: Precise access and clear roles ensure everyone works with the most relevant data, maximizing efficiency.
Actionable Insights: Strategic analytics and automated quality checks lead to more reliable and actionable data insights.
Continuous Improvement: Data-driven performance management fosters a culture of learning and continuous improvement.
Sustainable Growth: Empowered by data, organizations can make informed decisions to drive sustainable growth and innovation.
By focusing on these precise actions, organizations can create an empowered data analytics ecosystem that delivers real value by driving data-driven decisions and maximizing the return on their data investment.
StarCompliance is a leading firm specializing in the recovery of stolen cryptocurrency. Our comprehensive services are designed to assist individuals and organizations in navigating the complex process of fraud reporting, investigation, and fund recovery. We combine cutting-edge technology with expert legal support to provide a robust solution for victims of crypto theft.
Our Services Include:
Reporting to Tracking Authorities:
We immediately notify all relevant centralized exchanges (CEX), decentralized exchanges (DEX), and wallet providers about the stolen cryptocurrency. This ensures that the stolen assets are flagged as scam transactions, making it impossible for the thief to use them.
Assistance with Filing Police Reports:
We guide you through the process of filing a valid police report. Our support team provides detailed instructions on which police department to contact and helps you complete the necessary paperwork within the critical 72-hour window.
Launching the Refund Process:
Our team of experienced lawyers can initiate lawsuits on your behalf and represent you in various jurisdictions around the world. They work diligently to recover your stolen funds and ensure that justice is served.
At StarCompliance, we understand the urgency and stress involved in dealing with cryptocurrency theft. Our dedicated team works quickly and efficiently to provide you with the support and expertise needed to recover your assets. Trust us to be your partner in navigating the complexities of the crypto world and safeguarding your investments.
Opendatabay - Open Data Marketplace.pptxOpendatabay
Opendatabay.com unlocks the power of data for everyone. Open Data Marketplace fosters a collaborative hub for data enthusiasts to explore, share, and contribute to a vast collection of datasets.
First ever open hub for data enthusiasts to collaborate and innovate. A platform to explore, share, and contribute to a vast collection of datasets. Through robust quality control and innovative technologies like blockchain verification, opendatabay ensures the authenticity and reliability of datasets, empowering users to make data-driven decisions with confidence. Leverage cutting-edge AI technologies to enhance the data exploration, analysis, and discovery experience.
From intelligent search and recommendations to automated data productisation and quotation, Opendatabay AI-driven features streamline the data workflow. Finding the data you need shouldn't be a complex. Opendatabay simplifies the data acquisition process with an intuitive interface and robust search tools. Effortlessly explore, discover, and access the data you need, allowing you to focus on extracting valuable insights. Opendatabay breaks new ground with a dedicated, AI-generated, synthetic datasets.
Leverage these privacy-preserving datasets for training and testing AI models without compromising sensitive information. Opendatabay prioritizes transparency by providing detailed metadata, provenance information, and usage guidelines for each dataset, ensuring users have a comprehensive understanding of the data they're working with. By leveraging a powerful combination of distributed ledger technology and rigorous third-party audits Opendatabay ensures the authenticity and reliability of every dataset. Security is at the core of Opendatabay. Marketplace implements stringent security measures, including encryption, access controls, and regular vulnerability assessments, to safeguard your data and protect your privacy.
3. Business intelligence (BI)
combines business analytics, data mining, data
visualization, data tools and infrastructure, and
best practices to help organizations to make
more data-driven decisions.
4. Identify ways to increase profit
Analyze customer behavior
Compare data with competitors
Track performance
Optimize operations
Predict success
Spot market trends
Discover issues or problems
IMPORTANCE
OF BI
5. Self-service BI tools
incorporate intuitive user interfaces
that make working with data more
accessible
for those without technical expertise!!
10. It is a cloud-based,
business analytics service
for analyzing and visualizing data.
11. Why do we need Power BI?
The smart visual way
to understand your
business data.
12. Rich personalized dashboards
Publish reports securely
No memory and speed constraints
No specialized technical support required
Extracting business intelligence rapidly and accurately
19. vs
Power BI is built on the foundation of Microsoft
Excel
but it is far more powerful than its spreadsheet
counterpart.
20. POWER BI MS Excel
Cannot show duplicate table Can show duplicate table
Does allow dashboard
refreshment
Does not allow dashboard
refreshment
Offer High level of analytics Offer Simple analytics
They are easy to use and
learn
They are comparatively
difficult to learn
21. POWER BI MS Excel
Faster Processing with table, graph, and
filtering.
Speed for processing with table, graph, and
filtering is slow.
Sharing data and report is very flexible. Dataset and report are not so flexible.
A user can build up a customized
dashboard.
A user has limited features to build up
reports.
Power BI is an advanced version of the
analytics tool with a large number of
features to play with data.
Excel is your traditional spreadsheet
program with a very long history which
leads to a vast array of features.
22. how much data
what you do
| VOLUME | VELOCITY | VARIABILITY | VERACITY |
23. 1. Easy to use
2. 90+ different sources to choose data from
3. Cost-effective, inexpensive solutions available
4. Interactive visual dashboards
5. Easily accessible from anywhere
6. Data sharing and collaboration
7. Supports natural language search