Download to read offline
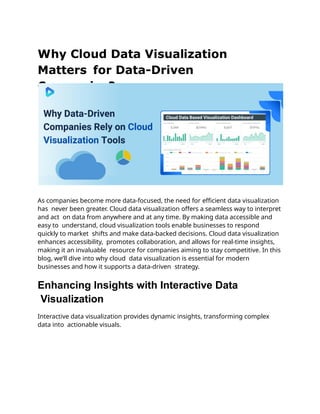


The document discusses the importance of cloud data visualization for data-driven companies, highlighting its benefits such as enhanced accessibility, collaboration, and real-time insights. It covers the role of interactive and AI-driven data visualization tools in improving decision-making, uncovering patterns, and fostering stakeholder engagement. Additionally, it emphasizes the need for effective business intelligence dashboards and graph visualization tools to support data governance and analytics, ultimately promoting a data-driven culture within organizations.